
Chapter 18. Logging Events
This chapter discusses how to set up logging on your perimeter router. Logging is an important process in keeping track of events that occur in your network, especially on your perimeter router. On your perimeter router, you definitely will want to keep track of intrusions and attacks, and the router’s logging function can greatly assist in this process.
In this chapter, you learn how to use the various log facilities of a Cisco router, including the console, buffer, and syslog locations. Because timing and time stamps are important for understanding the sequence of events, this chapter covers how to set up time on your router, including manual time settings and the Network Time Protocol (NTP).
New in Cisco IOS 12.3(2)T is the Embedded Syslog Manager (ESM) feature, which allows your router to perform tasks based on the type or severity of a log message. ESM uses Tcl, which provides a lot of flexibility in coding what actions your router will perform. I also discuss other third-party products that you can use to make the management of your log files easier.
These topics are covered in this chapter:
• Time and date and the Cisco IOS, including manual time configuration and NTP
• Additional logging information, including logging tools
Basic Logging
Log messages commonly are referred to as system error messages in the Cisco IOS. Each of these messages has a severity level assigned to it, along with a description indicating the seriousness of the problem or event. The Cisco IOS sends logging messages, including output from debug commands, to a logging process. By default, this is only the console interface; however, you can log messages to the router’s internal buffer; terminal lines, such as the auxiliary and vtys; a syslog server; and an SNMP management station.
%<facility>-<severity>-<mnemonic>: <message_text>
Here is a simple example:
%LINK-5-CHANGED: Interface Ethernet1, changed state to
administratively down
Assuming that you have enabled time stamps, as well as sequence numbers, for your log message, you will see the following, with the sequence number first, followed by the time stamp and then the actual message:
000022: Jan 02 15:42:11.048:%LINK-5-CHANGED: Interface Ethernet0,
changed state to administratively down
Adding time stamps and sequence numbers to your router’s logging output is discussed in the “Date and Time Stamps” section.
Basic Logging Configuration
You will want to do two basic tasks when setting up logging: enable logging and control the display of logging on your lines. The following two sections discuss these two configuration tasks.
Enabling Logging
By default, logging is enabled on your router for the console line only. Logging must be enabled and configured for any other logging destination. To enable logging, use the following command:
Router(config)# logging on
Using the logging on command, you enable any other configured destination for logging, such as a syslog server or the router’s internal buffer, for logging. This command must be enabled before you can log system messages to locations other than the console port; however, you can control individually which processes will receive logging messages with other logging commands, as discussed later in the “Logging Destinations” section. For example, if you have configured commands for logging messages to a syslog server but you have not executed the logging on command, the Cisco IOS logs messages only to the console line.
Configuring Synchronous Logging
The main purpose of the logging synchronous command is to synchronize the logging output for messages and debug output to the router’s lines: console, auxiliary, and VTY. For example, one annoying thing about logging events on your router’s lines is that you might be typing in a command, and the router displays a message on the line right in the middle of your typing. This message has no bearing on the command that you are typing, and you can continue typing to complete your command; however, this behavior can be annoying.
The main purpose of synchronous logging is to control when messages are displayed on your router’s lines. When it is enabled, synchronous logging causes the Cisco IOS to display the message and then perform the equivalent of a ctrl-R, which causes the router to redisplay the information that you have typed on the command line. Example 18-1 shows a simple example of the process without synchronous logging.
Example 18-1 Displaying Logging Information Without Synchronous Logging
Router(config)# end
Router# show ru
2w2d: %SYS-5-CONFIG_I: Configured from console by consolenning-config
Notice how the command show running-config was interrupted by a Cisco IOS log message. If you enabled synchronous logging, you would see the output in Example 18-2 instead.
Example 18-2 Displaying Logging Information with Synchronous Logging
Router(config)# end
Router# show run
2w2d: %SYS-5-CONFIG_I: Configured from console by console
Router# show run
In Example 18-2, in the middle of typing the show running-config command, a log message was placed on the screen. Then the information that you previously entered on the command-line interface (CLI) is redisplayed.
You can affect the displaying of log messages to your lines with the logging synchronous command, shown here:
Router(config)# line type #
Router(config-line)# logging synchronous
[level severity_level | all] [limit #_of_lines]
The severity level refers to the severity level of logging messages that are printed asynchronously. Messages with a severity number higher than this value are displayed synchronously (less severe messages); messages with a lower number (more severe) are displayed asynchronously. The default severity level is 2. The all parameter causes all messages to be displayed asynchronously, regardless of their assigned security level.
The limit parameter specifies how many synchronous messages should be queued up before the router starts dropping new messages. The default value is 20 messages. If the router has to drop messages because it reaches this threshold, you will see the following log message indicating the number of messages that the router had to drop:
%SYS-3-MSGLOST #_of_messages due to overflow
The main disadvantage of synchronous logging is that when your router is generating a lot of messages and you are typing slowly in the CLI, the router must drop any messages above this threshold. Thus, you never will see these messages on your lines. If it is critical that you see these kinds of events, I highly recommend that you log them to either the router’s internal buffer, a syslog server, or an SNMP management station.
Caution
Be careful about setting large queue limits to nonconsole lines, such as VTYs. If a hacker has access to a VTY on your router and synchronous logging is enabled for your VTYs, the hacker could leave the VTY idle in the middle of a command in the CLI. This would cause the Cisco IOS to fill up the large queue with messages, possibly consuming your router’s entire memory. In certain cases, the router stops handling other processes, such as traffic forwarding. In the worst case, the router might reload itself.
Logging Destinations
You can forward logging information to four basic destinations:
• Lines
• Internal buffer
• Syslog server
• SNMP management station
The following sections discuss how to set up logging using these destination options, after covering log messages and security levels.
Severity Levels
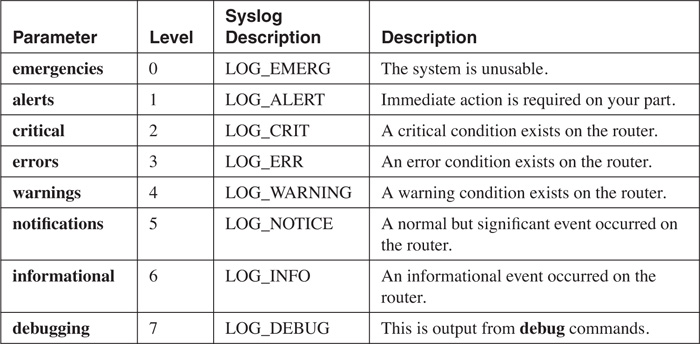
Before I discuss logging to the four destination types, I need to cover log messages and security levels. Each log message is associated with a security level, which ranks the seriousness of the message: The lower the number is, the more severe the message is. Severity levels range from 0 (the highest) to 7 (the lowest). Table 18-1 contains an overview of the severity levels. The Parameter column gives the name of the logging level. The Level column lists the corresponding severity level. With the logging commands, you can specify the severity by number or name.
Note
If you use the log keyword in an ACL statement, this output will be displayed on the console only if the severity level is set to 6 or 7.
One thing that you can control for logging functions is which messages are logged for the four destinations. For example, on the console, you could limit logging to messages at severity level 4 (which displays messages from 0 to 4); but for a syslog server, you could set it to 6 (0 to 6).
Line Logging
Two commands are used for controlling logging messages sent to the router’s lines:
Router(config)# logging console [severity_level]
Router(config)# logging monitor [severity_level]
It is important to point out that the logging console command refers to logging to physical TTYs, such as the console and auxiliary lines. The logging monitor command refers to logging to logical VTYs, such as Telnet sessions. By default, logging to the console is enabled for all levels; however, you can modify this by changing the severity level in the logging console command. Valid severity parameters are listed in the first column of Table 18-1.
Logging to VTYs and the AUX is disabled by default and requires that you either execute the privileged EXEC terminal monitor command, which duplicates console logging messages to the VTYs, or configure the logging monitor command. If you use the latter approach, you do not need to execute the terminal monitor command to see TTY line log output when you initially access a router’s VTY. When configuring the logging monitor command, if you do not specify the severity level, it defaults to 7 (debug).
Note that, with both commands, you still must enable logging with the logging on command.
Tip
Because of the processing burden placed on routers to log messages to terminal lines, such as the console, I highly recommend changing the severity level to something higher than debug (lower number). If you need to see messages with lower severity levels, use either the router’s internal buffer, a syslog server, or an SNMP management station.
Caution
If you disable the logging on command in the middle of a process generating error or debug messages, the router might slow down considerably until these messages are displayed on the line of the router. Therefore, be careful about the severity level assigned to logging messages displayed on the console line.
Internal Buffer Logging
One problem of logging messages to TTYs or VTYs is that if you are not actually looking at the screen for the attached line and the message scrolls past the screen and out of your terminal software’s history buffer, there is no mechanism to see missed messages. This problem can be alleviated by logging the messages to a destination other than a line.
One solution is to log messages to the router’s internal buffer, which is either enabled or disabled by default, depending on the router platform; in most platforms, it is enabled by default. To set up logging to the router’s buffer, use the following command:
Router(config)# logging buffered [buffer_size | severity_level]
This command has two parameters. The buffer_size parameter refers to the size, in bytes, that should be allocated to the internal buffer. This can be from 4096 to 4,294,967,295 bytes. To set the buffer size back to the factory default, use the default logging buffered command. The severity_level parameter refers to the severity level of messages that should be logged, as discussed in Table 18-1. Note that the default size and severity level (typically 7) depend on the router platform model.
Caution
Be careful about setting the size of the buffer too large: With many messages, this can cause the router to run out of memory, possibly causing it to crash.
Syslog Server Logging
Enabling logging to a syslog server is slightly more complicated than setting up logging to a line or to the internal buffer, where either no configuration command or a couple of configuration commands are necessary. Here are the basic commands to set up logging to a syslog server:
Router(config)# logging on
Router(config)# logging host {IP_address | hostname}
Router(config)# logging trap severity_level
Router(config)# logging source-interface interface_type interface_#
Router(config)# logging origin-id {hostname | ip | string string}
Router(config)# logging facility facility_type
The logging on command allows logging to nonconsole destinations. The logging host command specifies either the IP address, the host name, or the fully qualified domain name (FQDN) of the syslog server. If you enter this command more than once with a different syslog server destination, you can build a list of syslog servers that the router can use. However, the more servers you list, the more duplication of log messages the router must process.
Note
Before Cisco IOS 12.2(15)T, trap logging was enabled using the logging {hostname | IP_address} command. Now, use the logging host command.
The logging trap command specifies the severity level of log messages to send to the syslog server. The default is informational; these parameters were discussed in Table 18-1.
By default, whichever interface the router uses to reach the syslog server is the IP address placed in the source IP address field of the IP packet header. To create consistent log entries so that the same address is used on a router, use the logging source-interface command. With this command, you must specify the name and number of the interface, as in ethernet 0. This command is necessary only if the router has two or more interfaces to reach the syslog server, but you want to ensure that, for consistency, the same source address is used in the syslog packets. This makes it easier to implement filtering rules to prevent unwanted log messages on the syslog server.
In 12.2(15)T, Cisco added the capability to insert information about the router’s identity into the syslog message, making it easier to search for or separate information on the syslog server on a per-router basis. This is accomplished with the logging origin-id command, which is disabled by default. Your identification choices are hostname (the name configured with the hostname command), ip (the IP address of the sending interface), and string (a string you defined that is used to identify the router). If the string contains spaces, you must enclose it in quotation marks.
The logging facility command defines the facility to use on a syslog server running UNIX, where the log messages will be stored. The Cisco IOS supports the facility types listed in Table 18-2.

If you do not specify a facility, it defaults to local7. On a UNIX system, you can specify the location of the log file for the facility that you specify by editing the appropriate configuration file. For example, on a BSD 4.3 UNIX system, edit the /etc/syslog.conf file and create an entry for your facility. Here is a simple example:
local7.debugging /usr/adm/logs/router.log
In this example, the facility level is local7 and the debugging keyword specifies the syslog logging level. The syslog level affects which levels of messages are stored in the filename that follows: Any message at this severity level or higher is stored in the specified file (/usr/adm/logs/router.log).
To sum up the configuration of a syslog server, see the network shown in Figure 18-1.
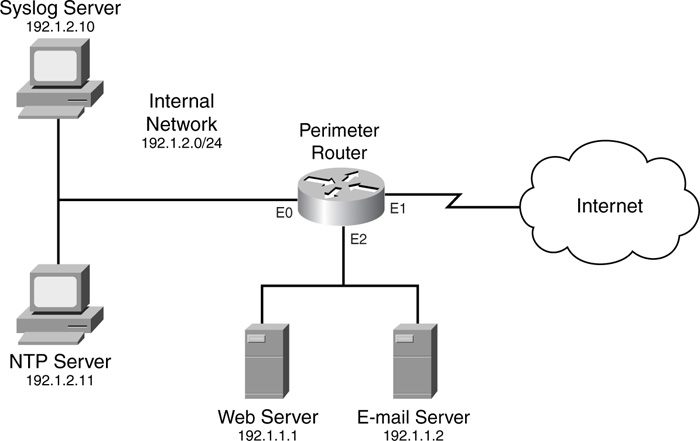
Example 18-3 shows the router’s configuration.
Example 18-3 Setting Up Basic Syslog Logging on a Router
Router(config)# logging on
Router(config)# logging host 192.1.2.10
Router(config)# logging trap informational
Router(config)# logging source-interface ethernet 0
Router(config)# logging origin-id string Perimeter1
This example is straightforward. The first command enables logging. The second command specifies the internal syslog server, and the third command sets the logging severity level. The fourth command specifies that the source IP address of ethernet 0 should be used in syslog packets. The last statement sets the origin information to Perimeter1, which appears in the log messages, making it easier to search for log messages from this router.
SNMP Logging
The last location that you can have log messages sent to is an SNMP management station. I briefly discussed the configuration of SNMP in Chapter 3, “Accessing a Router.” In this section, I focus only on the configuration of commands to log information to the management station. To enable log messages to be sent to an SNMP management station, you first need to execute the following command:
Router(config)# snmp-server enable trap syslog
After this, three commands control logging information to the management station:
Router(config)# logging on
Router(config)# logging history severity_level
Router(config)# logging history size number
I already discussed the use of the first command. The second command specifies the severity level of log messages that should be sent to the SNMP management station. The default level is warning (you can see the list of severity levels in Table 18-1). Because SNMP uses UDP, and UDP is unreliable, syslog traps are stored in a history table on the router. At least one syslog message, the most recent one, is stored in the history table (the default is one message). You can increase this up to 500 with the logging history size command.
Note
Starting with Cisco IOS 12.2(1.4), you can have the Cisco IOS log each NAT translation that it builds by using the ip nat log translations syslog command. This can be useful in troubleshooting address-translation problems.
Other Logging Commands
This section covers three miscellaneous logging commands: adding time stamps to log messages, adding sequence numbers to log messages, and rate limiting log messages.
Date and Time Stamps
By default, log messages do not include a date and time stamp. Having a date and time stamp included on each log message is useful in determining when events occurred, especially if you are not sitting in front of the console monitoring the events. To enable date and time stamps, use one of the two following commands:
Router(config)# service timestamps {debug | log} uptime
or:
Router(config)# service timestamps {debug | log} datetime
[msec] [localtime] [show-timezone] [year]
Time stamps can be added to two types of messages: debug and logging messages. The debug parameter causes the Cisco IOS to include a time stamp in debug output. The log parameter causes the Cisco IOS to include a time stamp in any type of log message. The first command, with the uptime parameter, has the Cisco IOS include the amount of time since the router has been up in the message. Here is an example:
1w0d: %SYS-5-CONFIG_I: Configured from console by console
In this example, the router had been up 1 week and 0 days when this message was generated.
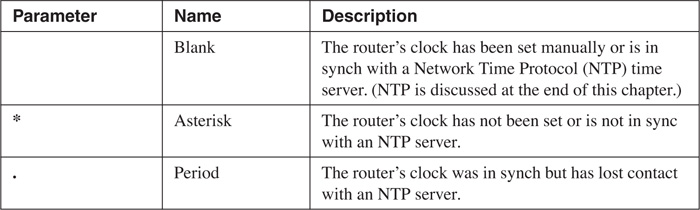
If you want an exact date and time, use the datetime parameter. This parameter causes the Cisco IOS to include the date and time along with the message (the date and time are in a UTC format). Here is the standard format: MMM DD HH:MM:SS. When using the datetime parameter, you have some optional parameters. The msec parameter causes the Cisco IOS to include milliseconds in the message. localtime causes the Cisco IOS to display the time based on the time zone configured locally on the router. By default, the year is not included in the time, but using the optional year parameter overrides this behavior. The show-timezone parameter causes the Cisco IOS to include the time zone name in the output of the date and time. Here is a simple example in which the log parameter was used with datetime, localtime, and show-timezone:
.May 23 11:13:25 UTC: %SYS-5-CONFIG_I: Configured from console by console
You will notice something interesting about the previous message: It begins with a period (.). A log message begins with one of three characters: a blank, an asterisk, or a period. Table 18-3 explains the use of these characters. In the previous example, the router’s clock was in sync with an NTP time server, but it lost connectivity to the server, so the router’s time might not be exactly correct. Basically, these parameters reflect the authority or reliability of the time source.
Sequence Numbers
Besides adding time stamps to log messages, you can have the Cisco IOS display a sequence number in each message. This is accomplished with the following command:
Router(config)# service sequence-numbers
Here is an example with both sequence numbers and time stamps enabled:
000039: .Dec 30 11:38:541 EST: %SYS-5-CONFIG_I: Configured from
console by console
In this example, the sequence number is 39, indicating the 39th message that was logged.
Rate Limits
Starting in Cisco IOS 12.1(3)T, you can limit the rate of logging messages on a per-second basis with the logging-rate command, shown here:
Router(config)# logging rate-limit
{number | all number | console number} [except severity]
By default, no limits are configured on the router. By specifying a number between 1 and 10,000, you are limiting the number of logging messages per second to this value. The all keyword, followed by a number, affects all logging and debugging messages. The console keyword limits the rate of logging messages to the console. The except parameter creates an exception for the messages at the specified severity level and higher.
Example 18-4 shows a simple example of configuring rate limiting for log messages.
Example 18-4 Configuring Logging Rate Limiting
Router(config)# logging rate-limit console 2 except 2
Router(config)# logging rate-limit 50 except 3
In this example, the first command limits logging of messages to two per second to the console, unless the message severity level is between 0 and 2. The second command applies to rate limiting of all other log messages to 50 per second, except for those with a severity level between 0 and 3.
Tip
I highly recommend that you use this command, especially on the console interface, to reduce the overhead that the router must deal with when a flood of messages occurs because of an attack. You can use this command without taking an adverse performance hit.
Logging Verification
After you have configured logging, you can use various show commands to verify your logging configuration and operation.
show logging Command
The show logging command displays the current state of syslog error and event logging, including any configured syslog server addresses, which types of logging are enabled, and logging statistics. Here is the format of the command:
Router# show logging [summary]
Example 18-5 shows sample output from this command.
Example 18-5 Using the show logging Command
Router# show logging
Syslog logging: enabled (0 messages dropped, 1 messages rate-limited, 0 flushes)
Console logging: level debugging, 31 messages logged, xml disabled
Monitor logging: level debugging, 0 messages logged, xml disabled
Buffer logging: disabled, xml disabled
Logging Exception size (4096 bytes)
Count and timestamp logging messages: enabled
Trap logging: level informational, 187 message lines logged
Logging to 192.1.2.10, 187 message lines logged
In this example, syslog logging has been enabled and one log message has been rate limited. Console and monitoring logging are enabled and set to a severity of debugging. Time stamps also are enabled. At the bottom, you can see that the logging level for traps (syslog) is informational, with a total of 187 messages logged to the syslog server at 192.1.2.10.
If you have enabled logging to the router’s internal buffer, you also can see logging messages with the show logging command, as in Example 18-6.
Example 18-6 Using the show logging Command to View Buffered Log Messages
Router# show logging
Syslog logging:enabled (0 messages dropped, 0 flushes, 0 overruns)
Console logging: level errors, 32 messages logged, xml disabled
Monitor logging:level errors, 0 messages logged
Buffer logging:level debugging, 106 messages logged
Trap logging:level debugging, 121 message lines logged
Logging to 192.1.2.10, 121 message lines logged
Log Buffer (6144 bytes):
Dec 11 13:18:49 EDT: NTP: Maxslew = 189739
Dec 11 14:16:42 EDT:%SYS-5-CONFIG:Configured from
tftp://192.1.2.9/perimeter.cfg
<--output omitted-->
To clear the log messages from the internal buffer, use the clear logging command.
The summary option in the show logging command displays counts of messages by type, as in Example 18-7.
Example 18-7 Using the summary Parameter with the show logging Command
Router# show logging summary
+-----+-------+-------+------+-------+-------+-------+------+------- +
SLOT | EMERG | ALERT | CRIT | ERROR |WARNING| NOTICE| INFO | DEBUG |
+-----+-------+-------+------+-------+-------+-------+------+------- +
|* 0* | . | . | . | . | . | . | . | . |
| 1 | | | | | | | | |
| 2 | | | | 2 | 5 | 48 | | |
| 3 | | | | | | | | |
| 4 | | | | 1 | 5 | 58 | | |
| 5 | | | | | | | | |
| 6 | | | | | | | | |
| 7 | | | | 19 | 5 | 52 | | |
| 8 | | | | | | | | |
| 9 | | | | 2 | 5 | 55 | | |
| 10 | | | | | | | | |
| 11 | | | | 8 | 5 | 67 | | |
+-----+-------+-------+------+-------+-------+-------+------+------- +
The first column, SLOT, indicates which slot in the chassis the log messages apply to.
Note
The show logging summary command is supported only for certain router models. In other router models, the show logging count command is used, as discussed in the next section.
show logging history Command
The show logging history command displays the syslog history table size, the status of the messages in the table, and the messages themselves. Remember that the history table is used to log messages to an SNMP management station. Example 18-8 shows sample output from this command.
Example 18-8 Using the show logging history Command
Router# show logging history
Syslog History Table: 1 maximum table entries,
saving level notifications or higher
0 messages ignored, 0 dropped, 8 table entries flushed,
SNMP notifications not enabled
entry number 9: SYS-5-CONFIG_I
Configured from console by console
timestamp: 1120
In this example, the table size is the default value, 1, and any event at a severity level of notification or higher is logged. Eight entries were flushed from the table to make room for new ones. Currently, the latest entry in the table is entry no. 9.
Logging and Error Counts
Starting with Cisco IOS 12.2(8)T, Cisco introduced the Error Log Count feature. This is a useful feature if you are using the router’s internal buffer and older messages are being aged out. With this feature, the Cisco IOS still keeps track of the number of occurrences of a particular log message, as well as the last occurrence of the message. This can be useful if the internal buffer cannot hold all of your messages, but the same error or problem continually is recurring and shows up in the output of your error counts. This feature basically supplants the show logging summary command discussed in the last section.
Enabling this features is simple. From configuration mode, execute the following command:
Router(config)# logging count
This command causes the Cisco IOS to count each log message, including the time stamp of the last occurrence for each message type.
After enabling this feature, you can see the error count with the show logging count command, as in Example 18-9.
Example 18-9 Viewing Error Counts for Log Messages
Router# show logging count
Facility Message Name Sev Occur Last Time
=====================================================================
SYS BOOTTIME 6 1 00:00:15
SYS RESTART 5 1 00:00:14
SYS CONFIG_I 5 2 1d02h
------------- ------------------------------- ---------------------
SYS TOTAL 5
LINEPROTO UPDOWN 5 13 00:00:21
------------- ------------------------------- ---------------------
LINEPROTO TOTAL 13
LINK UPDOWN 3 1 00:00:20
LINK CHANGED 5 12 00:00:10
------------- ------------------------------- ---------------------
LINK TOTAL 13
<--output omitted-->
In Example 18-9, you can see that the messages are broken down by category.
Time and Date and the Cisco IOS
All Cisco IOS routers support manual and dynamic time services. Time services allow the router to keep track of the current date and time. Having your networking equipment synchronized to the same date and time is important when attempting to troubleshoot problems from syslog messages. This section discusses how to configure time on your router manually, as well as how to use the Network Time Protocol (NTP) to assign the time on your router dynamically. The following sections cover time sources that the router can use and how to configure the date and time manually as well as using NTP.
Router Time Sources
Most Cisco routers have a hardware and software clock, which can be managed separately. The following two sections discuss these two clocks.
Hardware Clock
The hardware clock, often called a system calendar clock, is a battery-powered clock that keeps track of the date and time even when the router is powered off. Most routers have a hardware clock. If no other time source is available, the router uses its hardware clock to provide the date and time. Because the clock is powered by a battery, if the battery dies, the clock defaults to a hard-configured date and time, as shown here:
00:00:00.000 UTC Mon Mar 1 1993
Software Clock
The router’s software clock is the primary source for the date and time. It begins when the router starts up and ends when the router shuts down. Initially, the software clock gets the date and time from the hardware clock, when the router is booting up; however, the software clock can get its date and time from a number of sources, including these:
• NTP
• Simple Network Time Protocol (SNTP)
• CLI commands
Because the software clock can be updated dynamically from a more reliable source, like NTP, it typically has a more accurate date and time than the hardware clock.
The router uses the software clock to provide the date and time to the following services:
• The hardware clock
• NTP, if the router is an NTP server
• Log messages
• Debug messages
• Various show commands
• Time ranges in ACLs
The default time zone of the software clock is Coordinated Universal Time (UTC), which also is referred to as Greenwich Mean Time (GMT). However, you can override this with a manual configuration, in which you can specify the router’s time zone as well as daylight savings time, sometimes referred to as summer time.
Manual Time and Date Configuration
If the hardware clock’s battery is dead and you have no other time source to synchronize your router with, you can manually configure the current date and time after the router boots up. However, you should use this only as a last resort because you would have to change the time setting manually every time the router reboots. The following sections discuss how to configure your router’s time settings manually.
Time Zone
As I mentioned at the beginning of this section, the default time zone is UTC. To change the time zone, use the clock timezone command, shown here:
Router(config)# clock timezone zone_name hours_offset
[minutes_offset]
The zone_name parameter is the name of time zone. This is the standard acronym, such as EST for Eastern Standard Time. The hours_offset parameter is the number of hours, plus or minus, different from UTC. For example, New York City would be –5. Typically, the minutes_offset parameter is not used; however, certain time zones, such as Atlantic Canada Standard Time (AST) is 3.5 hours different from UTC. This is represented as –3 30. Here is a simple example for setting the time zone for a router in Orlando, Florida:
Router(config)# clock timezone EST -5
Tip
If you will be logging messages from routers in different time zones to a syslog server, Cisco recommends that you use UTC as the time zone on all your routers. This alleviates any confusion about two attacks occurring in two different time zones and determining whether the attacks are occurring simultaneously. This recommendation also applies to troubleshooting problems.
Daylight Saving Time
If your time zone follows daylight saving time (DST), commonly referred to as summer time, you can configure this setting on your router with the clock summer-time command. If your time zone uses the standard times and dates for the beginning and end of the summer time clock change, you can use this command to set up DST:
Router(config)# clock summer-time zone_name recurring
[1-4 | first | last] [day month hh:mm day month hh:mm [offset_value]]
After you specify the name of the time zone, specify which week the time change occurs: 1 through 4 is the number of the week, first is the first week of the month, and last is the last week. If you do not specify the week, day, month, and time, it defaults to the standard for the time change. Likewise, if you omit the offset value, it defaults to 60 minutes, which is added to the current time when the first time is reached in the spring, and then is subtracted from the current time when the second time is reached in the fall. Here is a simple example, using the default settings, for Orlando, Florida:
Router(config)# clock summer-time EDT recurring
If your router uses nonstandard days for changing your clock’s time, use either of the following two commands:
Router(config)# clock summer-time zone_name date
month day year hh:mm month day year hh:mm [offset]
or:
Router(config)# clock summer-time zone_name date
day month year hh:mm day month year hh:mm [offset]
With these two commands, you must specify the exact date and time when summer time begins and ends.
Software Clock Settings
If your router’s software clock is synchronized to an external time source, such as an NTP server, it is not necessary to configure the software clock’s time settings manually. However, if your router is not synchronized to an external time source, you can manually change the time on the router to set it correctly. This is accomplished with either of the following privileged EXEC commands:
Router# clock set hh:mm:ss date month year
or:
Router# clock set hh:mm:ss month date year
Here is a simple example:
Router# clock set 12:34:00 November 19 2003
If you want to resynchronize the software clock with the hardware clock, use this command:
Router# clock read-calendar
To view the time and date of the software clock, use the show clock command, as in Example 18-10.
Example 18-10 Viewing the Date and Time of the Software Clock
Router# show clock
12:34:58.015 EST Wed Nov 19 2003
The show clock detail command displays the current time as well as your clock settings, as shown in Example 18-11.
Example 18-11 Using the show clock detail Command
Router# show clock detail
12:35:51.431 EST Wed Nov 19 2003
Time source is user configuration
Summer time starts 02:00:00 EST Sun Apr 4 2004
Summer time ends 02:00:00 EDT Sun Oct 31 2004
Hardware Clock Settings
Normally, the only time that the hardware clock is used is initially to give the software clock the correct date and time when the router boots up. After this, the software clock is responsible for ensuring that the hardware clock is updated with the correct time. This way, if you are using NTP and the clock battery in your router is dead, NTP will update the software clock, which, in turn, updates the hardware clock with the correct date and time. The software clock does this at regular intervals.
To change the time of the hardware clock manually, use either of the two following commands:
Router# calendar set hh:mm:ss day month year
or:
Router# calendar set hh:mm:ss month day year
Note that the calendar set command is not supported on all router models. Use the show calendar command to view the time of the hardware clock.
To set the hardware clock from the software clock, use the following command:
Router# clock update-calendar
Network Time Protocol Overview
NTP, which runs on top of UDP, is an IP protocol used to synchronize time across devices in a network. NTP supports three versions; the newest version, version 3, is defined in RFC 1305. NTP uses a client/server function.
Time Distribution
The server is an authoritative source of time and, as such, should have the most correct time among all devices. This can be supplied by a radio or atomic clock, or even a GPS device. NTP uses the term stratum to describe how many hops away the source of time is. For example, a stratum 1 time source is the NTP master server with a reliable clocking mechanism that the server uses to derive time. Each part of your network might have an additional NTP server. These servers are stratum 2 time sources because they derive their time from the NTP master server. The servers are responsible for giving the time to other lower-stratum servers as well as clients.
Note
Cisco routers can be NTP servers. In this function, I highly recommend that you not use the router’s hardware clock. Instead, attach an external timing device. Cisco routers do not support radio or atomic clocks for external timing devices, but they do support certain GPS devices. I discuss this later in the “NTP: Server” section.
Distribution of time can be accomplished by the server periodically broadcasting the time or the client requesting the time periodically from the server. When the broadcast method is used in a Layer 2 network, it ensures that, because only one packet is sent, all devices typically have the same time, within a millisecond or so of each other. However, broadcasting has two problems:
• It is easy to spoof, so your timing information could be corrupted.
• It does not work well in a Layer 3 network.
Because of these problems, most NTP implementations have the clients periodically request the time from the server. NTPv3 does support authentication, which greatly reduces the likelihood that a spoofing attack will occur on your timing infrastructure; however, this feature is supported only in client polling, not broadcasting.
Simple Network Time Protocol
A simplified form of NTP, called the Simple Network Time Protocol (SNTP), can be used on clients to derive time, but not to pass time to other devices. For example, when using SNTP, the old (and discontinued) Cisco 1000 series routers, can only accept time from an NTP server; they cannot, in turn, pass the timing information to devices behind them. Unlike the NTP distribution method, SNTP typically provides accuracy of time within 100 milliseconds, and it does not support authentication (NTPv3). Because of these limitations, SNTP should be used only if your router does not support NTPv3.
The remaining part of this section deals with how to configure NTP on your router. I focus on three areas: how to configure your router as a client, how to configure your router as a server, and how to verify your NTP configuration.
Router Client Configuration for NTP
By default, NTP is disabled on all your router’s interfaces. Your router, acting as a client, can use two methods to gain the most up-to-date time from an NTP server: periodically polling an NTP server or listening for periodic broadcasts from NTP servers. The following two sections discuss the configuration of both of these services.
Poll-Based Configuration
Clients can use two different polling modes to acquire their timing information from NTP servers:
• Client mode
• Symmetric active mode
In client mode, the client polls all NTP servers in its configuration for the time and then picks one server to use. This mode is a client/server mode, with the router acting as a client. This mode typically is used if the router will not be sending time to other devices. The ntp server command is used to specify the information to access the NTP servers.
In symmetric active mode, the router polls the configured time servers for the current time and also sends time to time servers. This mode typically is used to synchronize the group of NTP servers themselves at the same stratum level. The ntp peer command is used to specify the other NTP server peers of the router.
Tip
In either mode, a large number of polling requests by a router can affect memory and CPU resources. You should limit the number of peerings that a router has, as well as the number of clients that a router passes time to. In large networks, it is not uncommon to have a hierarchy of time sources to reduce this burden. An alternative solution for large Layer 2 networks is to use broadcasts to disseminate time, as discussed in the next section.
Here is the router command to define other NTP servers:
Router(config)# ntp {server | peer} IP_address [version number]
[key keyid] [source interface] [prefer]
If the router is functioning as only a client, use the server parameter; otherwise, if the router is acting as a server and is peering to other servers, use the peer parameter. Following this is the IP address of the remote NTP server. If you do not specify the version number for NTP, it defaults to 3 (NTPv3). The optional keyid parameter references authentication information to be used to verify the server or peer’s timing communications. I discuss this later. The source parameter specifies what IP address on the router to use as the source address in the IP packet header when sending communications to the remote NTP server. If you omit this parameter, it defaults to the address of the outgoing interface. When you are entering multiple NTP servers, you can use the prefer parameter, which specifies that this NTP server is preferred over other servers for synchronization purposes.
Note
If you are attempting to use NTPv3 and time synchronization is failing, you might want to try using NTPv2. However, remember that NTPv2 does not support authentication and is thus susceptible to spoofing attacks.
Broadcast-Based Configuration
Broadcast-based synchronization is preferred in larger Layer 2 networks, especially in networks where bandwidth, memory, and CPU resources are limited. Only one mode exists for broadcast-based configuration: broadcastclient mode. Unlike poll-based synchronization, in broadcastclient mode, the client passively listens for NTP broadcasts from an NTP server. Obviously, for this to work, the client and server must be in the same subnet. Enabling broadcastclient mode is done under a router’s interface:
Router(config)# interface type [slot_#/]port_#
Router(config-if)# ntp broadcast client
Router(config-if)# ntp broadcastdelay microseconds
Enable this command only on the interface(s) on which you have NTP servers, to reduce the likelihood of an NTP server spoofing attack. The ntp broadcast client command enables the NTP client function on the specified interface to accept time broadcasts from NTP servers. The ntp broadcastdelay command is optional. By default, the router compensates for the time delay between the NTP server and the router by adding 3000 microseconds to the NTP servers’ advertised time, to adjust for travel delay. You can change this to more accurately affect the delay. This value ranges from 1 to 999,999 microseconds.
SNTP Configuration
SNTP should be used only on routers that do not provide support for NTP. Some Cisco routers that do not provide support for NTP are the 1000, 1600, and 1700 series, depending on the software version running on them.
If your router will be polling the NTP server periodically, use this command:
Router(config)# sntp server {IP_address | hostname} [version number]
You need to specify only the IP address or hostname of the NTP server. The version number defaults to 1 if you omit it.
If your router will be using time synchronization broadcasts from an NTP server, use this command:
Router(config)# sntp broadcast client
Note
If you configure both of these commands, the router prefers the time from the configured server over broadcasts received from an NTP server. Also, because SNTP does not use authentication, it should be used only as a last resort for a time-synchronization solution.
Router Server Configuration for NTP
Besides performing client functions, a router can be an NTP server. This is very useful in remote office environments, in which the perimeter router at these locations can function as both a client and a server, acquiring timing information from the corporate NTP servers and then, acting as a server, passing this information to the remote office devices behind it.
Distributing Timing Information
I already discussed how to set up peer relationships between routers acting as NTP servers at the same stratum level (ntp peer command), as well as how a router can access timing information directly from a server at a higher level (ntp server command).
If your router, acting as an NTP server, will be using broadcasts to disseminate timing information, you need to configure the following command on each interface where you want your router to advertise its time synchronization information:
Router(config)# interface type [slot_#/]port_#
Router(config-if)# ntp broadcast [version number]
If you omit the version, it defaults to 3 (NTPv3).
Configuring an External Clock
As I mentioned at the beginning of the “Time Distribution” section, you can have your router act as an NTP server and obtain clocking information from an externally attached device. You would choose this option if you want your router to be the master NTP server in your network.
Cisco does not support stratum level 1 clocking services, such as atomic or radio clocks; however, it does support certain GPS-based devices (stratum level 2) that you can attach to your router. Your router then can use these devices to obtain timing information, which, in turn, can be redistributed through NTP. When attaching a GPS to a Cisco router, you need a free line. Typically, most administrators do not use the auxiliary port on the router for WAN or CLI communications, so you can attach the GPS device to this.
Not all routers support the attachment of an external clock to them. Cisco supports two types of GPS clocks:
• Trimble Palisade NTP synchronization kit (works only with the 7200 series routers)
• Symmetricom (Telecom-Solutions) GPS clock kit (works only with certain router models)
Note
Before you buy a GPS clock for your router, make sure that Cisco supports the GPS product and that your router has the capability to obtain timing information from it—only certain routers support this feature. If your router does not support this feature, you need some other device to use as a master time reference. Most UNIX and Windows server products support external GPS devices.
If you have the Trimble GPS clock and are attaching it to the auxiliary port of a 7200 router, you need to configure the following on your router:
Router(config)# line aux 0
Router(config-line)# ntp refclock trimble pps none stratum 1
The ntp refclock command tells the 7200 that it has a Trimble GPS clock attached. The pps parameter indicates the type of pulse-per-second reference support: In the case of Trimble, this is set to none. Because this is probably the root time source for your network, you define the time source as a stratum service level of 1.
If you are connecting a Symmetricom GPS product to your router’s auxiliary port or TTY line, you use the following configuration:
Router(config)# ntp refclock telecom-solutions pps {cts | ri | none}
[inverted] [pps-offset number]
[stratum number] [timestamp-offset number]
Depending on the Symmetricom GPS product, you need to choose the pulse-per-second (PPS) option as either CTS, RI, or none. The inverted option indicates that the PPS pulse is inverted; the pps-offset option indicates the PPS pulse offset, in milliseconds. The stratum option refers to the NTP stratum level of service that this router will provide as a clock source. This can range from 0 to 15. If this router is the master clock, choose 1. You also can apply an offset to any time stamp that the router generates with the timestamp-offset option, which is specified in milliseconds.
Setting Up the NTP Server
If your router will be an authoritative NTP server, as typically would be the case if you attached a GPS unit to it, you must configure the following on your router:
Router(config)# ntp master [stratum_level]
Note
Be careful about using this command in a network that has other master NTP servers. The stratum level appropriately should affect the router’s source of clocking information. If this router has the same stratum level of other NTP servers, time-keeping instability issues can arise if the NTP servers do not have their timing information synchronized.
NTP Security
You can take two security measures to create a more secure NTP environment for your router:
• Use access groups to restrict who can access the router’s NTP resources.
• Use authentication with the MD5 hashing function to restrict NTP communications between trusted devices.
The following two sections discuss these solutions.
Access Groups
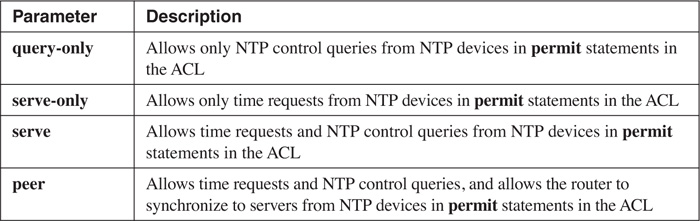
Access groups enable you to define a standard ACL that is used to filter types of NTP messages that the router receives. This feature is useful if your router is an NTP server and you want to restrict NTP access to it. The syntax of the command is as follows:
Router(config)# ntp access-group {query-only | serve-only |
serve | peer} standard_ACL_#
Table 18-4 explains the different control options. When matched with a permit or deny statement in the specified standard ACL, only those communication processes are allowed or prohibited. If you have more than one ntp access-group statement defined, the first statement that matches in the first ntp access-group statement is used.
Authentication
NTP supports authentication, which is used to validate NTP messages received from another NTP device. This authentication is similar to that used by routing protocols, such as OSPF and EIGRP, and PPP’s CHAP. MD5 is used to create a cryptographic checksum, which is attached to the NTP message. A key, known to both sides, is used to create the authentication checksum. When enabled, if the checksum cannot be verified, the NTP message is ignored. One advantage that authentication has over access group control is that access group control is susceptible to IP spoofing attacks. Authentication does not rely on the IP address for authentication—instead, a shared secret key is used.
Note
Because NTP authentication can be CPU intensive, depending on the router model, this might add a slight slew (where the router’s time and the NTP server’s time is slightly off) in your router’s time value. The slower the router’s processor is, the higher the slew value is. If timing is critical, you might want to forego authentication for smaller-end routers and use only access groups.
You need to configure three commands to set up authentication:
Router(config)# ntp authenticate
Router(config)# ntp authentication-key key_# md5 key_value
Router(config)# ntp trusted-key key_#
The ntp authenticate command enables NTP authentication. The ntp authentication-key command defines a reference number for the key (key_#) as well as the authentication key (the same key_value must be configured on the remote NTP device). Finally, the ntp trusted-key command specifies which NTP devices should be trusted with authentication, which prevents an accidental synchronization to a system that is not trusted. Notice that a reference number is used. This reference number must match the one used in the ntp authentication-key command. By using a key number, you can create multiple keys; this means that you can update keys more easily and can have different keys for different peers.
After you have defined authentication, you need to reference the key number in the ntp {server | peer} command, which tells the router which key to use when sending messages to specific peers.
Other NTP Commands
This last section on NTP configuration covers three miscellaneous commands. Earlier, I discussed how to specify the source IP address to be used in communications with other NTP devices (using the ntp {server | peer} command). However, you globally can specify the source IP address to use with the following NTP command:
Router(config)# ntp source interface
If you configure the interface in the ntp {server | peer} command, this configuration overrides the global configuration.
For routers that have a hardware clock, you can have the router update the hardware clock from the software clock; however, this is advisable only if the software clock is updated from a reliable NTP source. This is sometimes necessary because the hardware clock can drift slightly over time. To update the hardware clock from the software clock when using NTP, use the following command:
Router(config)# ntp update-calendar
Chapter 4, “Disabling Unnecessary Services,” discussed disabling unnecessary services. With NTP, you can enable or disable it on an interface-by-interface basis. To prevent NTP attacks, disable NTP on interfaces that you will not be using to obtain time. For example, if you have a three-interface router—inside, outside, and DMZ—and your NTP server is off the inside interface, I highly recommend that you disable NTP on the other two interfaces. To disable NTP on an interface, use the following configuration:
Router(config)# interface type [slot_#/]port_#
Router(config-if)# ntp disable
NTP Verification
After you have configured NTP on your router, you can use various show commands to examine your configuration and troubleshoot problems. To see the current time on the router’s software clock, use the show clock command; to see the time of the hardware clock, use show calendar.
NTP Commands
You use two basic commands to examine NTP information:
• show ntp associations
• show ntp status
The first command displays associations with other NTP devices. Example 18-12 displays sample output from the show ntp associations command.
Example 18-12 Using the show ntp associations Command
Router> show ntp associations
address ref clock st when poll reach delay offset disp
*~192.1.2.11 192.1.2.11 2 31 1024 377 4.1 -8.38 1.5
* master (synced), # master (unsynced), + selected, - candidate,
~ configured
In Example 18-12, the first set of leading characters displays synchronization information:
* This router is synchronized to this peer.
# This router is almost synchronized to this peer.
+ The peer has been selected for possible synchronization.
- The peer is a candidate for synchronization.
~ The peer has been statically configured.
The address column lists the addresses of the NTP peer devices. The ref clock column lists the addresses for where peers in the address column are getting their time. The st column indicates the stratum level of the peer. The when column indicates the time since the last NTP message was received from this peer. The poll column indicates the polling interval, in seconds, that this router is using to contact the specified peer. The reach column indicates the peer’s reachability, in octal. The delay column displays the roundtrip delay, in milliseconds, to the peer. The offset column displays the relative time of the peer’s clock to the local router’s clock, in milliseconds.
The show ntp status command displays the status of NTP on the router. Example 18-13 shows sample output of the show ntp status command.
Example 18-13 Using the show ntp status Command
Router# show ntp status
Clock is synchronized, stratum 2, reference is 192.1.2.11
nominal freq is 250.0000 Hz, actual freq is 249.9990 Hz, precision is 2**19
reference time is AFE2525E.70597C87 (00:10:39.511 EDT Thu Jan 1 2004)
clock offset is 6.21 msec, root delay is 83.98 msec
root dispersion is 81.96 msec, peer dispersion is 2.02 msec
In Example 18-13, the router is synchronized with the NTP server at 192.1.2.11, which provides a stratum level 2 service.
Note
I want to point out that NTP updates to time on a device such as a router are done in small incremental changes. Therefore, when you first boot up your router, it might take a while before the router’s software clock completely is synchronized with the NTP server. You will see this from the output of the show ntp status command. One way to speed up the synchronization is to configure the software clock on the router manually to be close to the time that the NTP server is advertising. I highly recommend this approach if your router has a dead battery for its hardware clock and you need to reboot it: After it has rebooted, manually set the time on the router to speed up the synchronization.
SNTP Command
Only one command is used to verify the configuration and operation of SNTP: show sntp. Example 18-14 shows sample output.
Router# show sntp
SNTP server Stratum Version Last Receive
192.1.2.11 2 3 00:00:34 Synced Bcast
Broadcast client mode is enabled.
In Example 18-14, one NTPv3 server, 192.1.2.11, provides a stratum level 2 service to this router. This router is learning about the time from this server through local broadcasts.
NTP Configuration Example
Now that you have a basic understanding of NTP and its configuration, take a look at a simple example in which a perimeter router at a corporate network needs to synchronize its time to an internal NTP server. Figure 18-1 is used to illustrate this example. Example 18-15 shows the router’s configuration.
Example 18-15 Configuring NTP on Your Router, Acting as a Client
Router(config)# ntp server 192.1.2.11 key 99 source ethernet0
Router(config)# ntp authenticate
Router(config)# ntp authentication-key 99 md5 55ab8971F
Router(config)# ntp trusted-key 99
Router(config)# ntp update-calendar
Router(config)# access-list 1 permit 192.1.2.11 0.0.0.0
Router(config)# ntp access-group peer 1
Router(config)# interface ethernet1
Router(config-if)# ntp disable
Router(config)# interface ethernet2
Router(config-if)# ntp disable
In this example, the NTP server is 192.1.2.11, which is specified in the first command. The next three commands set up authentication and refer back to the first command with the key reference number of 99. Notice that the hash key is 55ab891F, which also must be configured on the NTP server. This router has a hardware clock, so the ntp update-calendar command updates the hardware clock from the software clock. The access-list and ntp access-group commands restrict NTP interaction with only 192.1.2.11. Finally, NTP is disabled on the outside and DMZ interfaces. As you can see, setting up NTP is straightforward.
Embedded Syslog Manager
The Embedded Syslog Manager (ESM), new in Cisco IOS 12.3(2)T, enables you to filter, change the severity level of, route, and customize logging messages on your router. ESM allows logging messages to be logged independently as standard messages, messages formatted using XML, and ESM filtered messages. These messages then can be forwarded to the standard logging destinations: console, internal buffer, and syslog server. By using a separate logging process, ESM ensures that if there is a problem with the ESM filtering modules, the standard logging process will be unaffected.
ESM Overview
As I mentioned in the introduction, ESM is an enhancement, not a replacement, to the existing logging mechanism, including syslog. Both simultaneously can be running on your router. ESM, however, provides enhanced services above and beyond the normal syslog functions of a router.
ESM gives you complete control over the logging process on the router. Before this feature was introduced, if you wanted to perform extra processing on logging events, such as filtering, or have the router take an action for a specific event, you had to write your own scripts and run them against syslog files on a syslog server. With ESM, you can do these tasks on the router itself. Here are some benefits that ESM provides you:
• You can limit the number of syslog messages to prevent a flood of messages in a time of duress or attack.
• You can customize processing of logging messages, such as forwarding specific messages to specific syslog servers.
• You can send e-mail notifications based on a specific log message or message type being generated.
• You can change the security levels for logging messages instead of using the ones that Cisco assigns to the messages.
To perform these functions, ESM uses filter modules, which are scripts written in the Tcl language. Cisco has some predefined scripts that you can use, but you easily can modify these or create your own (assuming that you know Tcl). These scripts can be stored locally on the router, such as in Flash, or on a remote server. The scripts can be stored in plain text or can be precompiled; the latter increases your security because they cannot be edited directly (you can use the tool TclPro to precompile scripts, but other tools are available).
ESM requires Tcl 8.3.4 support, which is available only in Cisco IOS 12.3(2)T and later. Because only Tcl is supported for scripting, you must be proficient in using the Tcl coding language to create your own custom scripts. One limitation with ESM is that it cannot be applied to SNMP logging, such as log messages related to the snmp-server enable traps syslog and logging history commands.
ESM Filter Modules
Before you can use ESM, you must either create or obtain filtering modules. When you enable ESM, all logging messages first are processed through the referenced ESM filter modules. You can have the router use multiple filter modules, where the modules are processed by the position tag associated with the logging filter command. This enables you to enter your logging filter commands in any order, but it has the Cisco IOS process them based on the position tag values. When multiple modules are referenced, the output of the first filter module is passed as the input to the second module. If you had a third module, the output of the second module would be passed to the third one.
One component always passed from filter module to filter module is the original logging message. When all filter modules have been processed, the original logging message can be directed to one of three locations: standard, XML, or ESM. With the router’s standard logging process, the logging message is directed to the normal destinations: console, buffered, or syslog.
Input Process
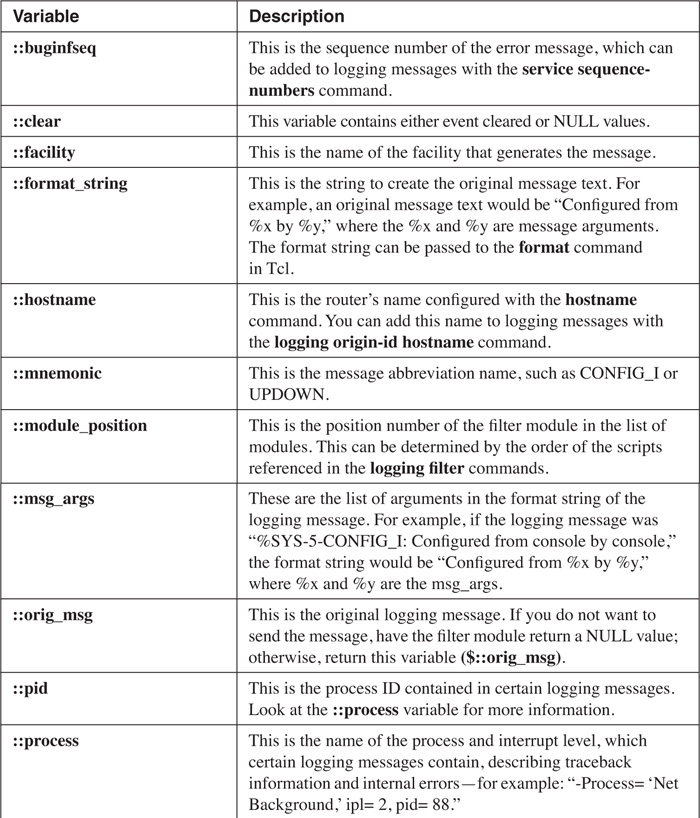
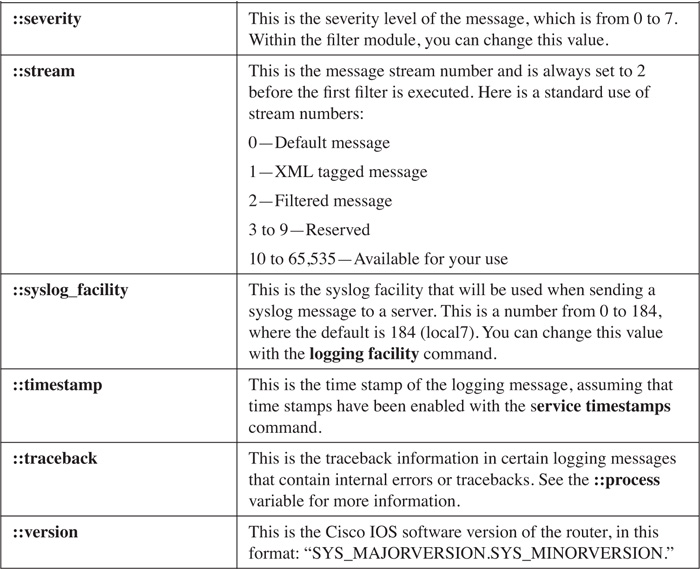
Normally, a logging message contains the following variables: facility, severity level, mnemonic, message text, and, optionally, a sequence number and time stamp. However, ESM, preappends a syslog count number to each message. The logging message itself is passed as a Tcl global namespace variable to the filter module. Each component in a logging message is a Tcl global variable, and each of these is prefixed with a double colon (::) when referencing them in the script module. Table 18-5 lists the valid variables that you have access to within a filter module.
Filtering Process
After you have set up ESM, each time the router generates a logging message, the filter modules are processed in the order in which they are referenced, (that is, configured). As each module is processed, it passes its output as input to the next module. Because the Tcl variables in Table 18-5 are global namespace variables, each of these can be changed within your filters and can be used by other filters.
return Statement
Two Tcl global variables automatically are updated by ESM based on the execution of filtering modules: ::orig_msg and ::cli_args (the latter is the arguments passed into the filter module). The ::origin_msg value is set automatically to the return value of the filter module. This is done with the return command. For example, if you had a one-line filter module and wanted to pass a value of “This is my new value” to the next filter module, your return statement in your first filter module would look like this:
return "This is my new value"
With this example, the filter module ignores any parameters passed to it and passes the previous text string to the next filter module in the chain.
Here are some other return statement examples. With this return statement, all syslog messages are blocked to the ESM stream process:
return ""
This example sends the value in ::orig_msg to the next module:
return $::orig_msg
Cisco IOS Commands
You can add Cisco IOS commands to your filter modules by using the Tcl config and exec commands. For example, assume that you want to add the inbound ACL applied to an interface to your logging message. Assume that the ACL is the one applied to ethernet1, which is also the source address for logging statements to a syslog server. This could be done with the following:
set acl_info [exec show ip interface e1 | inc Outbound access list]
puts $acl_info
" Outgoing access list is not set"
In this example, the last line is the output passed to the syslog message.
Note
More information on TCL scripting can be found on the Cisco website in the “Cisco IOS Scripting with Tcl” guide. Just do a search for this string.
Example Filter Modules
Cisco provides some sample Tcl scripts on its website for ESM filter modules; however, Cisco does not support all of these scripts. The phrase “buyer beware” applies. Some of the example scripts include the following:
• Escalating the severity level of a message
• Counting messages
• Creating XML tags
• Associating logging messages to a stream ID
• Sending an e-mail alert
As I mentioned at the beginning of this section on ESM, this chapter does not provide an in-depth study of the configuration of Tcl scripts. To give you a flavor of scripting, however, I look at two scripts included on the Cisco website: email.txt and email_guts.txt.
The email.txt script creates an e-mail message with the logging message. Here are the guts of this script:
# Usage: Provide email address as CLI argument. Set email server IP in
# email_guts.tcl
# Namespace: email
if { [info exists email::init] == 0 } {
source flash:/email_guts.tcl
}
# Check for null message
if { [string length $::orig_msg] == 0} {
return ""
}
if { [info exists ::msg_args] } {
if { [string compare -nocase CONFIG_I $::mnemonic ] == 0 } {
email::sendmessage $::cli_args $::mnemonic
[string trim $::orig_msg]
}
}
return $::orig_msg
One argument that you must pass to this script is the e-mail address where you want e-mail messages sent.
The email_guts.txt script specifies the e-mail server’s IP address, as well as the from and friendly strings:
# Usage: Set email host IP, from, and friendly strings below.
#
namespace eval email {
set sendmail(smtphost) 192.1.1.2
set sendmail(from) $::hostname
set sendmail(friendly) $::hostname
proc sendmessage {toList subject body} {
variable sendmail
set smtphost $sendmail(smtphost)
set from $sendmail(from)
set friendly $sendmail(friendly)
set sockid [socket $smtphost 25]
## DEBUG
set status [catch {
puts $sockid "HELO $smtphost"
flush $sockid
set result [gets $sockid]
puts $sockid "MAIL From:<$from>"
flush $sockid
set result [gets $sockid]
foreach to $toList {
puts $sockid "RCPT To:<$to>"
flush $sockid
}
set result [gets $sockid]
puts $sockid "DATA "
flush $sockid
set result [gets $sockid]
puts $sockid "From: $friendly <$from>"
foreach to $toList {
puts $sockid "To:<$to>"
}
puts $sockid "Subject: $subject"
puts $sockid "
"
foreach line [split $body "
"] {
puts $sockid " $line"
}
puts $sockid "."
puts $sockid "QUIT"
flush $sockid
set result [gets $sockid]
} result]
catch {close $sockid }
if {$status} then {
return -code error $result
}
}
} ;# end namespace email
set email::init 1
Introduction to ESM Setup and Configuration
After you have created your filter modules for ESM, put them in a place where the router can locate them through a URL-style syntax. I recommend that you put the Tcl scripts (filter modules) in the router’s Flash. When this is done, you need to perform the following steps:
Step 1 Reference each filter module with a separate logging filter command.
Step 2 Use the logging {console | buffered | monitor | host} filtered command to use your ESM filter modules. Optionally, configure other logging commands, such as logging source-interface and logging origin-id.
Step 3 Verify your configuration with the show logging command.
The following sections cover the configuration in more depth.
Specifying Filter Modules
The first thing that you must do is reference your filter modules. This is done using the logging filter command:
Router(config)# logging filter filter_url [position_#]
[args filter_arguments]
The filter_url parameter specifies the location of the filter module. If the module is stored locally in the router’s Flash, use flash: or slot0: as the source. If it is stored remotely, use either ftp:, rcp:, or tftp:. For a remote location, the filter URL should also contain the IP address of the module, as well as the directory in which the module is located. For locally and remotely stored modules, you need to specify the name of the module. The extension of these scripts is either .txt for a plain, noncompiled Tcl script or .tcl for a precompiled Tcl script.
Following the URL specification is the position number of the filter module during the filtering process. If you omit the position number, the router processes filter modules in the order in which you configure them. For each filter module that you have, you need a separate logging filter command. Finally, the optional args parameter specifies any arguments that you want to pass to the filter (in the filter, you need to reference these arguments if you want to use them). For example, you could pass an e-mail address to a script by using this syntax: args [email protected]. If you have multiple arguments, separate the arguments by a space. Note that if the script is set up to accept an argument already, you do not need to preface the argument with the args parameter.
Here is a simple example of referencing a compiled script stored in the router’s Flash:
Router(config)# logging filter flash:/email.tcl [email protected]
Using Filter Modules
Next, you must tell your router to use the filter modules that you specified with the logging filter command. This is done using the following commands:
Router(config)# logging [console | buffered | monitor] filtered
[severity_level]
Router(config)# logging host {IP_address | hostname} filtered
[stream stream_ID]
In the first logging command, the optional severity_level parameter specifies that logging messages at that severity level or higher (lower number) will be processed by the filter modules. Note that the severity level specified in the logging console, logging buffered, and logging monitored commands takes precedence over the severity level specified in this command.
In the second command, the optional stream parameter can be used to direct logging messages to a specific syslog host. As an example, you could specify that all severity level 5 messages should have a stream ID of 7 associated with them; then, with the stream parameter, you could have the appropriate logging host command process these logging messages.
Example 18-16 shows a simple example that e-mails a message for any messages logged to the console with a severity level of 0 to 3.
Example 18-16 Sending an E-mail Message Based on Logging Severity Levels
Router(config)# logging filter slot0:/email.tcl [email protected]
Router(config)# logging filter slot0:/email_guts.tcl
Router(config)# logging console filtered 3
Verifying Your ESM Configuration
After you have configured your ESM filters, you can use the show logging command to verify your configuration. Example 18-17 shows a sample output of this command based on Example 18-16.
Example 18-17 Using the show logging Command to Verify Your ESM Configuration
Router# show logging
Syslog logging: enabled(0 messages dropped, 12 messages rate-limited,
0 flushes, 0 overruns, xml disabled, filtering enabled)
Console logging: level debugging, 32 messages logged, xml disabled,
filtering enabled
Monitor logging: level warnings , 0 messages logged, xml disabled,
filtering disabled
Buffer logging: level debugging, 839 messages logged, xml disabled,
filtering disabled
Logging Exception size (8192 bytes)
Count and timestamp logging messages: disabled
Filter modules:
slot0:/email.tcl [email protected]
slot0:/email_guts.tcl
Log Buffer (8192 bytes):
*Jan 5 12:49:02.513: %SYS-5-CONFIG_I: Configured from console
by console
<--output omitted-->
Additional Logging Information
Now that you have logging set up, your most difficult task is to make sense of logging information found in your logging messages. I discussed some of this in the previous chapter related to DoS attacks. In this chapter, I give only an overview of what you should look for in your log files, as well as additional tools that you can use to make this process easier.
What to Look For
At a base level, every day you should look at the following items concerning your log files:
• How many total messages were recorded in yesterday’s log file?
Is this more or less than the day before? You should have a baseline developed that shows, on average, the number of entries per day or based on the day of week. If there is a huge discrepancy, scrutinize the logging process and the log file to look for any problems or issues.
• How many messages did you have for each severity level in yesterday’s log file?
Again, you should have a baseline for this information and should examine any major discrepancies.
• Are you seeing any new types of messages in your log files that you rarely see?
If so, again, you should scrutinize these log messages.
• If you are logging ACL entries, what are the top 10 denied IP addresses?
Look at not only the top 10 denied IP addresses, but also the network numbers that these are from. If there is a pattern here, you might want to block the entire network in question.
• If you are logging ACL entries, is there a major increase on the number of matches of a particular permit or deny statement?
If so, this might indicate that a security weakness was found in an application or operating system, or a new worm is attacking your network. If you see a major increase in the number of matches of a particular ACL statement, definitely investigate this discrepancy and take the appropriate action.
Tip
Also examine CPU utilization and memory use on your router, as discussed in the previous chapter.
Additional Tools
Many additional tools are available to help you with your logging process. I briefly focus on three third-party tools that you can use to help you with your logging and syslog process. Many are available, and you can easily create your own tools to examine your log files with scripting tools such as Tcl, Perl, and others.
Rotating Syslog Log Files
Every day (or more often, if necessary) you should rotate the syslog server’s log files. Then periodically, you should archive old syslog files. A syslog file that is being rotated out should have the date in its name, as well as a descriptive term. For example, if you have separate log files for three perimeter routers, I would use the following syntax for the rotated filenames: router_name.date.log (or something similar).
One package that I have used is logrot. It does what its name implies: It rotates log files. Logrot was built to work with CiscoWorks log files on Sun Solaris and Windows systems. You can find information for logrot at http://sourceforge.net/project/showfiles.php?group_id=25401&package_id=79001. Of course, you easily can create your own script to perform log rotation; I have done this many times using simple shell script commands.
However, no matter what product you use, you need to automate the rotation process. On UNIX systems, you can do this by using the kron process. On a Windows 2000 system, you can use the Scheduled Tasks tool. To do this, go to Start, > Programs, > Accessories, > System Tools, > Scheduled Tasks; then double-click the Add Schedule Task icon. This brings up the Schedule Task wizard, where you easily can point to your log file rotation program and schedule how often it should run.
Examining Log File Contents
You can use a variety of programs to examine and monitor the contents of your syslog server’s log files. The following sections cover some of the commonly used ones.
cislog
One simple log file report program that I have used is cislog, which is useful for monitoring syslog files for Cisco products. It is actually a set of Perl scripts that can monitor the following information:
• acl-report.pl—This Perl script summarizes the deny messages based on top source IP addresses, the most active destination ports, and the most active protocol types.
• dial-report.pl—This Perl script lists the users and their addresses, as well as when they dialed into the router.
• router-report.pl—This Perl script summarizes the log messages created by Cisco routers and produces information such as a summary of the top log message types, successful Telnet attempts, and which sources entered configuration mode.
• switch-report.pl—This Perl script performs the same function as the router-report.pl, but for Catalyst switches.
The great thing about these tools is that they are written in Perl. If you are proficient in programming in Perl, you can use these scripts as a starting point and can add enhancements to them to meet your specific needs. cislog can be found at http://sourceforge.net/project/showfiles.php?group_id=25401&package_id=34535.
swatch
Another popular log file–processing utility is swatch, which standards for Simple WATCHer. This software can be found at http://swatch.sourceforge.net/. One advantage that swatch has over other log file checkers is that it actively scans your log files for new messages and then takes an action based on the message that was newly recorded. Its one main downside is that it runs only on Linux/UNIX platforms; Windows currently is not supported. I have used swatch quite often because of its ease in customization to look for specific things and then take appropriate actions on these matches.
fwlogwatch
A third popular tool is fwlogwatch, which runs on many Linux/UNIX platforms as well as Windows (through Cygwin). fwlogwatch can detect and process log entries from multiple platforms, including Linux ipchains, netfilter, and iptables; Solaris/BSD/Irix/HP-UX ipfilter; Cisco IOS and PIX logs; NetScreen Windows XP firewall; Elsa Lancom’s router; and Snort IDS. All of these log entries can be in the same file, and the log file can be compressed using gzip. Other features include these:
• Resolves for protocols, services, and host names
• Lookups against the whois database for easy access to contact information of administrators of remote networks
• Inclusion or exclusion of hosts, ports, chains, and targets
• Support for multiple languages
• Intelligent search capabilities based on log field columns
• Generation of output in plain text and HTML, as well as the capability to send reports by e-mail
• Real-time processing of log files, including instant notifications by e-mail, winpopup, or any other method that you can configure through a shell script
• Support for antispoofing and IPv6
For more information on fwlogwatch, visit http://cert.uni-stuttgart.de/projects/fwlogwatch/.
Summary
This chapter showed you the basics of logging on your Cisco perimeter router. Without logging, it becomes almost impossible to determine whether your network or router is under attack. Setting up logging with the logging commands is a simple and straight-forward process, even with the configuration of extra features such as NTP and ESM.
Next up is Part VIII, “Virtual Private Networks,” which shows you how to establish secure connections between your perimeter routers across a public network.