CHAPTER |
|
12 |
Adding GIS Features to Mapping Applications |
Now that you know how to annotate a map with lines and shapes and you have seen the basics of interactive drawing on a Google map, you’re ready to develop a custom map-enabled application with GIS (Geographical Information Systems) features. GIS are some of the most complicated software packages, and they incorporate an endless list of features. According to Wikipedia, a geographic information system is a system designed to capture, store, manipulate, analyze, manage, and present all types of geographical data. Systems that support all these features are very, very costly. They also come in modules because most companies are interested in specific sets of features, not all of them. The modules themselves are expensive, but they also require backend support, large databases, conversion programs, and a whole lot of parameterization.
In this chapter, you’ll only scratch the surface of applications that incorporate GIS features; the applications you will build in this chapter could be considered simply as drawing applications on top of a map. You have seen all the pieces of building a map-enabled application with GIS features. You know how to mark the features of interest on the map with markers and shapes, how to display data about the selected features in data windows, and how to annotate the map with labels. Now you’re ready to build custom applications that incorporate the features you’re interested in. For example, you can combine mapping components with reporting tools to produce reports with spatial data. Practical data have an inherent spatial component, even if this component is an address or a larger area on the map, and you can add value to any application by incorporating GIS features to it.
The Simple GIS Application
The application you build in this chapter is called Simple GIS, and there are two versions of it: the
Simple GIS.html web page (shown in Figure 12-1) and the Simple GIS desktop application (shown in Figure 12-2) developed with Visual Studio (you will find a VB and a C# version of the desktop application in the chapter’s support material). Both applications use similar interfaces, and they’re both based on the same script (well, not exactly the same—there are a few minor differences). The script that’s used with the desktop application, for example, fires events in the external application with the document.external statement, which has no place in the context of a stand-alone web application. There are a few more minor differences, but the two scripts are very similar and you’ll be able to leverage your understanding of the Google Maps API to both Windows and web applications.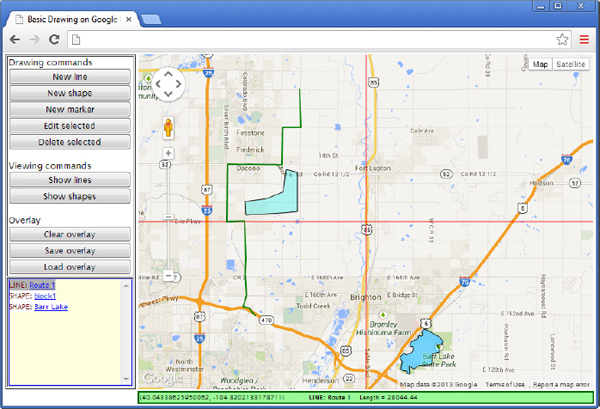
Figure 12-1 The Simple GIS web page allows users to draw shapes on the map.
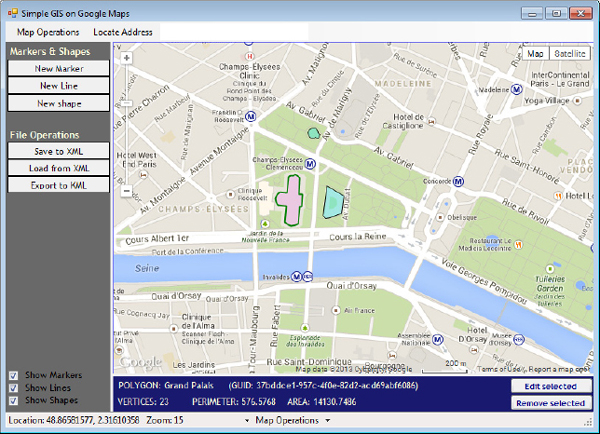
Figure 12-2 The Simple GIS application is a .NET application with the same functionality as the Simple GIS web page, but unlike its web counterpart, it deploys a rich Windows interface
This chapter doesn’t introduce any new topics. Instead, it combines many of the topics covered in preceding chapters to demonstrate how they work together and how you can apply the knowledge you have acquired so far to build a practical application. The code is well documented and the best way to understand it is to dive in, explore it, and add new features. I discuss the most important parts of the code in this chapter, but skip the trivial operations. The sample applications of this chapter are quite lengthy, because they include a number of practical features and can become your starting point for specialized applications that address your specific requirements.
The Basic Features of the Application
Both applications allow users to annotate the map with markers, lines, and polygons. Users can literally draw on the map with the mouse and all entities they place on the map are editable. They can select an item by clicking on it and then edit it, or remove it from the map. Because it’s difficult to locate a shape on a map with many items, an alternate selection technique was implemented. Users can locate an item by clicking its name in a list that contains all the items placed on the map—as long as the items have meaningful names, of course. The web version of the application displays the names of these items in a list displayed in the lower left pane, below the command buttons. Users can click the hyperlink with the shape’s name in the list to select the item on the map.
The Windows version of the application uses a different selection mechanism. One of the map’s context menu commands is the Show Items command, which displays an auxiliary window with the names of the items drawn on the map, and users can select one by clicking the appropriate entry on this form. The auxiliary form, along with the application’s context menu, is shown in Figure 12-3. The selected item is drawn with a different fill color and the map’s viewport changes so that the selected shape fits comfortably in it.
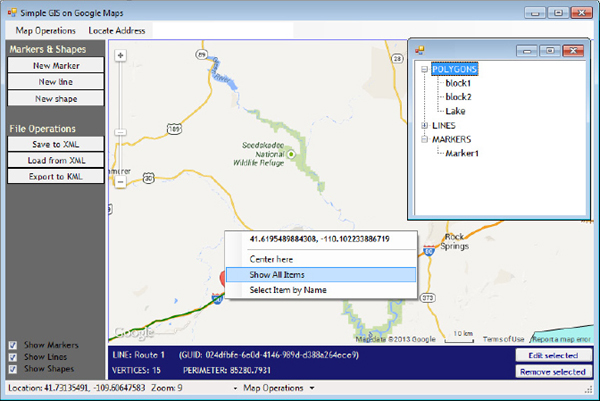
Figure 12-3 The desktop version of the Simple GIS application provides a context menu and one of the menu’s commands leads to an auxiliary window with all the items on the map.
The desktop application’s interface is a bit more elaborate, as the items on the auxiliary window are placed in a tree structure and users can expand/collapse individual branches of the tree. When the item is selected on the map, the list is updated to highlight the selected item. Likewise, when an item is clicked in the list, the corresponding item on the map is selected.
Drawing the Crosshair Cursor
To help users identify locations accurately, the application displays a crosshair cursor at the middle of the map. Users can drag the map until the location of interest is right in the middle of the map. The web page draws the crosshair cursor at all times. The desktop version of the application allows users to turn the crosshair on and off either with a menu command (Maps Operations | Show Crosshair) or with the same command in the status bar, as shown in Figure 12-2. The drawing of the crosshair cursor takes place in the script for both applications and it involves a few script variables and a function. The script variables are as follows:
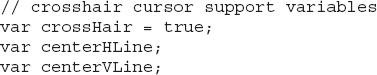
The first variable determines whether the crosshair cursor will be drawn or not. The other two variables represent the two perpendicular lines that form the cursor. The function that draws the crosshair cursor in the middle of the map is the
drawCrosshair() function, shown in Listing 12-1.Listing 12-1 The
draw Crosshair() function
The code that displays the two perpendicular lines on the map is shown here for your convenience, since it has been discussed in earlier chapters. The
drawCrosshair() function is associated with the map’s bounds_changed event; every time the user drags the map, the cursor is redrawn. In the web version of the application, the crossHair variable is always true, and in the desktop version of the application, the same variable is controlled by the host application through the two functions:
Drawing a Path on the Map
The drawing of both lines and shapes is handled in the same manner: Both entities are based on a path, which is a collection of
LatLng objects. The collection is an MVCArray object declared at the script level. Every time the user starts drawing a new line or a new polygon, the path variable is initialized to an empty MVCArray object with the following statement:The process of drawing a new shape was described in detail in Chapter 9 and is repeated here briefly.
When users click on the map, a new vertex is added to the path. For this action, you must program the map’s
click event and react to it only if the user is actually drawing a new shape. To edit an existing vertex, users can simply drag the marker that identifies the vertex with the mouse. For this action, you must program the marker’s drag event. Users can also insert new vertices and remove existing ones. The insertion of a new vertex takes place from within the click event of the markers that identify the vertices. When a marker is clicked, a new vertex is inserted halfway between the one that was clicked and the preceding one. The removal of a vertex is similar and it takes place from within the rightclick event of the marker that identifies the vertex. Let’s see the code that implements these operations.Start by adding a listener to the map’s
click event:The
addPoint() function handles the map’s click event and performs more actions than simply adding new vertices to the current path. For example, it clears the current selection if the user isn’t editing a shape at the time. To distinguish between the operations, the script makes use of the variables drawingShape/editingShape and drawingLine/editingLine. Listing 12-2 shows the addPoint() function.Listing 12-2 The
addPoint() function
At the beginning, the code examines the current operation. If the user has clicked the map while editing a line or a shape, the function ends the current edit operation and terminates. There’s no return statement, but the following
if statements exclude any other action after ending an edit operation.If the user is in the process of creating a new path, the script adds the coordinates of the location that was clicked to the
path collection, which is an MVCArray object and it holds the path of the current line or shape. As soon as the new vertex is added to the path collection, the corresponding line or shape on the map is updated. Then it creates a new marker, the shapeMarker object, places it on the map and adds it to the shapeMarkers array. Note the statements that associate the click, rightclick, and dragend events of the newly created marker with the appropriate listeners. Two of these listeners are implemented with simple inline functions. The rightclick listener finds the marker that was clicked and removes it from the markers array, and its coordinates from the path array. The dragend event listener also finds out the marker that was clicked in the same array and updates its position property. You can also use the drag event for this action, in which case the shape will be updated as the user drags the marker. For very long paths, the drag event is not the best choice because it may take more than a few moments to locate the selected vertex.The marker’s
click event is associated with the insertPoint() function, which is substantially more complex. This function finds out the index of the marker that was clicked, which is the same as the index of the corresponding vertex in the path, and then calculates the coordinates of the point that lies halfway between the marker that was clicked and the preceding one. This point lies on the line segment that connects the two points: This is where the new vertex, along with its marker, will be placed. Each marker added to the path with the insertPoint() function is also associated with three listeners for the click, rightclick, and dragend events. Listing 12-3 shows the implementation of the insertPoint() function of the script.Listing 12-3 The
insertPoint() function

Editing Paths
Users can also edit existing shapes. To edit a shape, users must first select it with the mouse and then click the Edit Selected button. When this button is clicked, the
editSelected() function is executed. This function makes sure that no other edit operation is currently in progress. If so, it displays a message in an alert box and returns. Next, it locates the selected shape from the value of the selectedGUID variable. This variable holds the ID of the selected shape and is also the key to the corresponding associative array with the markers that identify the shape’s vertices. Depending on the type of the selected item, the function calls one of the editPolyline(), editPolygon(), or editMarker() functions, passing as an argument the selected item’s GUID. Listing 12-4 shows the editSelectedShape() function:Listing 12-4 The
edit Selected Shape() function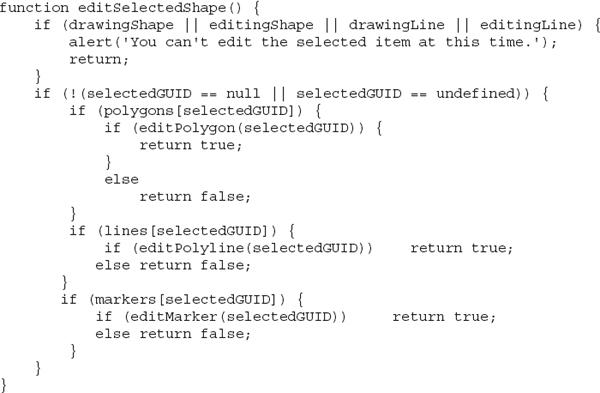
If the GUID is an existing key in the
polygons array, the function calls the editPolygon() function, which initiates the edit operation for the selected polygon. To prepare the polygon for editing, the editPolygon() function, shown in Listing 12-5, creates an array of markers, one for each vertex of the polygon’s path. Then, it associates a listener with their click, rightclick, and drag events. They’re the same event listeners used by the insertPoint() function because the vertices are manipulated in the same manner. Users can edit the polygon’s path when they create it, as well as when they edit it. The actual code for the three event listeners is not shown in the listing as it’s exactly the same as in Listing 12-3 (you will find placeholders in Listing 12-5 where the code of the event listeners should appear).Listing 12-5 The
editPolygon() function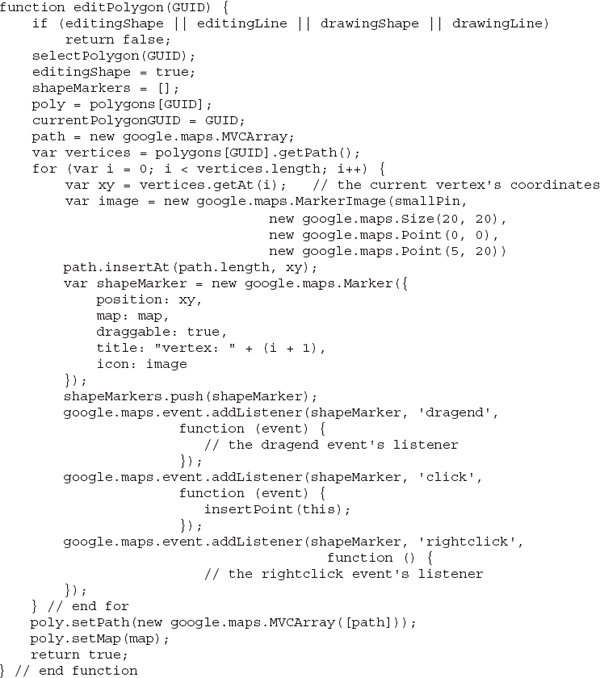
This function starts by selecting the polygon to be edited, just in case, and then creates a new path with the vertices of the polygon being edited. For each vertex, it creates a marker and places it on the map. These markers identify the vertices of the path, which are draggable so that users can reposition them to modify the shape’s path. Moreover, two listeners for their
click and rightclick events are added.These two actions correspond to the insertion of a new vertex and the removal of an existing vertex, similar to the listeners you added to the new markers while the shape was being drawn. In effect, this function re-generates the path that describes the shape, places markers at the shape’s vertices, and attaches the same events as the function that draws a new shape. Its job is to leave the shape in the same state as it was before the last edit operation was completed.
Handling the Markers
The part of the application that handles the markers is also simple. The marker data is displayed on a
<div> element, the MarkerData element, which contains the various input boxes arranged on a table. The MarkerData element is usually hidden and it’s displayed when the user chooses to add a new marker, or edit an existing one. When the New Marker button is clicked, the script calls the newMarker() function, which clears the fields on the dialog box, as shown in Figure 12-4, and makes the MarkerData element visible.
Figure 12-4 Editing a marker’s data in a modal dialog box
After supplying the appropriate values on the dialog box’s fields, users can click OK to invoke the
addMarker() function, which creates a new Marker object based on the supplied values and places it on the map. The addMarker() function handles both the insertion of a new marker as well as the update of an existing marker after an edit operation.The implementation of the
addMarker() function is rather lengthy, so let’s run through its operations quickly. Listing 12-6 shows the code that implements the function.Listing 12-6 The
addMarker() function adds a new marker on the map, or updates the attributes of an existing one after an edit operation.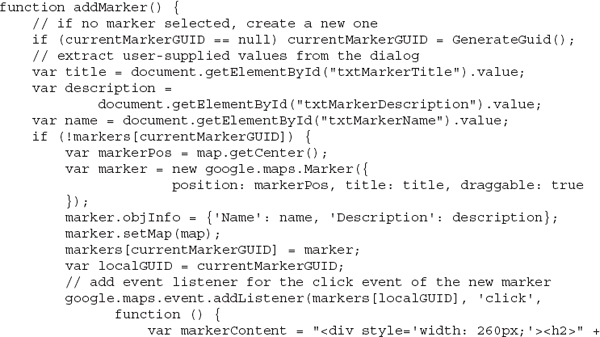
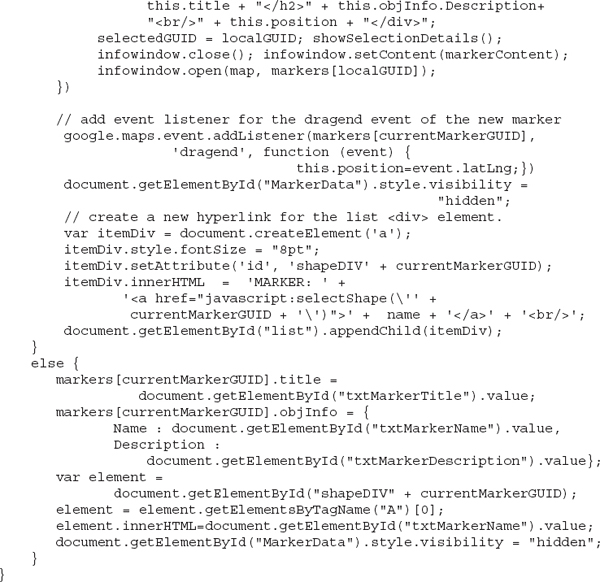
The script starts by creating a new marker with the user-supplied data (the marker’s title and description, which should appear on an
InfoWindow object when the user clicks the marker). The data are read from the MarkerData element’s fields and the new marker is represented by the marker variable. This variable is then stored in the markers collection and also placed on the map. Then, the script creates the hyperlink that corresponds to the new marker and adds it to the list of items in the lower-left pane. The process, which is the same for all items, is described in the following section. Finally, the script adds three listeners for the following events of the newly created marker:•
click event This listener displays the marker’s description in an info window.•
dragend event The markers are draggable and users can relocate them at will. When a marker is dragged to a new location, the dragend event’s listener updates the position of the marker in the markers array.The last few statements print the selected marker’s name in the status bar.
Updating the List of Shapes
Another interesting aspect of the application is the insertion of the hyperlink that identifies the current shape in the lower-left pane. This pane maintains a list of all items currently on the map. Each item is identified by its type and its name. The item’s type is identified by one of the strings “Marker,” “Line,” and “Shape.” The item’s name is formatted as a hyperlink, and you can click this hyperlink to select and bring into view the corresponding item on the map. Whether the user selects an item by clicking it on the map or by clicking its matching hyperlink in the pane with the item names, the script calls one of the
selectPolygon(), selectPolyline(), or selectMarker() functions. All three functions are similar: They unselect the currently selected shape to ensure that there will never be two selected items on the map; then, they redraw the selected items in a different color so that they stand out; and finally, they call another function to display the attributes of the selected items in the status bar below the map.Let’s start with the statements that create the
<a> element with the selected item’s hyperlink and add it to the list:
The
itemDiv variable represents an <a> element and it's created on the fly. This element has a unique name that contains the selected item’s GUID. The hyperlink’s destination is the selectShape() function. Finally, the element is added to the list element of the page.The
polygonSelected() and lineSelected() functions call the showSelectionDetails() function to display the attributes of the selected item in the status bar. The same function is also called when the user unselects any item on the map, and also when they remove an item. When the showSelectionDetails() function is called with a null argument, it simply clears the section of the status bar where the item details are shown. Otherwise, it prints the selected item’s name and its basic properties: a line’s length, a shape’s perimeter and area, and a marker’s title.The
showSelectionDetails() function handles each item differently because lines don’t have areas and markers have a name and a title only. The description of the selected item is printed in the application's status bar (a stripe below the map). The implementation of the function is rather trivial, and you can look it up in the sample HTML file.The Desktop Version of Simple GIS
Now let’s switch our attention to the desktop version of the application, which is a .NET application. To simplify the coding of the application, a class was introduced to handle the communication between the host application and the HTML page’s script. This is the
GMap.vb file in the project and it assumes that the main form of the application, which is called frmGIS, contains the WebBrowser1 control. The GMap class provides methods that call the script’s functions and raises events every time the script calls an external function in the class. The class isolates the HTML/Javascript components of the application from the main application, which calls methods in the GMap class.To initiate the drawing of a new line, the
GMap class provides the StartPolygon() method, which accepts as an argument the polygon’s GUID and name and calls the startShape() function of the script. The following are the relevant statements of the StartPolygon() method: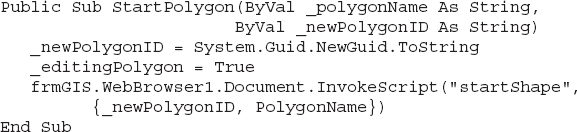
To end the drawing of the current polygon, the
EndPolygon() function must be called: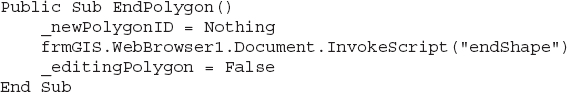
By embedding all the code that controls the script in a class and exposing its functionality through methods, you can greatly simplify the host application’s code. The code behind the New Line button, for example, is as follows:
Listing 12-7 The .NET code to initiate the drawing of a line

Quite a bit of code, but it doesn't contact the script directly; instead, it calls methods of another .NET component, the
GMap class. Apart from the statement that calls the StartLine() method, the event handler contains mostly error checking code.The Basic Data Structures
Before exploring the Windows application’s code, let’s review the structure of the custom objects that are used to represent the various items placed on the map. These objects are based on the following classes, which are declared in the
GMap.vb module of the application, shown in Listing 12-8.Listing 12-8 The structure of the application’s basic objects

The
GeoPoint class represents a location, and it’s used by all other classes. The marker’s Position property, for example, is a GeoPoint type. The paths of lines and shapes are lists of GeoPoint types.The Application’s Context Menu
The desktop application uses a context menu for the map. It’s a very simple menu with just a few commands. The most interesting one is the Show All Items command, which iterates through the elements of each array of items (
lines, polygons, and markers) and displays their basic data on a TreeView control.This control was selected to allow users to expand and collapse items at will as they’re trying to locate the desired item, as shown in Figure 12-3. Listing 12-9 shows how the TreeView control is populated with the polygons already on the map.
Listing 12-9 Adding polygon data to a tree structure
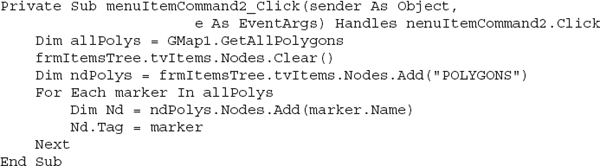
The code shown here shows only how to populate the sub-tree with the polygons. The code for the other two sub-trees is very similar. Note that the object’s name is used as a caption, and the actual object is stored in the node’s
Tag property. When an item is selected on the tree with the mouse, the statements of Listing 12-10 are executed:Listing 12-10 Selecting an item on the map when its name is clicked in the tree

When the user selects a different item on this auxiliary window, the code calls one of the
SelectLine(), SelectPolygon(), or SelectMarker() methods of the GMap1 object to highlight the selected item on the map. The auxiliary window is updated the moment it’s requested. If a new shape is added to the map while this window is open, the contents of the tree structure on the auxiliary window won’t be updated. If you want to incorporate this selection technique in your applications, you should provide the code to update the contents of the tree structure as new shapes are added or existing shapes are deleted so that it’s always up to date. A simpler, but less elegant, approach would be to provide a Refresh button on the auxiliary form so that users can update it at will.The highlighting of the selected items on the map is based on the following script variables, which you can set to the desired values:
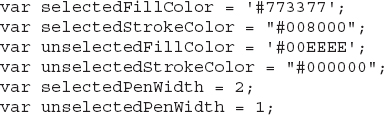
You can also provide methods to set the values of these variables from within the host application and make them parameters of the application. To make the application more useful, you can create layers and assign each shape to a layer. The layer isn’t represented on the map with a special entity; just create an additional property for each item you place on the map, say the
layer property, and assign an integer value to it. By separating the items on the map in virtual layers, you can manipulate these items in groups: You can show/hide an entire layer at once, change the basic attributes of all items on the same layer, and so on. Simply write a loop that iterates all items and examines their layer setting. If they belong to a specific layer, you can change their stroke or fill color, or show/hide them. You just need a user-friendly mechanism to associate items with layers as well as to move items from one layer to another. This type of functionality can be implemented easily in a desktop application with point-and-click or even drag-drop operations. Doing the same on a web interface requires a considerable amount of code.Requesting the Map Items
The various shapes you place on the map aren’t stored in the host application, although it would be very simple to maintain a collection of objects in a .NET application. The shapes are stored in arrays maintained by the script, because there are functions in the script that iterate through these arrays to locate items. Because the script is responsible for manipulating the map’s objects, it makes perfect sense to maintain these objects in the script. What doesn’t make any sense is to maintain two identical lists, one in the page’s script and another one in the host application. If your code is perfect, the two arrays will be always synchronized. This approach, however, means more code to write and test and more potential error sources. Data should be stored at a single location; otherwise, you may end up with two different versions of the same data, and then you’re in for some serious debugging.
The host application, therefore, needs a mechanism to request data from the script. The
GMap class provides the GetAllPoygons(), GetAllLines(), and GetAllMarkers() methods, which return a list populated with objects of the appropriate type. All three functions are nearly identical, and here’s how they request the various shapes from the script.First, they call a function to retrieve the IDs of the shapes. The
getPolylineIDs() function of the script, for example, returns the GUIDs of all lines that have been drawn on the map. Then, they iterate through the appropriate collection using the GUIDs as keys and call another function in the script, getPolylineData(), passing as an argument the GUID of the current line. The getPolylineData() function returns a custom object describing the requested Polyline object. Listing 12-11 shows the code of the getPolylineData() function.Listing 12-11 The
get Polyline Data() function returns a custom object with the selected line’s attributes.
The object returned by the
getPolygonData() function has three properties: the name of the polygon (Name property), the length of the polygon (Length property), and a long string with the coordinates of the path’s vertices Path property). The Path property has the same structure as the <coordinates> element of KML: Each point’s latitude and longitude values are separated by a comma and consecutive points are separated by a space. The GetAllPolygons() and GetAllPolylines() methods of the GMap class parse this string and create a series of Point objects, one for each vertex. Listing 12-12 shows the implementation of the GetAllPolygons() method of the GMap class, which returns a list of Polygon objects.Listing 12-12 The
GetAll Polygons() method of the GMap class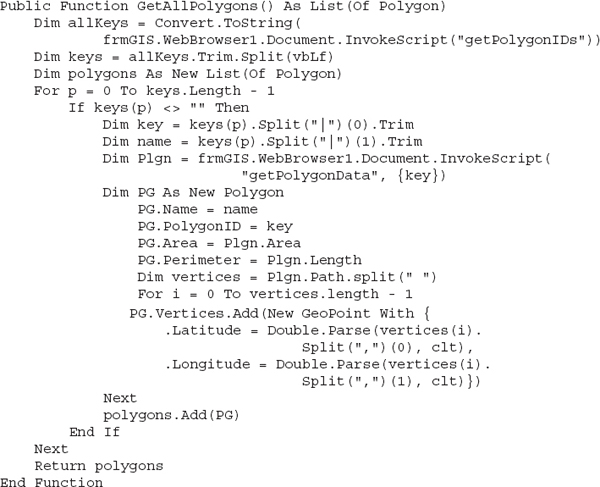
Saving the Map Annotations
A major aspect of both applications is the persistence of the shapes you place on the map. While with the desktop version of the application you can use any format and store the data to a local file, things are not as simple with the web version of the application. To put it simply, there’s no way for a web application to store data to a local file. Even with HTML5, which provides the
FileSystem object and enables the client application to access files on the local file system, you can only use files in the Download folder. To save the map’s data to a file with the web version of the application, you need to use a server component. This component could be a web application running on your server, or a web service that can accept and service requests from the client. Web services are discussed in Chapter 15, and they are a very good option for an application like this. However, you still need a mechanism to enable users to select the desired set of annotations—the equivalent of a file—and limit users to the annotation files they have created in earlier sessions. Developing such an interface with a web application is quite a task. To keep the example manageable, this book doesn’t cover server side applications.Handling the Data in the Web Application
The sample application generates JSON arrays of custom objects for each entity type and displays the array definition in the browser, in the place of the map, as shown in Figure 12-5. This window is just a
<div> element that covers the same area as the map. The application makes the map invisible and the <div> element with the data visible. Users can return to the map by clicking the Close hyperlink at the top.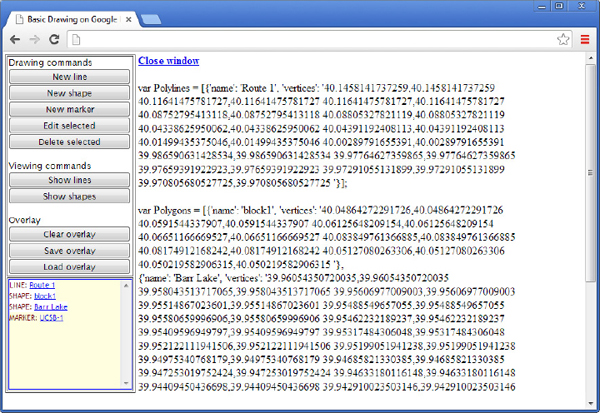
Figure 12-5 Displaying the definition of the arrays with the descriptions of the various items placed on the map
When the Save Overlay button is clicked, the application calls the
saveOverlay() function, which generates the array definitions and prints them. Listing 12-13 shows the implementation of the function.Listing 12-13 The JSON descriptions of map's annotations
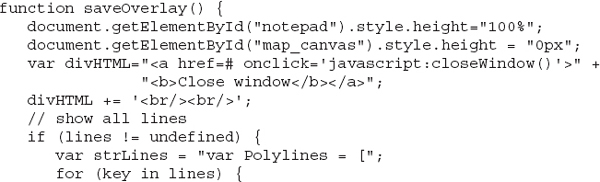

The listing shows only the code that generates the definition of the array with the lines. The arrays with the shapes and markers are generated with similar statements, which were omitted from the listing for brevity. The last statement in the listing assigns the
divHTML variable, which holds the text to be printed on the notepad element of the page.Saving the Annotation Data in the Desktop Application
Persisting the data in the .NET version of the application is much simpler, not to mention that you have many options, including the storing of the shape descriptions to a local file. You can create a KML file with the shapes on the map, a custom XML document to describe the same shapes, arrays of custom objects, and you can even submit the data to a database. The sample application creates a KML document to describe the same data and saves the document to a local file. The KML file contains three
<Folder> elements, which in turn contain the items of each type (lines, polygons, and markers) as <Placemark> tags. The structure of a KML file generated by the application is shown in Listing 12-14. The KML document in the listing contains the descriptions of two lines and one polygon.Listing 12-14 The structure of the KML document with the map’s annotations
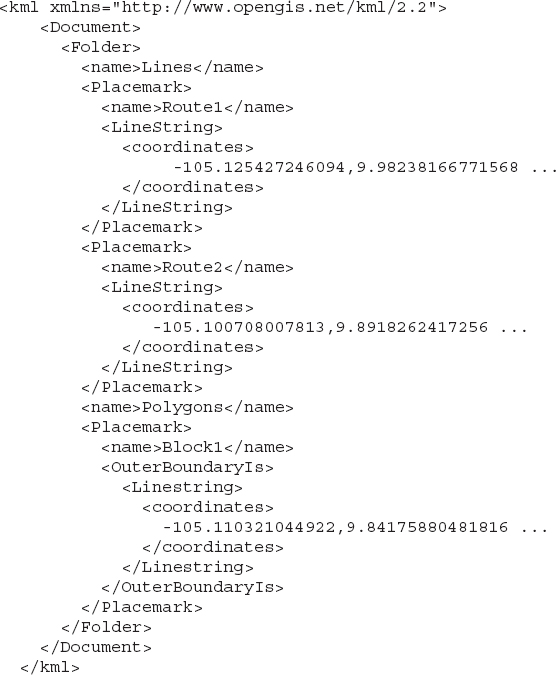
The code that generates the KML document is straightforward Visual Basic/C# code and will not be presented here. You can open the project and examine it. You will also find some additional information on generating XML documents in Chapter 15. The code that reads the KML document is equivalent, and you can examine it on your own. You can also overlay the KML files generated by the application on a map, as explained in Chapter 11.
Summary
In this chapter, you developed a map-enabled application with GIS features, both as a web page and as a .NET program. Either version of the Simple GIS application can be used as your starting point for a highly customized application. You will provide the code for features that are unique to your application and address very specific requirements.
In the following chapter, you're going to learn how to store spatial data to a database. KML files and arrays of custom JSON objects are fine for small scale applications, but if you have a large collection of items to place on the map, you need to be able to use a database. You should be able to store your data to the database and then select only the items you need. The topic of querying databases based on spatial criteria, such as the distance of a location from another or the intersection of a highway (line) and a county (polygon), is an extremely interesting topic.
..................Content has been hidden....................
You can't read the all page of ebook, please click here login for view all page.