CHAPTER |
|
7 |
Markers: Identifying Locations on the Map |
You have learned how to embed maps in your web pages, how to use the basic objects of the Google Maps API, and how to program the common map events to build interactive mapping applications. Now you’re ready to create practical mapping applications by placing data on your maps. You’ll start with point data, which are represented by markers; in the following chapter, you’ll move to shapes.
A marker is an icon that identifies a location on the map. The default icon is a drop-shaped image pinned to a location, but you can assign custom icons to your markers. Google provides a few more images for markers, including colored pushpins, as well as symbols (airports, metro stations, hotels, and so on). There are many collections of images that can be used as symbols in Google Maps on the Web, some of them free while others available for purchase. If none of the existing symbols suits your needs, you can create your own marker images. This topic is demonstrated with examples in Google’s documentation. The process of designing custom marker images is not discussed in this book because with so many symbols readily available, there shouldn’t be many developers who really need to create their own symbols. If you’re one of them, chances are that you’re after some very unique and/or peculiar designs anyway.
Marking Locations on the Map
Markers are placed on a map to identify features and points of interest. They are icons with an arrow pointing to a specific location on the map, and have a title which is displayed in a tooltip box when users hover the mouse pointer over the marker’s icon. The title is a short description of the feature, in most cases just a name, and the tooltip is not customizable.
Finally, a longer and frequently formatted description is displayed in a box that resembles a speech bubble when the user clicks the marker. The bubble is an
InfoWindow object and it’s customizable. You can control the width and the contents of the info window, but you can’t change its pointer, nor make the Close button with the X mark disappear. As for the contents of the info window, it can host an HTML document with formatted text, hyperlinks, and images.Figure 7-1 shows two markers with custom icons that identify airports. Each marker leads to an info window with additional information about the selected airport. The textual description for each airport includes the airport’s code and name, the city and the country name (feel free to include a whole lot of additional data about the locations you identify on the map). The code that displays all markers is identical, except for the HTML fragment with each airport’s description. The figure was generated with the
Markers with InfoWindows.html sample application.
Figure 7-1 A few markers identifying airports in Germany, along with their info windows
Adding a New Marker
Placing a marker with the default look and functionality on a map is very easy. You create a
google.maps.Marker object and you set the two required properties: the marker’s location and the map on which the marker will be placed. Here’s the statement that places a marker at the Space Needle monument in Seattle:
The two mandatory arguments of the
Marker object’s constructor are its location and the map to which it belongs. If you place this statement in the page’s initialize() function, the marker will be placed on the map as soon as the map is loaded. If you place the preceding statement in a button’s click event, the marker will be placed at the same location when the button is clicked. If the user keeps clicking the same button, however, a new instance of the marker will be placed exactly on top of the previous one(s). Clearly, you need a mechanism to detect the presence of a marker and remove it from the map before adding a new instance of the same marker.To remove a marker from the map, call its
setMap() method with the null argument:The two required properties are essential, but the marker you designed so far is pretty useless because it conveys absolutely no information about the landmark it identifies, short of marking a location on the map. The most useful property of the
Marker object is the title property, which is set to the text you want to appear in a tooltip box when the mouse is hovered over the marker. Modify the preceding marker by setting one more property, the title property:
The title appears when the mouse is hovered over the marker, as shown in Figure 7-2.
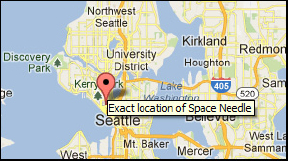
Figure 7-2 The marker’s title is displayed in a tooltip box when the user hovers the mouse over it.
By default, markers remain on the map exactly where you place them initially; users can’t move them around with the mouse because markers indicate a fixed location on the map. However, there are occasions where you may wish to allow users to move markers around. To give users the option to reposition a marker on the map with the mouse, set the marker’s
draggable property to true.Marker Animation
If your map contains a lot of markers, you may wish to provide some visual feedback to your users: for example, when a marker is placed on the map, or an existing marker is selected, you should somehow highlight the selected marker on the map. The best technique for highlighting a marker is to use the
animation property to apply a visual effect to your markers. This property can be set either to DROP or to BOUNCE. The two keywords are members of the google.maps.animation class and you must use their fully qualified names in your code (i.e., google.maps.animation.DROP or google.maps.animation.BOUNCE).The
DROP setting causes the marker to drop from the top of the map and bounce for a few moments before reaching its final position. The BOUNCE effect makes the marker bounce until you stop the animation.The
DROP setting results in an effect that lasts for less than a second but is very noticeable. It’s also easy to use; you specify the animation type in the marker’s constructor:
The
BOUNCE effect is more complicated because you must provide a mechanism to end the animation. If you just set the animation property to BOUNCE in the constructor, you’ll end up with an annoying marker that keeps bouncing. To make a marker bounce, you must call the setAnimation() method, passing the BOUNCE effect as argument and provide a function to end the animation after a number of milliseconds. Here’s how you can animate a marker on the map that will stop bouncing after 1750 milliseconds:
The first statement starts the animation of the marker represented by the
marker variable. As soon as the animation starts, the second statement calls the setTimout() method. The setTimeout() function accepts two arguments: a function and a time interval. After the expiration of the time interval, the function specified by the first argument is executed.The function in the sample code will wait for 1750 milliseconds and then it will stop the marker’s animation by setting it to null. The value of 1750 milliseconds corresponds to three bounces. The
setAnimation() function is discussed in detail in Chapter 18, where you will learn how to use this method to animate items on the map. You will find some examples of real animation techniques in this chapter. Here, we use the setTimeout() function to just end an animation effect initiated by the setAnimation() method of the Marker object.In Chapter 14, you will develop an application that handles a large number of markers on the map, the
Map with Many Markers.html page. This page contains the locations of nearly 9,000 airports around the world and displays only the ones that fit in the current viewport. Below the map, there’s a table of the airports in the current viewport; users can click an airport name to view it on the map. The selected airport’s marker bounces for a second or so when its link in the table is clicked. You can open the project and view the implementation of the HighlightMarker() function, which uses the technique just described.Qualifying Markers with InfoWindows
Another Google trademark is the balloon that appears when you click a marker. This balloon is an
InfoWindow object, and it displays additional information about the selected marker. The InfoWindow may contain plain text or an HTML fragment with formatted text.The
InfoWindow object exposes many properties, the most important being the content property. This property is mandatory and all others are optional. Here’s a typical constructor of an InfoWindow variable (which would appear on clicking a marker over New York):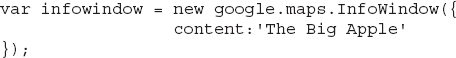
This statement creates an
InfoWindow object, sets its contents, but doesn’t place it on the map. To display the info window, you must call the InfoWindow object's open() method, passing two arguments: the map on which it will appear and the marker to which it applies. When displayed, the arrow of the info window will point at the marker specified in the open() method. To display the preceding info window, you must call the open() method as follows:where
NYMarker is a Marker object that has already been placed on the map.Obviously, the
open() method must be called in the marker’s click event listener. The following statements create a marker located in Manhattan and associate an InfoWindow object with it:
You’re probably thinking that you shouldn’t have to specify the name of the marker twice in the
addListener() method. The first instance of the NYMarker keyword is an argument to the addListener method, and the second instance is an argument to the InfoWindow object’s open() method. It’s actually possible to click one marker and display the info window of another marker! Just make sure this doesn’t happen in your application.The problem with info windows is their size, which can’t be controlled through properties. To change the size of an info window, you can set its contents to a
<div> element and apply a style to this element. The info window will be sized accordingly, while at the same time you can display a small HTML fragment on the info window.TIP Info windows are a convenient mechanism to provide additional information about the selected feature, but it’s by no means your only option. You can place a
<div> element on your page and update its contents from within the marker’s click event listener. This element can be anywhere on the page outside the map’s <div> element, but it can also be a floating element over the map. This technique is demonstrated with an example in the last section of the chapter.Customizing the Marker’s Icon
Markers provide the
icon property, which allows you to specify your own icon for the marker This property can be set to the URL of an alternate icon or to a new Icon object. There are many custom icons you can use with Google Maps on the Web and some of them are provided by Google. The best aspect of Google’s icons is that you can use them directly from Google’s servers. Most third-party markers must be copied to your web server before they’re used. The reason for this is that not too many people want to service so many requests. It goes without saying that you must also pay attention to the icon designer’s license terms. Not all icons are free!There’s a collection of differently colored pins at Google, and you’ll find them at https://sites.google.com/site/gmapicons/home/. The URL of the small red pushpin icon is http://labs.google.com/ridefinder/images/mm_20_red.png.
You can use any image, with the appropriate size, with your markers. In addition, you can use SVG (Scalable Vector Graphics) files. SVG is a language for generating vector graphics, which you can scale at will; SVG icons are ideal for placing custom symbols on your maps. An advantage of SVG graphics is that you can embed the definition of a vector shape in your script, and not necessarily reference an external file. Later in this book, you will find examples of SVG files; Appendix A is an introduction to the SVG format.
To use a different icon with a marker, you must first locate the image that will identify the marker and then use it with the marker’s
icon property. The following is the URL of an airplane icon, which is used by the sample page Markers with Custom InfoWindows.html, to indicate the locations of a few airports in Germany: http://google-maps-icons.googlecode.com/files/airport.png.
A popular site with icons is the Map Icons Collections by Nicolas Mollet, located at http://mapicons.nicolasmollet.com. You can download any of these icons and use them in your pages, or edit them if you wish. They’re free as long as you include a credit to the Maps Icons Collection site. If you decide to use any icons from this or any other collection, be sure to read the licensing terms at that time.
Placing Multiple Markers on the Map
Mapping applications involve more than a single marker. The
Markers with Custom InfoWindows.html web page, shown in Figure 7-3, demonstrates the most straightforward technique for placing multiple markers on the map. Each marker, which represents an airport in Germany, is represented by a Marker object with a custom icon, and it has its own associated InfoWindow object. As you can see in Figure 7-3, you can open all info windows at once; the application leaves it to the user to close the info windows they don’t need on the map. It takes some extra programming effort to close any open info window before opening another one; you will adjust the application’s code to display a single info window at any time.
Figure 7-3 Markers and their associated info windows
Each marker and its associated info window are generated with separate statements in the script. You really need to write the statements to display the first marker and its infowindow; then, you can copy and paste the statements in the script. In Chapter 10, you will see how to iterate through an array of custom objects and create a marker for each item in the array. In this chapter, will find an example that generates the markers from a dataset, which is a JavaScript array of custom objects embedded in the script. This section’s sample application uses straightforward JavaScript statements to generate the map annotations.
The following statement creates a new
Marker object that represents the marker of the Aachen airport. The marker’s position and title properties are set in the Marker object’s constructor. It also sets the map property so that the marker is displayed immediately on the map.
You must now attach an
InfoWindow object to the marker so that users can click the marker and view additional information about the selected landmark. If you don’t care about the appearance of the text in the info window, you can display plain text. Plain text is too rough even for a sample application like this, so you should use HTML code to format your text. It’s common to embed the text into a <span> or <div> element, as in the following statement:
After creating the two objects, another statement connects the marker’s
click event with a JavaScript function that opens the info window:The code contains several copies of identical statements that create the corresponding objects for a few more airports. When the application is opened, all markers are displayed. Every time you click a marker, its info window pops up and displays some data about each airport.
The problem with this approach is that the open info window isn’t closed when the user clicks another marker, as you can see in Figure 7-3. To handle info windows better, the script introduces a global variable,
currentWindow, which points to the current info window. This variable must be declared at the script level, outside the function(s) that use it. The function that’s executed when the user clicks a marker must be modified a little, as shown here: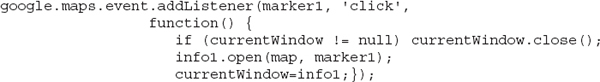
This time the function closes the current info window, if one is open, then opens the selected marker’s info window, and finally sets the
currentWindow variable to point to the info window that was just displayed. The next time the user clicks a marker, the InfoWindow object pointed to by the currentWindow variable will be closed before the new marker’s info window is opened.The RichMarker Control
Along with markers, info windows are the most recognizable items on Google Maps. They’re practically branding symbols for Google Maps, and every web page based on Google Maps uses them. Info windows have two major drawbacks, both related to their size. To begin with, they’re bulky (even though the info window’s size was one of the most prominent changes in the recent visual refresh of Google Maps). Not only that, but in many cases the map is scrolled when users click a marker to accommodate the display of the selected info window. Moreover, you can’t totally control their size. The
InfoWindow object has a minimum size of 200 pixels, which makes info windows inappropriate for displaying a short description, or for use with a small font size. Another problem with the InfoWindow object is that you can’t make the Close button disappear; there’s no option to remove the X icon from an info window.Fortunately, there’s an alternative to the
InfoWindow object: the RichMarker object. The RichMarker object is rendered on the map as a rectangle that can display HTML fragments and has no arrow by default. You can create an arrow as a bitmap, but rich markers work best for placing labels on the map. The labels describe a rather large area of the map, as shown in Figure 7-4, rather than very specific locations. The application used to place the annotations on the map of Figure 7-4 is discussed in the next section.
Figure 7-4 The annotation labels on this map are RichMarker objects.
The
RichMarker object’s basic properties are its contents and its location on the map. The contents are assigned to the content property, and the exact location is determined by the position property, which is a LatLng object. The RichMarker’s anchor property determines the edge of the rich marker that will be placed at the location specified by the position property. The valid settings for the anchor property have self-explanatory names as follows:The
RichMarker object is implemented by the script in the following file, which you must reference in your script with the following <script> directive (it must appear on a single line in your code):To place a rich marker on the map, create a
<div> element that holds the label’s content. The following statement assigns an HTML fragment to the div1 variable. The text is a short description of an airport, but the div1 variable holds a lot of HTML code: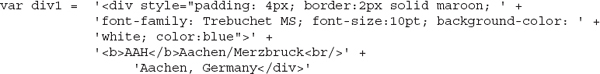
Then, create a new instance of the
RichMarker object and set the label’s content property to the variable with the label’s content and its position property to the position property of an existing marker:To display the rich marker when the
marker1 marker is clicked, set the RichMarker object’s map property from within the marker’s click event handler:
The
currentLabel variable represents the RichMarker object that’s currently active. This instance must be closed before you open a new one, just as you did with the InfoWindow objects earlier in the chapter.The
RichMarker object has no arrow and it’s used as a label to annotate maps. However, it can be used in the place of an info window to display additional information about the selected marker. The sample application RichMarker Demo.html, shown in Figure 7-5, is identical to the Markers with InfoWindows.html application, but instead of info windows it uses rich markers to display the same information. The application displays only one rich marker at a time, not multiple ones, as shown in Figure 7-5. The advantage of using the RichMarker object is that the additional information is displayed exactly next to the marker. It has no Close button and you can control its appearance from within your script.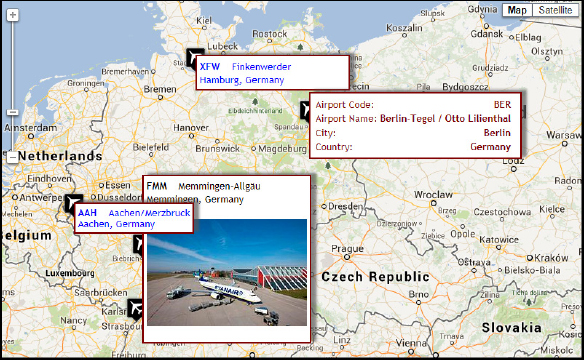
Figure 7-5 The RichMarker Demo application uses rich markers to display additional information about the selected marker.
Another idea you may find interesting in designing custom labels is to make the
<div> element transparent by omitting the background-color style attribute. The end result is to print the text right on the map. You must use a bold typeface and a color that stands out so the users will notice your custom labels. Clearly, this technique shouldn’t be used in areas of a map that are crowded with feature names. Even better, apply a custom style to the entire map, which will make your custom labels stand out.Annotating a Map with RichMarkers
In this section, you’re going to build an interactive web page for annotating maps with rich markers. The
RichMarkers.html application, shown in Figure 7-6, allows users to place rich markers on the map and set their contents through an interactive interface. This is the application used to generate the page shown in Figure 7-4. The buttons at the top of the page allow you to place a new caption on the map, edit or remove an existing caption, and finally create a new static web page that contains the map and the annotations, but not the editing buttons. The contents of the new web page that displays the same map and the annotations are shown in a <div> element at the bottom of the page. Just copy the code and paste it into a new HTML file. The process of converting annotated maps to stand-alone web pages is known as map generation, and it’s a standard feature of any GIS application. In later chapters, you will see more examples of scripts that generate map-enabled web pages. The auto-generated maps can be hosted to a web server so that other users can view, but not edit, them.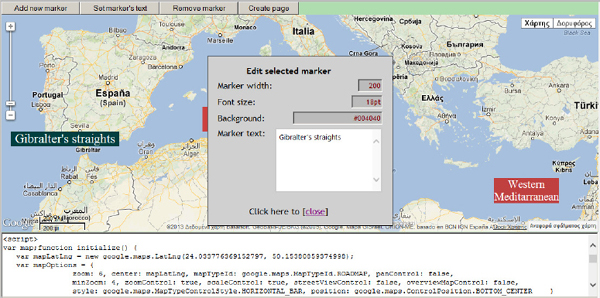
Figure 7-6 Annotating a map with RichMarker controls
New labels are generated when the user clicks the Add New Marker button. This button opens a new window on top of the map with the caption’s data, and users can edit the width of the label, its font size, the background color, and the caption itself. These attributes were selected to demonstrate the process, but you can easily add the text color, border width, and other attributes that affect the appearance of the caption. When the user clicks the Add New Label button, the function shown in Listing 7-1 creates a new
RichMarker object with a default appearance and places it on the map.Listing 7-1 Adding a new RichMarker object with custom content
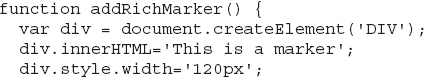
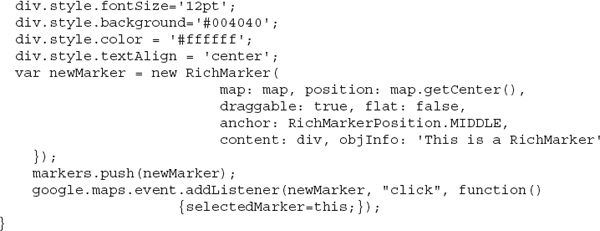
The function generates a
<div> element in code and applies a style to it. The code sets the label’s initial appearance and places the new label at the center of the map. The user is allowed to change the attributes of the style on a pop-up window, and the new settings are applied to the <div> element’s style, changing the appearance of the label on the map.The pop-up window that appears modally on the map and allows users to customize the contents of the selected rich marker is implemented as a
<div> element, whose visibility is turned on and off depending on the application’s status. The <div> element that acts as a pop-up window is implemented with straight HTML code, which is shown in Listing 7-2.Listing 7-2 A
<div> element that’s used as a pop-up window in an HTML application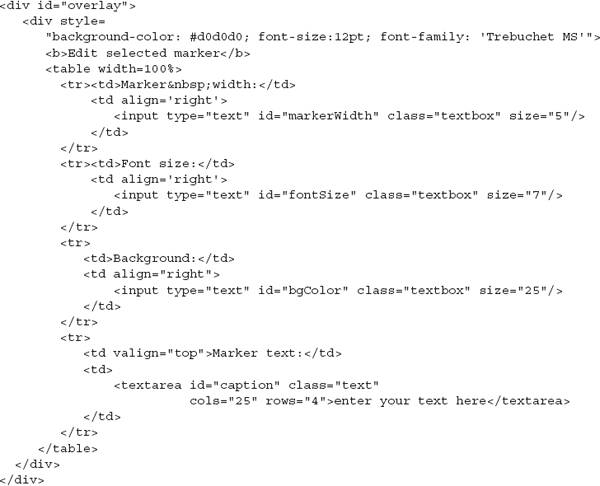
The
overlay() function, shown in Listing 7-3, populates the pop-up window with the selected label’s attributes and then displays it on top of the map. If the pop-up window is already visible, the script reads the user-supplied data from the various elements on the pop-up window and applies them to the currently selected label.Listing 7-3 The
overlay() function applies the user-supplied values ot the map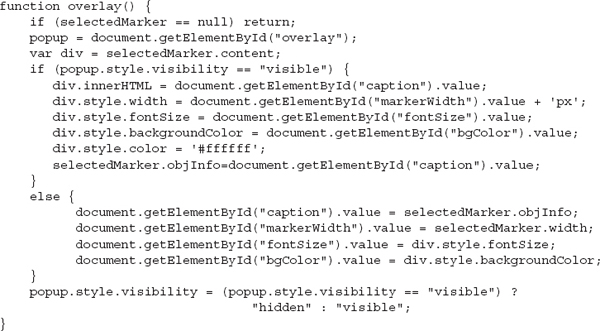
The
overlay() function implements the pop-up window for editing the current marker by examining the visibility of the <div> element. If the element is visible, it changes the settings of the RichMarker object on the map. If not, it reads the settings of the same object and populates the pop-up window with the object's properties. The role of this function is to transfer the data that controls the appearance of the selected label into the pop-up window and the values supplied by the user on this window back to the selected label and change its appearance.Generating the Static Map
After you have placed a number of labels on the map and you have finalized their positions and appearance, you can create a static web page of the map overlaid with the labels. The static page does not provide any buttons for editing the labels, and it does not allow users to drag the labels around, of course. To generate the static page, click the Create Page button. The code will generate a new page, complete with HTML and JavaScript, and will insert the code for the page in the
TextArea control below the map, as you can see in Figure 7-6. You can copy the text, paste it into a new text file, and save it with the .html extension to create a stand-alone web page with the same content. The Autogenerated Map.html page in this chapter’s support material was generated by the RichMarkers.html sample page.The code behind the Create Page button is quite lengthy, but rather trivial: It gradually builds a very long string with the page’s script, followed by some trivial HTML code. The only interesting part of the code in the context of handling the labels is the loop that goes through the labels on the map and generates their declarations:
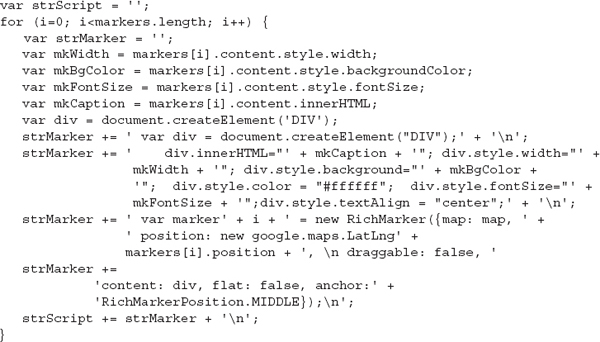
You can look up the
generateMap() function in the RichMarkers project to see how it generates the static page with the annotated map. Of course, the page need not be static. You can embed code to generate listeners for the labels’ click events and display additional data about the selected labels. You can make the page as interactive as you wish—just don’t give users the tools to keep customizing the map. You can store the auto-generated pages into a folder of your web server with meaningful filenames and let the users discover the pages they’re interested in.An Alternate Approach to InfoWindows
Info windows and rich marker lablels are not your only options for displaying additional data for the selected marker (or any feature on the map). You can display the relevant data on a section of the page that hosts the map. Or, you can display the additional data on a floating data window like the one shown in Figure 7-7. Users can drag this window out of the way when they explore the data on the map, or they can minimize and restore it as needed. The data window should be updated every time the user selects another marker on the map.

Figure 7-7 Displaying additional information about the selected markers on floating windows on top of the map. Note that the auxiliary window can also be minimized.
The data window shown in Figure 7-7 is a
<div> element and it’s not as elegant in appearance. The sample application shown in Figure 7-7 uses a tabular layout for the data, but any HTML code you can apply to this window goes. There are also jQuery components that you can use in your HTML pages to achieve this functionality, including shaded boxes with rounded corners, but this book isn’t about third-party components or HTML design. Moreover, the <div> element that implements the floating window was designed manually, to avoid long listings with embedded styles. Actually, the page uses a jQuery component to make the window draggable, but this component is fairly easy to use in your script (it's also optional).The sample page with the draggable window of Figure 7-7 is the
Map with data window.html application, included in this chapter’s support material. The data window is implemented with the following <div> element:
The floating data window is implemented with two
<div> elements, one that contains the window title and the Minimize/Restore links, and another one that contains the contents of the window. Both elements are nested under another <div> element, which is made draggable. The container element, the one with the ID window, is made draggable with the following statement, which must appear at the script level, to be executed as soon as the page is loaded:
This statement applies a jQuery method to the container
<div> element, so you must also embed the following jQuery scripts to your page:These few lines turn any element on the page into a draggable element. As each marker is selected, you must embed its data to the contents of the main section in the floating window. To display a marker’s data window, attach the following listener to the marker’s
click event:The
showInfo() function, shown in Listing 7-3, populates the custom floating window with data regarding the selected city:Listing 7-4 The show
InfoWindow() function populates the floating data window
The code shown here stores a custom object with the city data to the marker’s
objInfo property. In addition to setting the main section of the floating window, this function also highlights the selected marker by assigning the icon of a red pin to the marker. The selected marker is stored in the currentMarker script variable so that it can be reset to a white pin when another marker is selected. This highlighting technique will not work if you’re using differently colored pins to indicate another property, such as the city’s population.The top section of the window contains a title and a hyperlink, which is initially set to Minimize and minimizes the window by hiding its main section when clicked. The window is reduced to a narrow bar and the title of the link becomes Restore. Clicking the link again makes the entire window visible and resets the caption of the link to Minimize again. The following is the
minimizeDataWindow() function:
There’s also a
maximizeDataWindow() function with similar statements, which set the properties of the window to their original values.As mentioned already, the floating window is implemented with straight HTML code. If you think this technique can enhance your application’s interface, you will probably go for a much more elegant third-party component with a distinct look. The floating window isn’t limited to displaying HTML fragments; you can actually embed a small form and interact with the user. For example, you can include checkboxes and react to their
onchange event. Use this technique to allow your application’s users to filter the markers on the map based on certain attributes. Such attributes could be the population of a city, the category of an airport (international, military, and so on), or any other classification scheme appropriate for your application. Another interesting idea would be to maintain a list of the features and make its items react to the mousemove event so that as users move the mouse over the list, a different feature is selected on the map.GIS applications that display a lot of items on the map use this technique to display only the items in specific categories and even subcategories. You can also display items that were built under the same contract, or in the context of the same project, and so on and so forth. The ability to easily filter items on floating windows that can be moved out of the way, or minimized, and restored as needed, is a great aid to users viewing maps with a large number of complex annotations. It goes without saying that you can have multiple auxiliary panes, each one displaying different data.
Summary
You’re done with typical mapping applications! You know how to embed Google maps in your web applications, as well as how to embed a Google map in a Windows application. You know how to manipulate the map through the page’s script with the help of the Google Maps API, how to identify features on the map with markers and how to annotate maps with text.
Starting with the next chapter, you will learn advanced and very useful topics, such as how to draw shapes on a map, store these shapes in files and reuse them, and later in the book how to animate the various items on the map. In the following chapter, you learn about some new objects, such as the
Polyline and Polygon objects, which can be used to annotate maps with shapes. Later in this book, you will see how to draw lines and polygons on the map interactively using the same objects...................Content has been hidden....................
You can't read the all page of ebook, please click here login for view all page.