CHAPTER |
|
9 |
Interactive Drawing: The Basics of Drawing on Google Maps |
In preceding chapters, you learned how to place markers to identify points of interest on the map, and how to draw shapes (lines and polygons) on the map. The process of creating a geometric shape and placing it on the map is straightforward, as long as you know the coordinates of its vertices. For example, you can easily place a colored polygon that fits your property, as long as you know the coordinates of your property’s vertices. This map, however, is static. The only way to change the shape on the map is to edit the page’s script and provide the new, corrected, coordinates.
In this chapter, you learn how to design applications that enable users to truly interact with the map and design shapes right on the map. You will build a web application that allows users to annotate maps dynamically by drawing lines and polygons on the map with the mouse, using the map’s features as guidelines. The ability to interact with Google Maps requires quite a bit of code, but after mastering the basic techniques, you will be able to build highly interactive mapping applications with rich GIS features. You will also learn how to exploit this functionality from within your Windows applications and how to control the drawing process from within a Windows application’s interface.
NOTE This chapter contains some “serious” JavaScript. The good news is that the scripts you’re going to develop in this chapter are self-contained: You can embed a file with the script in any page, or include it in your client script with the
<script> directive, and the "shape drawing" functionality will become instantly available to your application. I will try to explain every bit of JavaScript code presented in this chapter, mostly for the benefit of readers who are not familiar with JavaScript, or readers who wish to understand JavaScript well enough to write mapping applications.Who Needs to Draw on a Map?
Do you really need applications for drawing on a map? The need for specialized and/or customized tools for interacting with maps increases by the day. As maps become mainstream technology and data acquire spatial characteristics, the need for all types of mapping applications is on the rise. Spatial data types are supported by most modern databases; Google is making available all kinds of spatial data through Fusion tables; even traditional tools such as PowerPoint and Visio now provide tools for adding a spatial dimension to business data.
There’s a world of difference between placing items on the map from within your script and enabling your users to draw on the map. Both types of applications are useful, but one of them is static, while the other one is dynamic. If you need to place a large pipe network or the outline of a new apartment complex on the map, then you will get the required coordinates from the engineering or architectural plans. AutoCAD, for example, can export lines and shapes in many different geocoding formats, including KML. If you can obtain the coordinates of the various shapes you want to view on the map, then you don’t need anything more than a bunch of statements that place lines and shapes on the map. You will create a static, or a semidynamic web page, to present the shapes to the users.
But what if the coordinates are not available? If this is case, you must zoom into a roadmap or aerial view of the map and pinpoint the coordinates of a location. You already know how to request the coordinates of any point on the globe by clicking at its location. In many situations, we use Google services to locate features on a map, rather than look at features based on their coordinates. Sure, if you have access to the blueprints of a subway structure, you can create lines for the various routes and place them on the map, even though the actual tunnels are under the earth’s surface. If you don’t have access to precise geo-coordinates, however, your best bet is to use Google Maps to request the geo-coordinates directly from the map’s features by requesting the mouse coordinates, as you saw in the Basic Map Events sample application of Chapter 5. The interactive drawing features you’re going to read about in this chapter will help you build applications that enable users to literally design on the map: to create a line or shape by clicking one feature after the other in an aerial or map view. These features could be the corners of a property, the stops along a route, points along a railroad track, trails, and so on. Other applications include placing on the map paths generated by a GPS device, the design of geo-fences manually on the map, and endless others.
Beyond a basic web application for drawing on maps, in this chapter you’re also going to see a Windows application for tracing natural or man-made features. The Map Traces Windows application, which is discussed in the last section of this chapter, was used to trace the lines of the Paris Metro system and some highways. These datasets are used in sample applications in later chapters. The most advanced application contained in this book is a GIS application based on Google Maps. This application, which is discussed in detail in Chapter 12, relies on the techniques introduced here.
Why Windows Applications
Most major GIS systems are implemented as Windows applications that run on the desktop. Placing complex networks on a map is not something you can do with a web application. It involves a lot of operations and many trips to the server. Web applications are not yet as flexible and as elegant as Windows applications. Web applications can’t provide multiple synchronized windows; they cannot even access the local clipboard or the target computer’s file system to store the spatial data in a local file. Generating custom printouts from within a web application is another thorny issue. A lot of work is being done to bring the ease of the desktop to the Web but we aren’t there yet. While it’s easier to create a sassy interface with rich graphics for the Web, a highly interactive web interface with custom components requires a lot of JavaScript code.
Once you have placed your network on a map, you can create web applications to present various views of the map to viewers. But you will need the richness of a typical Windows interface to lay out your data on the map, validate your data, and create custom views for your users.
Web applications are great for reaching a potentially huge audience but certain types of applications are best implemented as desktop applications, especially if they’re going to be used within the confines of a corporate environment. Luckily, it’s possible to embed maps in a Windows application and manipulate the map from within a rich Windows interface using a .NET language. The main sample application of this chapter is implemented both as a web and as a Windows application, and you will decide the type of application that suits your specific requirements best.
A Simple Web Application for Drawing on Maps
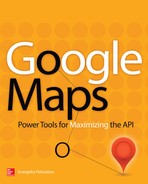
In this chapter, you will build the the Interactive Drawing application, which is shown in Figure 9-1. It’s a web application that allows users to draw lines and shapes on top of Google Maps with the mouse. The figure shows a polygon delimiting the island of Madagascar; the polygon was drawn with the mouse on top of a Google map. The markers you see in the figure identify the vertices of the polygon, and you can adjust the polygon’s exact shape by moving the markers with the mouse.
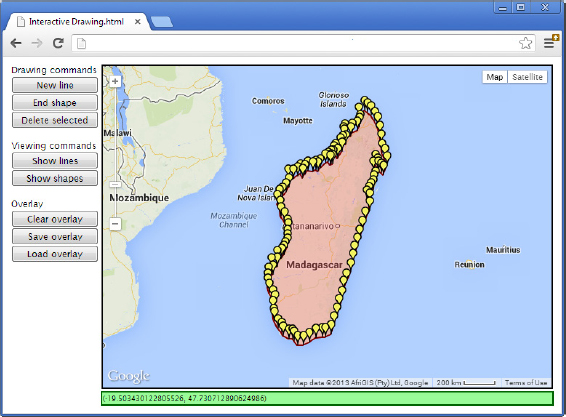
Figure 9-1 A web application for drawing shapes on maps interactively
The script of the
Interactive Drawing.html web page contains all the logic for interactive drawing and the code that implements it. Figure 9-2 is the Windows version of the same application, which is based on the script of the web application. Users can draw on the map using the very same techniques, only this time the commands are initiated from within a Windows application’s interface. Depending on your HTML skills, you can implement a much better looking interface for the web application, but it will never be as rich as the Windows interface.
Figure 9-2 The Windows version of the web application shown in Figure 9-1 with a different polygon
Before you start writing code for either application, you need to design a model for the user’s interface: How will the user initiate the various actions and how will the application react to the mouse events. Then you can write code to implement the interaction model. The interaction model will be implemented mostly in JavaScript because the API can’t be accessed directly from within a .NET language.
Outlining the Interaction Model
Let’s start by laying out a model for the user’s interaction with the map, beginning with the most basic operation, which is the drawing of a path. Because both polylines and polygons are based on a path, all you really need is a mechanism to draw and edit the underlying path. To draw a path with the mouse, you need to provide an intuitive interface for the following operations:
• Insertion of new vertices
• Relocation of existing vertices
• Deletion of existing vertices
The following is the (proposed) process of drawing a new path with point-and-click operations:
1. The user signifies his intention to draw a shape by clicking a button or a link on the page, such as the buttons in the left pane of the page shown in Figure 9-1. The application sets up a
Polyline or Polygon object that will be shaped as the user adds new vertices to it.2. From this point on, and every time the user clicks somewhere on the map, a new vertex is appended to the path and a line segment that connects this vertex to the last one (if one exists) is drawn automatically. The shape consists of vertices, which are identified with markers on the map. Consecutive markers are connected by line segments that are drawn as each vertex is added to the path.
3. The markers on the shape’s vertices remain visible until the user ends the editing operation. These markers allow users to edit the shape while they’re drawing it: Users can move any of the existing vertices around by dragging the corresponding marker with the mouse. The path is reshaped as the user drags each marker.
4. The user can also insert new vertices to the current path by clicking any of the existing markers. A new vertex is inserted in the existing path halfway between the current vertex and the previous one, and the new vertex is identified with its own marker so that users can reposition the new vertex as desired.
5. The user can remove a vertex from the polygon by right-clicking it. As with the other editing operations, the path on the map is updated instantly.
6. To end the path, the user must click another button, or link, on the page (or the same button, if it’s used as a toggle). Upon ending the editing operation, the markers that identify the path’s vertices are removed and the shape is finalized on the map.
Figure 9-3 demonstrates the process of drawing a polygon with the mouse. Every time you click the map, a new vertex is added to the polygon. The numbers next to each marker were placed to show the order of the clicks on the map. Upon ending the drawing, the shape remains on the map, but the markers are removed.
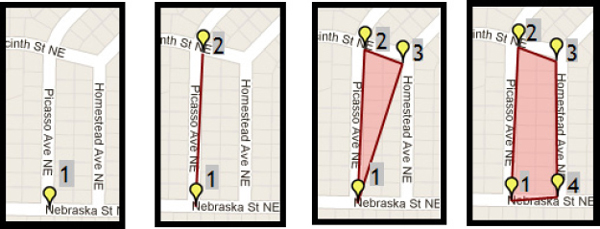
Figure 9-3 Drawing a new polygon with the mouse on top of Google Maps
The proposed technique works nicely even for shapes with many vertices. The application becomes sluggish if you attempt to edit a shape with over 1,000 vertices, but for reasonable sized shapes there are no delays. Very large shapes, however, can’t be created or edited manually. They’re generated by an application, or loaded from a resource. In Chapter 11, you will see an example of loading a KML file with over 500 polygons and a total of over 100,000 vertices on Google Maps.
Obviously, the user can’t start another shape while editing one. Moreover, the usual map operations, like dragging the map and zooming in/out, should remain functional. All the user interaction with the map must take place in the
click event of the map (for inserting new vertices) and the drag, click, and rightclick events of the markers that identify the vertices (for moving a vertex, inserting a new vertex, and deleting an existing vertex respectively).Google’s Editable Shapes and the Drawing Manager
The
Polyline and Polygon objects provide the editable property, which you can set to true to create editable polylines and polygons. The problem with the editable shapes is that they implement their own interaction model, which you can’t customize to suit your needs. Google also provides the Drawing Library, which contains a graphical interface for drawing shapes on the map. It displays its own icon menus and, somehow, helps users draw on the map. You can look it up in the documentation, but it requires quite a bit of programming, while at the same time you’re limited by its interface.If you’re going to interact heavily with Google Maps, I recommend that you implement your own interface. Besides, the custom script you will develop to suit your exact requirements will be readily available to external applications, so you can embed the map in a Windows application. In this chapter, I am laying the foundation for building an ambitious GIS application, not merely providing a simple mechanism for placing a few shapes on the map.
A Simple Starting Point
If you’re learning JavaScript to develop map-enabled applications and you’re not comfortable with the structure of long scripts and events, you should start with the
Basic Drawing.html application, presented in this section. This application is a web page, very similar to the Basic Map page used in preceding chapters to display a map on a web page. The only drawing feature added to the basic map is the drawing of polygons. It’s the simplest possible application for demonstrating the fundamentals of drawing on the map. If you’re comfortable with JavaScript, or you find the application really trivial, just skip it and explore the full application discussed in the section “The Interactive Drawing Application.” Figure 9-4 shows the web page you’re going to build. The page contains a Google map, as usual, and three buttons: the New Shape button, which starts/ends the process of drawing a new shape; the Delete Shape button, which deletes the selected shape; and the Show Shapes button, which displays the basic data for each shape on the map in an alert box. The image was captured while drawing the outline of the Île de la Cité island in Paris, and the first button’s caption has changed from New Shape to End Shape. For the time being, ignore the Delete Shape and Show Shapes buttons.
Figure 9-4 A simple web page that demonstrates the most basic drawing features
To create the
Basic Drawing.html page, make a copy of the Basic Map.html application of Chapter 2 and place the three buttons at the top of the page, as shown in Figure 9-4. Here’s the <body> section of the new page:
The Drawing Functions
The
onclick attribute of the New Shape button is set to an inline anonymous function, which is executed every time the button is clicked. If the button is clicked while its caption is “New shape,” the script calls the startShape() function to start the drawing of the new shape. If the caption of the button is “End shape” at the time, the script calls the endShape() function to commit the shape on the map and resets the button’s caption to “New shape.”The
startShape() function creates a new Polygon object, the poly variable, and sets its path to an empty MVCArray. The polygon is then placed on the map with the setMap() method. Listing 9-1 shows the code of the startShape() function.Listing 9-1 Starting the drawing of a new shape on the map
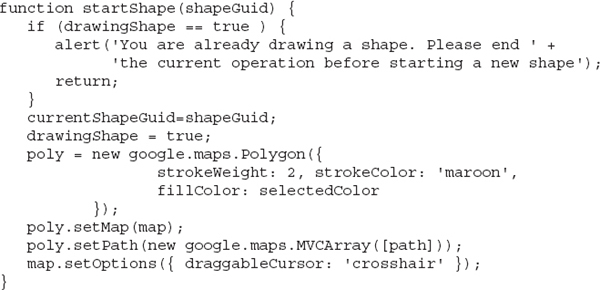
Each shape is identified by an ID value; you will see shortly how this ID is generated. You may prefer to prompt the user for the shape’s ID or name; just make sure it’s a unique name.
The function starts by making sure that the user isn’t drawing a shape already by examining the
drawingShape variable. If this variable, which is declared outside the function, is true, the function exits and doesn’t initiate a new shape while the user is already drawing one. Otherwise, it sets the variable currentShapeGuid to the value passed as an argument, which is the ID of the current shape. It also sets the drawingShape variable to true to indicate that the user is drawing a new shape.Then the code creates a new
Polygon object, the poly variable. The polygon’s path is set to a dark red color, the width of the outline is set to 2 pixels, and the fill color is set to the global variable selectedColor. These settings are applied to the polygon while it’s being drawn so that it will stand out from the other polygons on the map. The poly variable is declared at the script level and is used later in the endShape() function, which ends the drawing of the path and commits the shape.The path of the shape is stored in the
path array, which is another global variable. The path variable is used to store a collection of points, which in turn set the shape’s path. The path is initially empty, but it will be populated gradually as the user creates new vertices by clicking on the map.Adding New Vertices to the Path
Next, you must provide the code to add new points to the shape’s path. This action takes place from within the map’s
click event handler so that every time the user clicks on the map, a new vertex is appended to the current path. You must define a listener for the map’s click event, the addPoint() function, and associate it with the event using the following statement:The
addPoint() function must append a new point to the shape’s path every time the user clicks on the map and is shown in Listing 9-2.Listing 9-2 Appending a new point to the current path, when the map is clicked
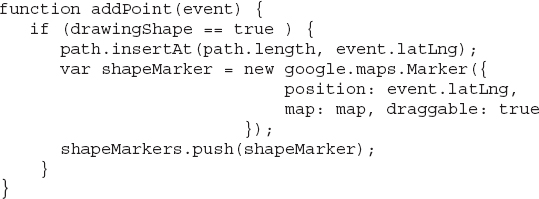
The
addPoint() function reacts to the click event only if the drawingShape variable is true. Otherwise, the event is ignored. The script starts by adding a new point to the path array. Because the path variable is an MVCArray, and not a simple array, the code uses the setAt() method to append a new location to the path and not the push() method. As the path array is modified, the shape is updated automatically. Then it creates a new marker to identify the new point, the shapeMarker object. Each vertex is identified with a marker to help users edit the shape by dragging its vertices around with the mouse. Note that the Marker object’s draggable attribute is set to true. The marker is then added to the shapeMarkers array, this time with a call to the push() method.Note that the listener for the
click event accepts the coordinates of the point that was clicked through the event argument, which is passed to the listener by default; you don’t even have to specify the argument in the addListener() method that calls the addPoint() function.Repositioning Vertices
You must keep a reference to all markers on the map because you want to be able to access them at any time. The markers are draggable, but the shape won’t be affected when a marker is dragged to a new location. You must provide the code to change the corresponding entry in the
path array. This action must take place from within another event listener, the listener for the dragend event of the marker. Add a listener to the dragend event of the shapeMarker variable with the following statement, which must appear before the statement that adds the shapeMarker variable to the shapeMarkers array: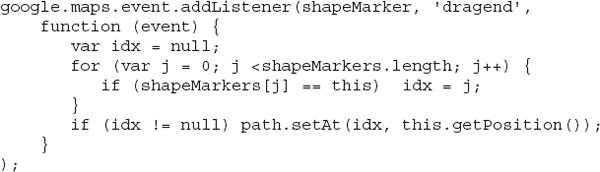
The listener for the
dragend event is defined as an inline function, which iterates through all markers in the shapeMarkers array and locates the current marker. It does so by comparing each element of the array with the marker that was dragged (represented by the keyword this). The index of the marker that was dragged is stored in the idx variable and the last statement sets the matching element of the path array to the marker’s new location. As soon as this statement is executed, the path is updated and the shape is adjusted on the map automatically. In short, when the user drags one of the markers that define the shape on the map, the marker’s dragend event listener changes the coordinates of the corresponding vertex of the path variable, which causes the shape to change immediately.Ending the Drawing of a Path
Finally, you must program the End Shape button by providing the
endShape() function. The endShape() function ends the editing process and commits the shape on the map. To commit the shape on the map, the script changes its fill color and its border width to indicate that the shape is no longer being edited. In addition, the endShape() function must reset the drawingShape variable to false and the button’s caption to “New Shape” so that the user can initiate the drawing of a new shape by clicking the same button again. Listing 9-3 shows the function that ends the drawing of a shape.Listing 9-3 The
endShape() function terminates the drawing of a shape on the map.
The
endShape() function ends the drawing of the current shape: It changes the stroke and fill colors of the shape, adds the poly variable to the shapes collection, and removes the markers that identify the shape’s vertices on the map by calling the clearShapeMarkers() function. It also resets the variables drawingShape and currentShapeGuid before exiting. Note that the script makes sure that the new shape has more than two vertices; if not, it’s not a closed shape (polygon). It’s either a single point, or a line with two points, and it’s rejected. In this case, the function just removes the shape from the map and sets the poly variable to null.The Missing Features
Two very basic operations were not implemented in this simple drawing application: the insertion of new vertices in the path, and the deletion of existing vertices. In the map’s
click event, you handle the addition of new vertices at the end of the path, but not the insertion of new vertices at arbitrary positions of the path.You must also provide a mechanism for users to edit and delete the selected shape. To edit a shape, you must bring back the markers on the vertices and program some of their events, such as the
dragend and rightclick events, to enable users to edit the shape through its markers, just as you did for new vertices. Deleting an existing shape is simpler: You must remove it from the map and also from the corresponding array. These features are implemented in the Interactive Drawing.html application, already shown in Figure 9-1, which is discussed next.The Interactive Drawing Application
The Interactive Drawing application is similar to the Basic Drawing application, and it includes the missing features mentioned in the last paragraph. It’s also based on a more elegant interface, which you can easily extend with custom features.
The Interactive Drawing application allows you to draw both lines and polygons on the map. Let’s start with the script variables for storing the shape data. The
lines and shapes collections store the Polyline and Polygon objects placed on the map, and they’re declared with the following statements:The shape being drawn is stored in one of the two variables:
line or poly. This shape’s path is updated as the user draws on the map, and when the operation completes, the variable is appended to the lines or shapes collection. The currentShapeGuid variable stores the ID of the currently selected variable. This variable is set to the ID of the shape selected on the map by clicking it with the mouse. Finally, the toggle variables drawingLine/editingLine and drawingShape/editingShape indicate the current operation. The following is the definition of the button that initiates the drawing of a new shape on the map:
The
onclick event handler starts a new line, or ends the current editing operation by calling one of the startLine() and endLine() functions, respectively. The startLine() function creates a new Polyline object and sets its path to an empty MVCArray object, the path variable. Then the addPoint() function takes over: Every time the user clicks on the map, the addPoint() handles the event by appending a new point to the path variable, as with the Basic Drawing application.Handling Vertices
You saw how to append new vertices to a path in the preceding sections. The
addPoint() function takes care of this operation. Inserting new vertices between existing ones and deleting existing vertices are two more important tasks, which are carried out not in any of the map’s event listeners, but in the click and rightclick event listeners of the markers.Inserting New Vertices
When the marker that identifies the new vertex is created, its
click event is associated with a handler that inserts a new vertex to the path. The new vertex is inserted halfway between the marker that was clicked and the following one. Here’s the definition of this event handler:
The
insertPoint() function is fairly lengthy. It creates a new marker that will be placed at the location of the new vertex. The script finds out the index of the new vertex in the path array and inserts a new vertex at this index. Finally, it adds the usual event handlers for the click and rightclick events of the new marker. The new marker bounces for a second when placed on the map so that users notice it immediately. Once a new vertex becomes part of the shape’s path, users can edit it just like any other vertex. Listing 9-4 shows the insertPoint() function.Listing 9-4 The implementation of the
insertPoint() function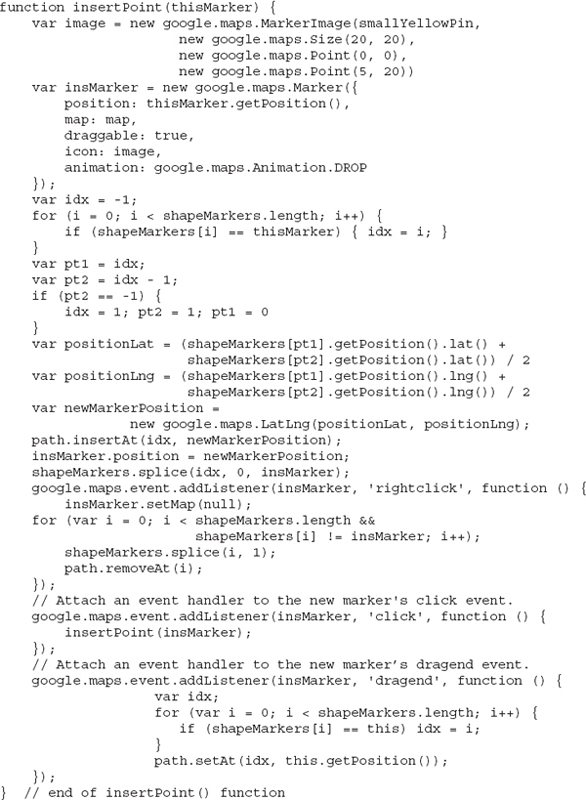
This is the lengthiest function of the application, but it’s worth understanding how it works. The code calculates the midpoint between the marker that was clicked and the preceding one. The coordinates of the new point are stored in the
positionLat and positionLng variables, which are then used as the location of the marker that identifies the new vertex. These two variables are the coordinates of the point to be inserted, which lies halfway between the two consecutive vertices.For each new vertex inserted into the path, the script inserts a new element in the
path array and a new marker in the shapeMarkers array. The path variable is an MVCArray object, and it provides the insertAt() method, which inserts a new item at the specified index. As soon as the new vertex is inserted, the path on the map is updated automatically. The shapeMarkers variable is a plain array and doesn’t support this method. To insert an item in an array, you must call the splice() method, passing as an argument the index of the element to be inserted and the element to be inserted. Contrast the statement that inserts a new element in an MVCArray object:with the statement that inserts a new element in a regular array:
The first argument of the
splice() method is the index where the array will be split, the second argument is the number of elements to be removed, and the last argument is the object(s) to be inserted in the array. The script always inserts a single element into the shapeMarkers array; to insert multiple elements, you must pass an array as the last argument. As with the new vertices that are appended to the path, the script adds the handlers for the click, rightclick, and dragend events of the newly created vertex.Deleting Existing Vertices
Let’s get another trivial editing operation out of the way, that of deleting a marker from the shape while editing it. The removal of the vertex will take place from within the marker’s
rightclick event: When the user right-clicks a marker, the corresponding vertex is removed from the shape, along with the matching marker. First, you must add a listener for the rightclick event to the shape. The event listener’s code is shown in Listing 9-4.The listener is implemented with an inline function that goes through all elements in the
shapeMarkers arrays until it finds the element insMarker. When this happens, it uses the value of the i variable, which is the index of the marker that was clicked in the collection and removes the element at that index. The path variable is an MVCArray and you must use the removeAt() method to remove an element.The code for creating new polygons and placing them on the map is practically identical. Just like lines, polygons are based on paths and instead of creating a Polyline object based on the path created by the user on the map, the script creates a Polygon object.
Handling Shapes
Once the shape is on the map, you need to provide a mechanism to select it. Users need to be able to select a shape in order to edit or delete it, or request additional attributes of the shape. You will see in the following chapter how to request the length of a line and the area of a polygon. You may also associate additional data with each shape, such as a description, operational characteristics, history and maintenance data, anything that suits your application. To enable these operations, you must provide a mechanism for selecting a shape with the mouse, and this will obviously take place in the shape’s
click event, which you haven’t associated with a listener yet.Handling the Shape’s Events
Every time a new shape is created, its
click event is associated with an event handler that allows users to select the shape by clicking on it. To select a shape, the script calls the selectShape() function, which changes the background color of a polygon, or the color and width of a line. The selectShape() function must first unselect the previously selected shape (reset its outline and fill colors) and then select another one. To unselect the currently selected shape, it calls the unselectShapes() method, which resets the colors of all shapes, regardless of whether they’re selected or not. Alternatively, you can keep track of the currently selected shape and reset the colors of this shape only. Listing 9-5 shows the implementation of the selectShape() and unselectShapes() functions.Listing 9-5 The
select Shape() and unselect Shapes() functions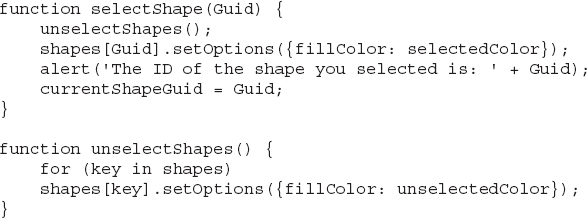
When the user clicks a shape on the map, the script detects the action through the shape’s
click event and displays a simple message with the selected shape’s ID. You can use this ID to access a database through a web service and request additional data about the selected item. The data may reside in a database and your application can access it at will, or you may store additional information in custom objects, which you can then assign to each shape, through the objInfo attribute.Run the application and check out how it interacts with the user. You can easily create any shape (line or polygon) by adding points to the shape’s path. The more vertices you add, the better you will approximate the shape’s outline. Note that sometimes you’ll want to place a vertex at a point that’s in the shape’s interior. Clicking into the shaded area that represents the shape doesn’t create a new vertex because the click event is intercepted by the shape, not the map. In this case, you must create a new vertex outside the shape and then drag it into position with the mouse.
Deleting Shapes
To remove an existing shape from the map, add a new button to the form, the Delete Shape button, and associate its
onclick event with a script that removes the selected shape. The following HTML code adds the Delete Selected button:The
removeSelectedShape() function removes the selected shape from the map, as well as from the shapes collection. Listing 9-6 shows the implementation of removeSelectedShape() function:Listing 9-6 The
remove SelectShape() function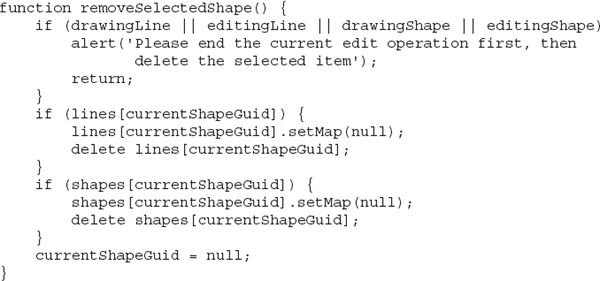
The
removeSelectedShape() function removes the currently selected shape, be it a polyline or a polygon. The ID of the currently selected shape is stored at all times in the currentShapeGuid variable. When no shape is selected on the map, this variable is set to null. The expression lines[currentShapeGuid] returns true if the lines collection contains the element with the specified key.The selected shape is identified by the
currentShapeGuid variable, and the code uses this variable as the key to the shapes collection to (a) remove the shape from the map by settings its map attribute to null and (b) remove it from the collection as well. If you remove the shape from the collection but not from the map, you will have a shape on the map that you will no longer be able to access from within your code. Finally, the code sets the currentShapeGuid to null to indicate that no shape is selected on the map.Customizing the Vertex Icons
If the proposed interaction model isn’t quite what you need, you still have the option to adjust it. If you find the markers too bulky, for example, use a smaller or a custom icon. You can even use small draggable discs to represent the vertices, as in the shape shown in Figure 9-5.
Figure 9-5 Using filled circles as marker symbols in the drawing application
The icon used to identify the vertices in Figure 9-5 is not a
Circle object; it’s one of the built-in symbols, as discussed in Chapter 8. Changing the marker’s icon, as you’ll recall from that chapter, is really simple. Define the icon with a statement like the following:
and then assign the
vertexIcon variable to the icon attribute of the Marker object. Simply replace the statement that creates the marker in the addPoint() function with the following:
The new statement is identical to the old one, with the exception of the
icon attribute. The vertices are identified by markers as before, only this time the marker has a custom shape. Note that the colors of the icons are customizable. If you really need some unique icons for your application, you can use SVG graphics. SVG graphics are used in Chapter 19 and they’re discussed in more detail in Appendix A.You’re in control of the script that manipulates the shapes on the map and you can easily adjust it to suit your specific requirements. For example, you can create an initial path with dozens of vertices between the two endpoints, equally spaced apart, which you can move in place using the underlying map’s features as guides.
Retrieving Shape Data
Another useful operation of the
Interactive Drawing.html web page is the ability to retrieve information about the shapes on the map and display it to the user in a pop-up dialog. To view a summary of all shapes on the map, click the Show Shapes button. For each shape, the script displays its ID and the number of vertices that make up its path. The data retrieval takes place in the ShowShapes() function of the script, which is shown in Listing 9-7.Listing 9-7 Displaying shape data
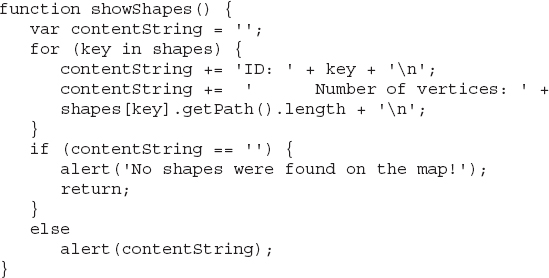
The code iterates through the items in the
shapes collection. Each item in this collection is a Polygon object, and the script uses the current item in each iteration to retrieve information about a different shape. You can easily add the coordinates of the shape’s vertices, or other data. You can print the coordinates of all vertices on an element in your page and export them to any other application in the target computer with a copy and paste operation. In the next chapter, you’re going to learn how to calculate the lengths of lines and areas of shapes, and you’ll be able to display even more useful data about the shapes on the map.The loop uses the expression
key in shapes to iterate through the collection’s keys, and then accesses the current element in the shapes collection with the expression shapes[key]. Each element of the shapes collection is a Polygon object so you can call its getPath() method to retrieve its path. The strokeColor property will return the shape’s outline color, the fillColor property will return the shape’s fill color, and so on.A Pseudo-GUID Generator
As I mentioned, each shape is identified by a GUID value. JavaScript doesn’t provide a function to generate GUIDs. The script contains the
GenerateGuid() function, which generates random hexadecimal values. These values are not true GUIDs and are not globally unique. In your application, you will probably use meaningful names for the entities you place on the map.A Windows Map Drawing Application
The Interactive Drawing application you just created is a web page. It allows you to draw shapes on the map interactively, and it has an interface that’s both functional and intuitive. How about a Windows application with the same drawing features based on the same script? This is quite possible, almost trivial if you have read Chapter 6, which describes how to embed a web page in a Windows interface and use the web application’s script from within the Windows application’s code. To make this section a little easier to read, let’s refer to the Windows application as the host application and the web page as the embedded application (because this is exactly what it’s all about).
This section’s sample project is the Simple Drawing project. It’s a .NET drawing application implemented as a solution with two projects: one in Visual Basic and one in C#. If you’re not familiar with either language, but you wish to see this application in action, you can find the application’s executable in this chapter’s support material.
NOTE If you’re not familiar with Visual Studio, you can still use the application by double-clicking the .exe file in the EXECUTABLE folder. You may be prompted to install the .NET Framework 4.0, if it’s not already installed on your system. The .NET Framework will be installed automatically, after you give your permission in the appropriate prompt. The executable was included to help readers who have not used Visual Studio yet to get the feel of a desktop application with embedded Google maps.
Let’s look at the approach from a designer’s perspective: The Windows application must take advantage of the script you have already developed for the web application. Once the web application is embedded into a .NET project, its functionality should become available to the host application as if it were another .NET component. Imagine that someone has packaged all the functionality you need in order to control the map from within a .NET application in a reusable class. This is exactly what you’re going to do in the following sections.
Interacting with the Script from a .NET Application
To interact with the script of the embedded application from within your .NET application’s code, you need to:
1. Call functions in the embedded application’s script
2. Allow the script to call methods in your application
By calling script functions, you can initiate certain actions, similar to invoking the same functions in a button
onclick event listener. As the user interacts with the map, some of the user’s actions will be handled by the script, but certain actions must be reported to the host application. The script can call public methods in the host application and these method calls are basically event notifications.If you had designed your own class to control a Google map, you would have exposed the
startLine() method to initiate the drawing of a line, and you would call this method with an expression like the following:Instead, you must call the
startLine() function with the following statement:Not much of a problem, is it? In Chapter 12, you’re going to package the functionality of the script in a custom class, but let’s take it one step at a time. In this section, you’ll be manipulating the embedded application’s script directly from within your .NET code.
The .NET Code
You’re ready to look at the code of the Simple Drawing Windows application that provides the same functionality as the Interactive Drawing web application. The interface looks pretty much the same, but it’s designed differently. The Windows interface consists of Windows controls, such as buttons, labels, and the like. The map is displayed on a
WebBrowser control, which is the container for a web page and its script.Loading the Map
When the form is loaded, the following code is executed to load the map into the
WebBrowser control: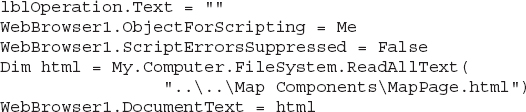
The
MapPage.html file contains both the HTML code for the page to be displayed in the WebBrowser control as well as the script of the application, and it’s stored in the Map Components folder under the project’s folder, as discussed in Chapter 6.The code behind the various buttons is straightforward. The buttons invoke the same script functions as with the web version of the application, only they use the
InvokeScript() method of the WebBrowser control to access the script.When the user clicks the New Shape button, for example, the following statements are executed to initiate the line drawing process with the
startShape() function of the script. If the application is in the process of drawing a line, it calls the endShape() function. The following Listing 9-8 is the code behind the button:Listing 9-8 Initiating the drawing of a shape from within a Visual Basic application

Most of the statements actually modify properties of the controls on the form to reflect the current state of the application. You should focus on the statements that invoke the appropriate function in the script. The code behind the New Line button is equivalent to the code of the New Shape button: Instead of calling the
startShape() function, it calls the startLine() function to initiate the drawing of a line.The script used in the Simple Drawing project is practically identical to the script you used for the Interactive Drawing web application, except that the new script “fires” events by calling methods in the host application. The host application’s code is also very short and almost trivial. All the action takes place in the script and the external application does two things: It initiates certain actions when the user clicks the buttons in the left pane, and it handles the events it receives from the script in the embedded application.
Handling the Map’s Events
A typical map event is the
drag event. When the user drags the map, the script receives the drag event. Instead of handling it on its own, the script passes this event to the external application with the following event listener:The host application contains a public subroutine called
MapDragged (with the exact same spelling), which is invoked by the script to handle the drag event. The event handler in the .NET application does what most scripts would have done: It updates its own interface with an event handler like the following: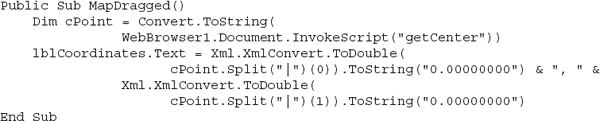
The
MapDragged() method doesn’t accept any arguments, so it must call the getCenter() function in the script to retrieve the coordinates of the map’s center location and display its latitude and longitude on a Label control. This control is placed right below the WebBrowser control with the map and functions as a status bar. The code extracts the individual coordinates and formats them with eight decimal digits. In Chapter 6, you saw how to exchange data with the script using custom objects. I haven’t used custom objects in this application, because I wanted to demonstrate how to use the same script developed for the web version of Simple Drawing application as the foundation of the equivalent Windows application.You can open the Simple Drawing solution in Visual Studio and examine its code. The solution contains two identical projects, one in Visual Basic and one in C#. Both projects share the same web page to embed a Google map into the WebBrowser control on their main form and the same script. Choose your favorite language and add more features to the application. The project contains a relatively small number of statements to invoke functions in the script. Other than that, it’s the script that does all the work and interacts with the user.
The Map Tracing Application
In this section, you explore a different approach to an application for annotating a map with drawings. This time you will build another .NET application, which handles the interaction with the user. It is a highly interactive application that would be considerably more difficult to implement in JavaScript as part of a web page. The application’s interface is a typical Windows interface with rich controls and auxiliary forms. As you will see, this application uses simpler JavaScript functions at the cost of additional .NET code. If you’re a JavaScript developer, you may not like the idea of relinquishing control to the external application, but it’s an alternative you should consider for applications that require lots of customization. If you’re a .NET developer, you’ll probably love the idea of keeping the JavaScript code to a minimum and implementing the more advanced features in a high level language—whenever this is possible, of course.
The Map Traces application is written in a full-blown object-oriented language, takes advantage of the .NET Framework, and is much easier to maintain, not to mention that you can add new features to the application without touching the script. In the folder with this chapter’s support material, you will find both a VB and C# version of the application.
The Map Traces application, shown in Figure 9-6, allows users to create paths by tracing features on the map. The traces you generate with the Map Traces application are paths: They’re collections of vertices and each vertex has a name and a geo-coordinate. The name is optional and can be added/edited at any time; the geo-coordinates, however, are mandatory. Figure 9-6 shows the Map Traces application while it’s used to trace the stations of the Paris metro system.
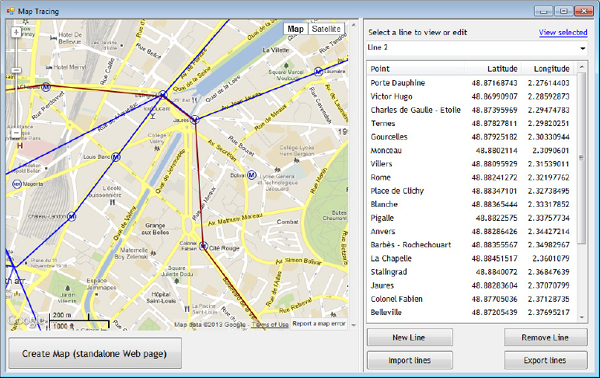
Figure 9-6 Tracing features on a Google map with a Windows application
How to Use the Application
To create a new trace, click the New Line button. From this point on, every time you click on the map, a new point is appended to the current path. A location item is also added to the list on the right side of the form. This item is a named location, made up of the feature’s name and its coordinates. The name of the new feature is initially blank, but you can edit it in-place: Just click the item’s name and the program will allow you to edit the Name cell. When done, just click outside the name’s area. This functionality comes out of the box with the ListView control of Visual Studio.
To insert a new location anywhere in the path, just select a point in the list and then click on the map. The new location will be inserted after the selected location in the list. You can also delete any vertex by selecting it in the list, or on the map, and pressing the DELETE key.
A key concept in this application is the selected line. This is the line whose name is selected in the ComboBox control and its vertices appear in the grid below. Every time you select another line in the ComboBox control, the corresponding
Polyline object on the map is selected and all editing operations explained in this section apply to the selected line.Before you can edit a vertex, you must first locate it. If the vertices have names, you can just click the desired vertex in the list of the right pane with the mouse. A marker will appear on the map at the location of the selected vertex. The marker will bounce for a few moments so that the user can spot it immediately. You can also select a vertex on the map with the mouse. The selection technique used in this application is based on the map’s
rightclick event. Every time you right-click somewhere on the map, the program locates the nearest vertex in the selected line and places a marker at its location to identify it. A vertex of another line may be closer to the mouse location, but the application forces you to work with the selected one. This is the new line you’re creating, or the line you’re editing. You can, of course, change the selection logic, if you wish. You could locate the nearest vertex and then select the line it belongs to from within your code.If you know the exact coordinates of a feature but you can’t locate it on the map (it could be an underground feature not marked on the map), you can still add its location to the path using the coordinates. Just add a new point to the path, and then double-click this point in the grid and enter its coordinates in an auxiliary window. Figure 9-7 shows the auxiliary window where you can edit any vertex’s data. To open this window, just double-click a vertex entry in the list. As soon as you close the auxiliary form, the path will be updated.

Figure 9-7 Editing the name and location of a vertex on an auxiliary form
If you have a list of geo-coordinates, you can easily add modify the .NET application to enable users to paste a long list of coordinates in the grid and then process them sequentially. The advantage of map-enabled Windows applications is that you can implement user interaction techniques that are very difficult (or impossible) to code in JavaScript. The Map Traces application is a typical mapping application that should be implemented as a desktop application. It takes advantage of the rich features of the Windows interface, it makes use of multiple forms, and it can save its data to a local file without the need of a server side component. Keep in mind that an application like Map Traces is not meant to be used by end users; you create the routes and then make them available to end users as stand-alone pages, or special data files that can be laid over the map. A special format for describing spatial data is the KML format, which is discussed in detail in Chapter 11. A detailed presentation of the application’s code can be found in the Map Traces.pdf documents, included in this chapter’s support material.
Summary
This has been a lengthy chapter, but we dealt here with a non-trivial topic. If you’re interested in developing mapping applications with GIS features on top of Google Maps, by now you have all the information you need in order to design applications that enable users to interact with Google Maps.
It’s relatively straightforward to draw shapes on a Google map, and the action takes place in the map’s
click event and in the click event of the objects that represent the shape’s path, thanks to the MVCArray object. By setting a shape’s path to an MVCArray, you reduce the problem of drawing polylines and polygons into manipulating the locations of a MVCArray with the mouse on the map.In Chapter 12, you’ll build a complete GIS application based on Google’s maps and you will see two versions of a GIS application: the Web and the Windows versions.
..................Content has been hidden....................
You can't read the all page of ebook, please click here login for view all page.