
CHAPTER |
|
16 |
Map Annotation and Map Generation Techniques |
One of the most common features of a GIS package is the generation and publication of annotated maps. You have seen in this book so far how to annotate maps with markers, labels, and shapes, and you have developed applications to place items on the map interactively. Now that you have the tools to manipulate maps, it’s time to look at applications that allow you to generate annotated maps and embed them in stand-alone web pages for end users. End users will be able to view the information you place on the map, and even interact to some extent with the items on the map. The web pages you generate, however, are not editable. Users can click a feature to view its properties, even jump to another map, but they won’t be able to edit the items on the map. The applications that enable users to annotate maps with data from various sources are usually desktop applications, as they need not be shared by a large number of users. As such, they run behind a firewall, are highly interactive, and incorporate functionality that can’t be easily achieved with a web application. Let me remind you again that if you plan to use Google Maps with desktop applications, even web applications that are not posted on a public server, you need to purchase a business license from Google. For more information about licensing the Google Maps API, visit https://developers.google.com/maps/licensing.
Map annotation applications are best implemented as Windows applications. You can use high level languages to access databases with spatial data, process XML files, and, when done, generate custom web pages with the data you want to present to end users. You can add as much interactivity to these pages as you wish, but you shouldn’t allow users to edit the maps or directly access your backend data store.
This chapter examines how to generate maps that display very specific information to qualified users. You may have access to the IATA database, with all airports and data about each airport. Or you may own a database with the network of a utility company (oil and gas pipes, electricity cables, and so on). Depending on who is requesting information, you may present different data to different users and even in different formats. This chapter is about preparing the annotations, placing them on the map, and presenting them to end users who can view, but not edit, the annotated map.
This chapter isn’t about any new components or libraries of the Google Maps API. Instead, you’ll put together many of the topics you have learned so far to build some practical and fairly advanced applications. The applications discussed in this chapter are meant to run behind a firewall, so you will need a business license from Google for their API. Even if you only care about web applications, a map annotation application isn’t usually posted at a public URL because you don’t want to let users create their own annotations. Typical map annotation application is used within the boundaries of a corporation to prepare annotated maps for specific categories of users, including the general public. The final product, which is a web page with the annotated map, is then posted to a web server and is made available either to the public, or to authenticated users.
The Process of Preparing Annotated Maps
Let’s start by looking at the overall process of generating annotated maps and then drill into the details. The first task is to specify the information you want to display on your map, locate the information, and then determine how it will be extracted. This information may reside in XML files or a database, or it may be available to you through a third party’s web service, as discussed in Chapter 15. The web service need not be a public one; it could be a web service deployed on an internal web server accessible by employees only, or a public server that requires authentication. Depending on the source of the data, you will take a different approach, and you will most likely use different tools. One of the tools discussed briefly in this chapter is the Visual Studio’s
SqlGeography data type, which maps to SQL Server’s data type by the same name. This data type provides the same functionality as SQL Server’s SqlGeography data type, and you can use the techniques presented in Chapter 13 from within a .NET application. You also know how to read data from XML and JSON documents and how to use it as the data source for your annotations.The variety of data sources is an important factor in the process. The recommended technique is to design your own web service to provide the data. The web service will encapsulate much of the complexity as it will provide the required data as a well-structured XML or JSON document. On the back end, the web service may contact all kinds of data sources; its role is the isolation of the web application from the raw data. You have already seen in the preceding chapter how to retrieve data from a SQL Server database and convert it into a KML document.
The second task is the generation of an HTML page that displays the selected data on a map. You can write an application that generates a web page with a map and the appropriate script to place your data on the map, or you can create a general web page that acts as a framework and retrieves the desired data as needed. The second approach requires careful design and a substantial amount of non-trivial code. In this chapter, you’ll follow the modest approach of generating the necessary HTML code for a map-enabled web page, and then running the script that will place the desired items on the map. The annotation data are the basic items you place on maps, such as markers and labels, images and shapes.
To get an idea of the type of applications you’ll learn to design in this chapter, take a look at Figure 16-1, which is the SQL Spatial application. This application uses the database you created in Chapter 11 to store spatial data in SQL Server’s GEO database. The SQL Spatial application is a .NET application that allows you to read spatial data regarding cities, county borders, and highways from the database and places it on a map. You have seen in the preceding chapter how to extract the spatial data from the GEO database and store it into collections of custom objects, as well as how to convert it to KML/JSON format. In this chapter, you’re going to explore the code behind the button that generates a stand-alone web page with an embedded map that contains annotation items.

Figure 16-1 A map page generated automatically with spatial data from the GEO database
An Alternate Approach to InfoWindows
You’ll begin this chapter by looking at a web application that demonstrates how to use legends on the map. The same application also demonstrates an approach for handling maps with a large number of markers. The manipulation of a large number of markers on the map is a non-trivial topic discussed in detail in Chapter 14. Identifying locations on the map with markers and displaying additional information on info windows and RichLabels are not your only options. You can display the relevant data on a section of the page that hosts the map. Or, you can display the additional data on a floating window, like the one shown in Figure 16-2. This window is usually implemented as a
<div> element displayed on top of the map. Users can drag this window out of the way when they explore the data on the map; they can also minimize and restore it as needed. The floating window on top of the map is the map’s legend and it may contain all kinds of information—from symbol explanations to detailed information about the selected feature. Legends on printed maps contain descriptions of the symbols and/or colors used on the map, but legends of electronic maps are extremely flexible and interactive. In addition to displaying details about the selected features, they may also contain links to other pages or commands for manipulating the map itself or the features on top of the map. Figure 16-2 shows a map with a legend for presenting additional data about the marker that was clicked. Unlike legends on printed maps, the legends for electronic maps are quite flexible, and their form and contents can change depending on the current selection.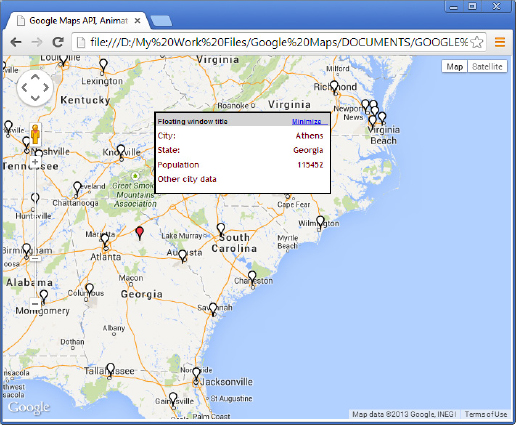
Figure 16-2 Displaying additional information about the selected markers on floating windows on top of the map
The window with the additional data is a plain
<div> element and it’s not as elegant in appearance. There are jQuery components that you can use in your HTML pages to achieve this functionality, but this book isn’t about third-party components or HTML design. Moreover, the <div> element that implements the floating window was designed manually, to avoid long listings. Actually, the page uses a jQuery component to make the window draggable, but this component is easy to use (not to mention that it’s not required for the proper operation of the sample application).Designing the Legend Window
The sample page of Figure 16-2 is the
Map with data window.html application, included in this chapter’s support material, and the data window on top of the map is implemented with the following <div> element: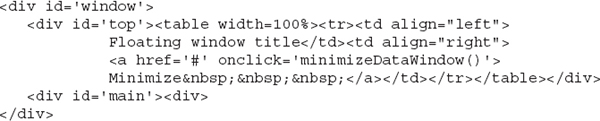
The floating window is implemented with two
<div> elements, one that contains the window title and the Minimize/Restore link, and another one with the contents of the window. Both elements are nested within an outer <div> element, which is made draggable. The container element (the one with the id attribute “window”) is made draggable with the following statement, which must appear at the script level and be executed as soon as the page is loaded:
This statement applies a jQuery method to the container
<div> element, so you must also insert the following jQuery scripts to your page:These few lines turn an element on the page into a draggable element. As each marker is created in code, you must also generate the corresponding entry for the main section in the floating window. To do so, attach the following listener to the marker’s
click event:In the sample page, the
showInfoWindow() function populates the custom floating window with data about the selected city. The function accepts as an argument a Marker object whose objInfo property stores a custom object with additional data about the marker. You have only a few data items for each city, but formatting them for presentation may take quite a bit of HTML code. Listing 16-1 shows the sample page’s showInfoWindow() function’s implementation.Listing 16-1 The
showInfo Window() function generates the legend item for the selected marker on the map.
In addition to setting the main section of the floating window, this function also highlights the selected marker by assigning the icon of a white pin to the marker. The selected marker is stored in the
currentMarker script variable so that it can be reset to a red pin when another marker is selected. This highlighting technique will work if you’re using differently colored pins to indicate another property, such as the population of each city.The top section of the window contains a hyperlink, which is initially set to “Minimize” and minimizes the window by hiding its main section when clicked. The window is reduced to a narrow bar and the title of the link becomes “Restore.” Clicking the link again makes the entire window visible and resets the caption of the link to “Minimize” again. The function
minimizeDataWindow() is shown here: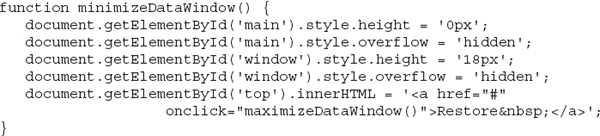
The listing of the function is shown here to complete the presentation of the application, but it’s not related to mapping features. It’s typical JavaScript code that manipulates the contents of the page.
As mentioned already, the floating data window is implemented with straight HTML code. If you think this technique can enhance your application’s interface, you will probably go for a much more elegant jQuery component with a distinct look. The floating window isn’t limited to displaying HTML fragments; you can actually embed a small form and interact with the user. For example, you can include checkboxes and react to their
onchange event. Use this technique to allow your application’s users to filter the markers on the map based on certain attributes. Such attributes could be the population of a city, the category of an airport (international, military, and so on), or any classification scheme appropriate for your application.The ability to easily filter items on floating windows that can be moved out of the way, or minimized, and restored as needed, is a great aid to users viewing maps with a large number of complex annotations. This type of in-place filtering provides immediate feedback (even if it takes a few extra moments to update the map) and users can see the effects of their changes. Of course, you can combine the ideas discussed here with multiple panes on top of the map.
Annotating Maps with Labels
You have already seen examples of applications that allow you to draw shapes and place markers on a map. These are highly interactive applications that are not always suitable for end users. You probably don’t want to dump all the airports on a map and let users find their way in an endless collection of makers. Chances are that you want to display airports in a specific part of the world, or specific types of airports (international/military airports), and so on.
The
Labeled Airports.html page allows you to place data on maps as labels. The application’s form is shown in Figure 16-3 and, as you can see, there are no markers. I have used markers to identify locations of interest on the map in most of the previous chapters, but it’s time to move beyond markers. Even with the fanciest icons you can design, a map filled with markers isn’t terribly useful because users need to locate the point they’re interested in. Alternatively, you can provide search features to make your application easier to use. Labels allow you to present the basic information right on the map, as long as you’re working at a zoom level that doesn’t overload the map with labels.
Figure 16-3 Displaying feature data directly on the map
The labels shown on the map react to the
mouseover and mouseout events by changing the appearance of the label under the mouse pointer. Just hover the mouse over a label on the map and it will expand to display more data about the selected feature, which in the case of the sample application are airports. Figure 16-4 shows the expanded airport label in the Labeled Airports sample page.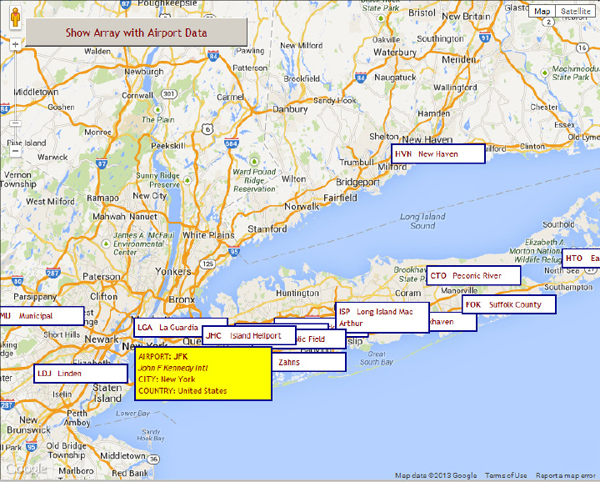
Figure 16-4 Expand a label to view more details by hovering the mouse over it.
To annotate the map, click anywhere you want to place a label, and a pop-up window will appear where you can enter the new feature’s data. After closing the pop-up window, a new label will be placed on the map. You can edit the label by moving it to another location with the mouse, or click the label to edit its data on the same popup, as shown in Figure 16-5. The
Labeled Airports.html application contains a number of labels that correspond to airports located at the two coasts of the United States so that you can experiment with it right away. If you need to annotate the map with different features, just delete the array with the airport data, which is the airports array, and replace it with your own array of custom objects. You can see the structure of the custom objects describing airports by examining one of the elements of the airports array:
Figure 16-5 Editing the selected feature’s data

You must also change the pop-up window where users enter each feature’s data by replacing the fields that describe an airport with the fields that describe the features you’re presenting on the map.
The
Labeled Airports.html Web PageIn this section, you’ll examine the code of a web application that allows you to identify features with labels instead of markers. The Labeled Airports sample application is based on the
Maps with Many Markers sample application you developed in Chapter 7. In Chapter 7, you designed an application that identifies each airport with a marker and displays a table of all airports on the current viewport below the map. The revised application shows a label with the airport’s basic data right on the map, so there’s no need to display the auxiliary table.When the user drags the map, the script selects the airports that fall within the map’s viewport and stores them in the
airportsInViewport array. Then, it iterates through the elements of the array with the selected airports, creates a new RichMarker control for each airport, and places it at the appropriate location on the map. Listing 16-2 shows the outline of the loop that generates a RichMarker control for each airport and places it on the map.Listing 16-2 Placing a label for each of the selected airports on the map
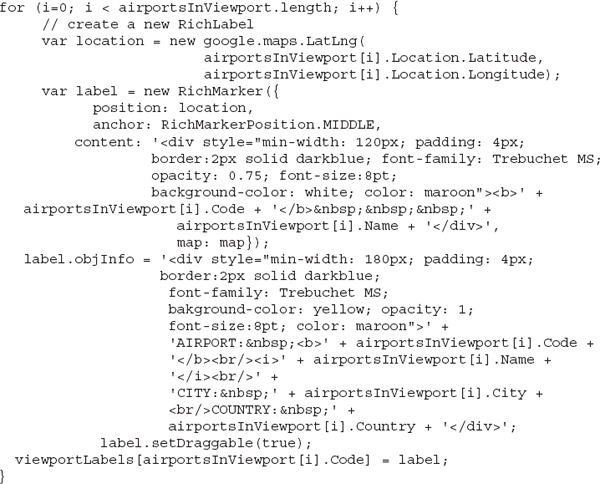
It’s a rather lengthy statement, but it simply sets the contents of the two
<div> elements that represent the same features in two states, as shown in Figures 16-3 and 16-4. The short version of the label is assigned to the label’s content attribute, while the extended version of the label is assigned to the objInfo attribute and is used to set the labels contents when the mouse is over the label. When the mouse is moved out of the label, the label’s content is reset to the short description of the airport.Attaching the Event Listeners
The challenging parts of the script are the statements that associate the event listeners with each label. Because the event listeners are added from within a loop when the labels are created, the script uses closures to pass the correct arguments to each listener when it’s executed. As you recall from Chapter 4, each event listener is added with an anonymous function that’s executed without being called.
The events you’re interested in are the following:
•
click When the label is clicked, the script prepares it for editing by displaying the pop-up data window with the label’s data.•
position_changed When the label is dragged with the mouse, the script updates its position in the array with the label data. The dragging of the label is a limited edit operation that affects the label’s position only.•
mouseover When the mouse pointer enters the label, the script displays the extended version of the label.•
mouseout When the mouse pointer leaves the label, the script displays the short version of the label.Let’s start with the
click event, which is really simple. To add a listener for the click event to the current label, which is represented by the label variable, insert the following statement in the loop: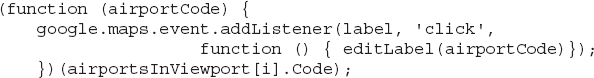
The array
airportsInViewport holds the airports (or any other feature you choose to display in your customized version of the application) that fall within the current viewport. This technique was demonstrated in Chapter 7; it displays only the airports that are visible at the time so that the application remains responsive even with a very large number of labels (as long as you don’t zoom out too much, of course, in which case you may end up with hundreds, or thousands, of airports in the viewport).The preceding statement associates the
editLabel() function with the click event of the current label, which is represented by the label variable. The airport’s code must be passed to the function as an argument when the function is invoked. The editLabel() function is straightforward: It copies the values of the feature that was clicked on the floating data window’s fields and then displays the <div> element that implements this window by setting its visibility property, as shown in Listing 16-3.Listing 16-3 The editLabel() function

The element names shown in the listing are the names of the various elements in the
<div> element that implements the pop-up window. You can find the HTML code that implements this element in the application’s HTML section. Whether the user is adding a new label to the map or editing an existing one, he or she must end the operation by clicking one of the Add Label or Cancel buttons. The Add Label button creates a new object and adds it to the airports array, or updates the selected airport data with the function shown in Listing 16-4.Listing 16-4 The addNew Label() creates a new label on the map, or updates an existing one

Note the use of the
selectedAirport variable: If the user has selected an airport label to edit, this variable holds the code of the selected airport and the program uses it to update the appropriate row in the array: the airports[idx] element. If the selectedAirport variable’s value is –1, then the user is entering a new label’s data and, in this case, the code appends a new custom object to the airports array. The values of the custom object’s properties are read from the fields of the popup window. Note the one-line loop that iterates through the airports array to locate the index of the selected airport based on its code. The desired index is stored in the idx variable, which is then used to access the appropriate element in the array and update its value.The code doesn’t contain any validation code, which you can add if you feel like exercising your HTML and JavaScript skills. You can make sure that all airports have a unique code, and that users aren’t allowed to edit the airport code. The script doesn’t update the airport code in the array, even if the user has modified it. You should either make the code’s field read-only, or remove the custom object with the old code (the airport’s key in the collection) and insert a new custom object to the
airports array. You could simplify the script a little by using a collection to store the airports (an associative array that uses the airport code as the key for its elements).Deleting Labels
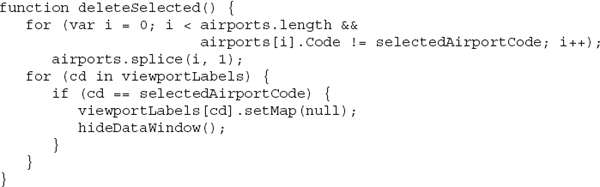
To delete an airport, the script calls the
deleteSelected() method, which removes the selected airport’s label from the airports array and also from the map. To find out the selected airport, the code iterates through the array’s elements and locates the row whose Code field matches the value stored in the selectedAirportCode. Then it removes this row from the array with a call to the splice() method. Removing an airport’s data from the array doesn’t remove it from the map; to remove the corresponding element from the map, the script goes through the items of the viewportLabels array, finds the label with the same code, and removes it from the map by calling its setMap method, passing the value null as an argument. Listing 16-5 shows the implementation of the deleteSelected() function.Listing 16-5 Removing an airport label from the map
The
hideDataWindow() function, which is called after each editing operation, hides the data window with the selected airport’s data. The deletion operation removes the label from the map and keeps it up to date. The insertion and edit operations do not add a new label or update the selected label on the map, respectively; instead, they call the showMarkersInViewport() method to redraw the current viewport. This operation may take a couple of seconds to (unnecessarily) redraw all labels on the map, but there’s an advantage to updating the window based on the raw data: If an operation fails for any reason, users will notice that their changes have not taken effect as they should. You should use an exception handler to handle all errors in your code, but going to the source of your data from time to time is a good practice.After editing the labels on the map, you can click the button at the top of the map to generate the listing of the
airports array with its current data. The array is displayed on a <div> element, and you can copy its definition and reuse it as needed. For example, you can replace the original contents of the airports array in the sample page, or create a new page that uses this array to display the updated labels on the map.If you thought about it even for a moment, no, you can’t modify the file that contains the HTML document from within the script! It’s possible for the script that has been loaded to update itself, but not the file in which it resides.
You can also create more elaborate labels that contain formatted text and even images. All labels need not have the same structure. For example, you can use different labels for different types of airports. Because the labels will overlap heavily if you zoom out, you should add a parameter that determines the minimum zoom level for each label to prevent users from cluttering their maps with symbols.
When too many labels are visible on the map, some of the
mouseout events are missed and you may see multiple selected labels. You can simply move the pointer slowly over these same labels to reset them back to their summary view.The
Labeled Airports.html page is lengthy, but it’s well documented and you can follow it easily. You should try to combine the functionality of the Labeled Airports application with the Simple Drawing application so that you can annotate your maps with all kinds of items: markers, lines, circles, shapes, and labels.Map Generation Techniques
The ultimate technique for generating maps is a web application that allows users to specify the information they want to view on a web page and then transmits to the client a web page with the map as usual, with the desired data laid over the map. This type of application requires server components tied to a specific environment. In this section, you’ll see how to generate annotated web pages from within a .NET language. These pages can be placed in a directory under your web server, where people can request and view them.
To generate an HTML page from within an application, you create a string variable with the page’s contents. You can use your favorite programming language to streamline the generation of an HTML with a script, including JavaScript. It’s very simple as long as you pay attention to the use of single and double quotes. In .NET languages, strings are delimited with double quotes. If you want to embed double quotes in a string with a VB statement, you insert two double quotes in succession. To assign the string
to a VB variable, you must replace each instance of the double quote character with two double quotes, as shown here:
This is a VB statement and the
vbLf constant indicates a new line character. The & symbol is an operator that concatenates strings (in JavaScript and C# you use the addition symbol). Note that this symbol is used as part of the embedded string to separate the arguments to the URL as well as to combine the fragments of a long string in Visual Basic. To produce the same result in C#, use the addition operation and escape the double quote symbol as you would do with JavaScript:One of the sample applications you will find in this chapter’s support material is the SQL Spatial application, which is a .NET application that generates stand-alone HTML pages that contain embedded maps with spatial data. The data is read from the GEO sample database, discussed in Chapter 13. It’s a .NET application, and if you’re interested in it, please open the
SQL_Spatial.pdf file, where the application is discussed in detail. As you will see, once the data have been read from the GEO database into the client application, the code iterates through the data items and generates a new HTML page as a string. The first figure of this chapter shows a map generated by the SQL Spatial application using the data of the GEO sample database.Summary
You have covered a lot of ground so far. You know how to exploit Google Maps API with both web and Windows applications, how to draw on maps, and how to annotate maps with labels, markers, and shapes interactively. You also know how to persist spatial data in KML files and databases and how to query spatial data from database tables. You have also learned how to request data from web services to place the items you’re interested in on a map, and how to generate annotated maps from within your code. You have seen all of Google Maps API in action, and you can build highly customized map-enabled applications.
The following chapter deviates from the Google Maps API and looks at a few related APIs from Google: the Directions API, which allows you to retrieve instructions for getting one place to another, and the Geocoding API, which allows you to discover the geo-location of any physical address or the physical address nearest to any location. You will learn how to use the Geocoding API to find out the country or state that was clicked and react accordingly.
The two APIs discussed in the following chapter are also available as web services, which you can access through a URL from within your browser, or call them directly from within an application written in any language that supports web services.
..................Content has been hidden....................
You can't read the all page of ebook, please click here login for view all page.