
The Foreign Exchange Market
Abstract
Foreign exchange trading refers to trading one country’s money for that of another country. The kind of money specifically traded takes the form of bank deposits or bank transfers of deposits denominated in foreign currency. The foreign exchange market typically refers to large commercial banks in financial centers, such as New York or London, that trade foreign-currency-denominated deposits with each other. This chapter provides a big picture of foreign exchange trading and particularly covers the details of the “spot market,” which is the buying and selling of foreign exchange to be delivered on the spot as opposed to paying at some future date. Major issues discussed are trading volume, geographic trading patterns, spot exchange rates, currency arbitrage, and short- and long-term foreign exchange rate movements. Specific examples illustrate the discussions of broad concepts. Two appendices further elaborate on exchange rate indexes and the top foreign exchange dealers.
Keywords
Arbitrage; asymmetric information; bid/offer spread; currency arbitrage; currency cross rate; exchange rate movement; foreign exchange market; inventory control; rogue trader; spot exchange rate; spot market; trade flow model; triangular arbitrage; two-point arbitrage
Foreign exchange trading refers to trading one country’s money for that of another country. The need for such trade arises because of tourism, the buying and selling of goods internationally, or investment occurring across international boundaries. The kind of money specifically traded takes the form of bank deposits or bank transfers of deposits denominated in foreign currency. The foreign exchange market, as we usually think of it, refers to large commercial banks in financial centers, such as New York or London, that trade foreign-currency-denominated deposits with each other. Actual bank notes like dollar bills are relatively unimportant insofar as they rarely physically cross international borders. In general, only tourism or illegal activities would lead to the international movement of bank notes.
Foreign Exchange Trading Volume
The foreign exchange market is the largest financial market in the world. Every 3 years the Bank for International Settlements conducts a survey of trading volume around the world and in the 2016 survey the average amount of currency traded each business day was $5,088 billion. Thus the foreign exchange market is an enormous market. Fig. 1.1 shows that the foreign exchange market has been growing rapidly in the last decade. In 2001 the trading volume of foreign exchange was $1,239 billion. In 2007 the foreign exchange market had almost tripled in volume, and by 2013 the foreign exchange market had grown another $2 trillion.

The US dollar is by far the most important currency, and has remained so even with the introduction of the euro. The dollar is involved in 87% of all trades. Since foreign exchange trading involves pairs of currencies, it is useful to know which currency pairs dominate the market. Table 1.1 reports the share of market activity taken by different currencies. The largest volume occurs in dollar/euro trading, accounting for 23% of the total. The next closest currency pair, the dollar/yen, accounts for slightly less than 18%. After these two currency pairs, the volume drops off dramatically. For example, the dollar/UK pound is roughly half as much foreign currency trading as the dollar/yen. The US dollar is represented in nine of the top ten currency pairs. Thus, the currency markets are dominated by dollar trading.
Table 1.1
Top ten currency pairs by share of foreign exchange trading volume
| Currency pair | Percent of total |
| US dollar/euro | 23.0 |
| US dollar/Japanese yen | 17.7 |
| US dollar/UK pound | 9.2 |
| US dollar/Australian dollar | 5.2 |
| US dollar/Canadian dollar | 4.3 |
| US dollar/China yuan renminbi | 3.8 |
| US dollar/Swiss franc | 3.5 |
| US dollar/Mexico peso | 2.1 |
| Euro/UK pound | 2.0 |
| US dollar/Singapore dollar | 1.9 |
Source: Bank for International Settlements, Triennial Central Bank Survey, September 2016.
Geographic Foreign Exchange Rate Activity
The foreign exchange market is a 24-hour market. Currencies are quoted continuously across the world. Fig. 1.2 illustrates the 24-hour dimension of the foreign exchange market. We can determine the local hours of major trading activity in each location by the country bars at the top of the figure. Time is measured as Greenwich Mean Time (GMT) at the bottom of the figure. For instance, in New York 7 a.m. is 1200 GMT and 3 p.m. is 2000 GMT. Fig. 1.2 shows that there is a small overlap between European trading and Asian trading, and there is no overlap between New York trading and Asian trading.

Dealers in foreign exchange publicize their willingness to deal at certain prices by posting quotes on electronic networks such as Reuters or EBS. When a dealer at a bank posts a quote, that quote then appears on computer monitors sitting on the desks of other foreign exchange market participants worldwide. This posted quote is like an advertisement, telling the rest of the market the prices at which the quoting dealer is ready to deal. In addition to the electronic trading venues, there is still bilateral direct-dealing in the market where one person speaks with a bank dealer to arrange a trade. These bilateral transactions and the quantities and prices that are transacted are proprietary information and are known only by the two participants in a transaction. The quotes on the electronic trading networks are the best publicly available information on the current prices in the market.
In terms of the geographic pattern of foreign exchange trading, a small number of locations account for the majority of trading. Table 1.2 reports the average daily volume of foreign exchange trading in different countries. The United Kingdom and the United States account for more than half of the total world trading. The United Kingdom has long been the leader in foreign exchange trading. In 2016, it accounted for just over 37% of total world trading volume. While it is true that foreign exchange trading is a round-the-clock business, with trading taking place somewhere in the world at any point in time, the peak activity occurs during business hours in London, New York, and Tokyo.
Table 1.2
Top ten foreign exchange markets by trading volume
| Country | Total volume (billions of dollars) | Percent share |
| United Kingdom | 2426 | 37.1% |
| United States | 1272 | 19.4% |
| Singapore | 517 | 7.9% |
| Hong Kong | 437 | 6.7% |
| Japan | 399 | 6.1% |
| France | 181 | 2.8% |
| Switzerland | 156 | 2.4% |
| Australia | 135 | 2.1% |
| Germany | 116 | 1.8% |
| Bulgaria | 86 | 1.3% |
Source: Bank for International Settlements, Triennial Central Bank Survey, September 2016.
Fig. 1.3 provides another view of the 24-hour nature of the foreign exchange market. This figure shows the average number of quotes on the Japanese yen/US dollar posted to the Reuters foreign exchange network. Fig. 1.3 reports the hourly average number of quotes over the business week. Weekends are excluded since there is little trading outside of normal business hours. The vertical axis measures the average number of quotes per hour, and the horizontal axis shows the hours of each weekday measured in GMT. A clear pattern emerges in the figure—every business day tends to look the same. Trading in the yen starts each business day in Asian markets with a little more than 20 quotes per hour being entered. Quoting activity rises and falls through the Asian morning until reaching a daily low at lunchtime in Tokyo (0230–0330 GMT).

The lull in trading during the Tokyo lunch hour was initially the result of a Japanese regulation prohibiting trading during this time. Since December 22, 1994, trading has been permitted in Tokyo during lunchtime, but there still is a pronounced drop in activity because many traders take a lunch break. Following the Tokyo lunch break, market activity picks up in the Asian afternoon and rises substantially as European trading begins around 0700 GMT. There is another decrease in trading activity associated with lunchtime in Europe, 1200–1300 GMT. Trading rises again when North American trading begins, around 1300 GMT, and hits a daily peak when London and New York trading overlap. Trading drops substantially with the close of European trading, and then rises again with the opening of Asian trading the next day.
Note that every weekday has this same pattern, as the pace of the activity in the foreign exchange market follows the opening and closing of business hours around the world. While it is true that the foreign exchange market is a 24-hour market with continuous trading possible, the amount of trading follows predictable patterns. This is not to say that there are not days that differ substantially from this average daily number of quotes. If some surprising event occurs that stimulates trading, some days may have a much different pattern. Later in the text we consider the determinants of exchange rates and study what sorts of news would be especially relevant to the foreign exchange market.
Spot Exchange Rates
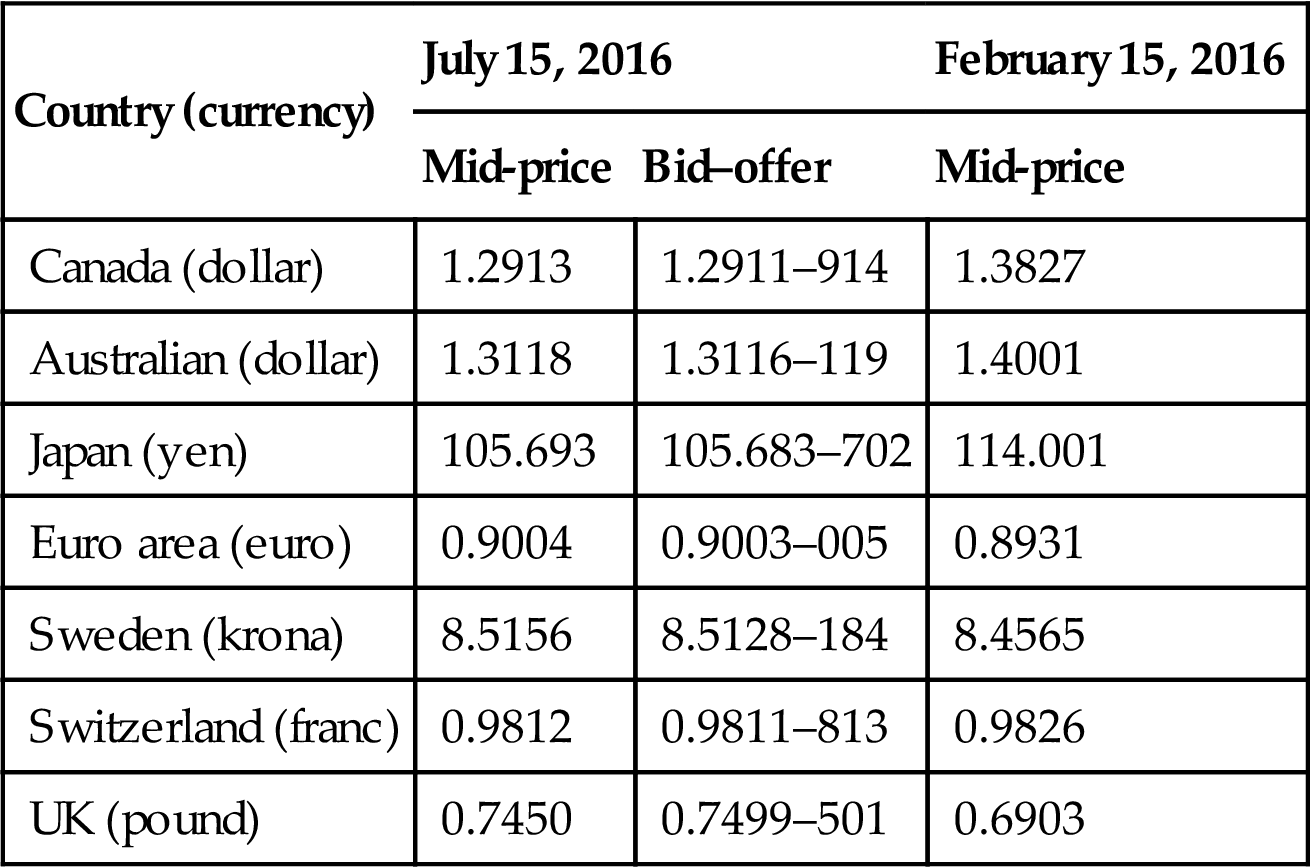
A spot exchange rate is the price of one money in terms of another that is delivered today. Table 1.3 shows selected spot foreign exchange rate quotations for a particular day. All rates are in foreign currency per dollar terms. For example, in the table we see that on July 15, 2016, the US dollar traded for 0.9812 Swiss francs. Note that this exchange rate is quoted at a specific time, since rates will change throughout the day as supply and demand for the currencies change, and involves amounts traded that are greater than $1 million. If the amount was smaller than $1 million the cost of foreign exchange would be higher. The smaller the quantity of foreign exchange purchased, the higher the price. Therefore if you travel to a foreign country the exchange rate will be much less favorable for you as a tourist.
Table 1.3
Selected spot currency exchange rates
| Country (currency) | July 15, 2016 | February 15, 2016 | |
| Mid-price | Bid–offer | Mid-price | |
| Canada (dollar) | 1.2913 | 1.2911–914 | 1.3827 |
| Australian (dollar) | 1.3118 | 1.3116–119 | 1.4001 |
| Japan (yen) | 105.693 | 105.683–702 | 114.001 |
| Euro area (euro) | 0.9004 | 0.9003–005 | 0.8931 |
| Sweden (krona) | 8.5156 | 8.5128–184 | 8.4565 |
| Switzerland (franc) | 0.9812 | 0.9811–813 | 0.9826 |
| UK (pound) | 0.7450 | 0.7499–501 | 0.6903 |
Source: Oanda.com.
While the exchange rate just discussed is the Swiss franc price of the US dollar, we can always convert this into a US dollar price of the Swiss franc by taking the reciprocal of the exchange rate, or 1/exchange rate, For instance, the exchange rate of 0.9812 Swiss francs per dollar is converted into dollars per Swiss franc by calculating the reciprocal: 1/0.9812=1.019. It will always be true that when we know the Swiss franc price per dollar (SF/$), we can find the dollar price per Swiss franc by taking the reciprocal 1/(SF/$)=($/SF).
Note that the exchange rate quotes in the first column in Table 1.3 are mid-price rates. For convenience we often talk about the spot rate as if it is one rate. Often this rate is the mid-price rate. However, the spot rate always involves two rates. Banks bid (buy) foreign exchange at lower rates than they offer (sell), and the difference between the selling and buying rates is called the spread. The mid-price is the average of the buying and selling rates. Table 1.3 lists the spreads for the currencies in the second column. The bid/offer prices is quoted so that one can see the bid (buy) price, and one can find the offer (sell) price by dropping the last three digits of the buy quote and replacing them with the second number. For example, the Swiss franc bid–offer price is 0.9811–813. Thus, the bank is willing to buy dollars for Swiss francs at 0.9811, and sell dollars at 0.9813 Swiss francs. The spread (the bank’s profit) between the buy and sell rates is very small. The spread for the Swiss franc can be measured in percentage terms as the (ask-bid)/mid-price. Using the information in Table 1.3, we can compute the spread in percentage terms as [(0.9813-0.9811)/0.9812=0.0002], or 2/100 of 1%. This spread is indicative of how small the normal spread is in the market for major traded currencies. The existing spread in any currency will vary according to the individual currency trader, the currency being traded, and the trading bank’s overall view of conditions in the foreign exchange market. The spread quoted will tend to increase for more thinly traded currencies (i.e., currencies that do not generate a large volume of trading) or when the bank perceives that the risks associated with trading in a currency at a particular time are rising.
Let us look at an example of using the buy and sell rates. If you were a US importer buying watches from Switzerland at the dollar price of $10 million, a bank would sell $10 million worth of Swiss francs to you for 0.9811 Swiss francs per dollar. Note that Table 1.3 shows what banks are willing to bid and offer when buying or selling dollars for Swiss franc. We want to sell our dollars for Swiss franc so we need to use the bid rate for the bank in Table 1.3. You would receive SF9,811,000 to settle the account with the Swiss exporter.
$10,000,000*0.9811 SF/$=SF9,811,000
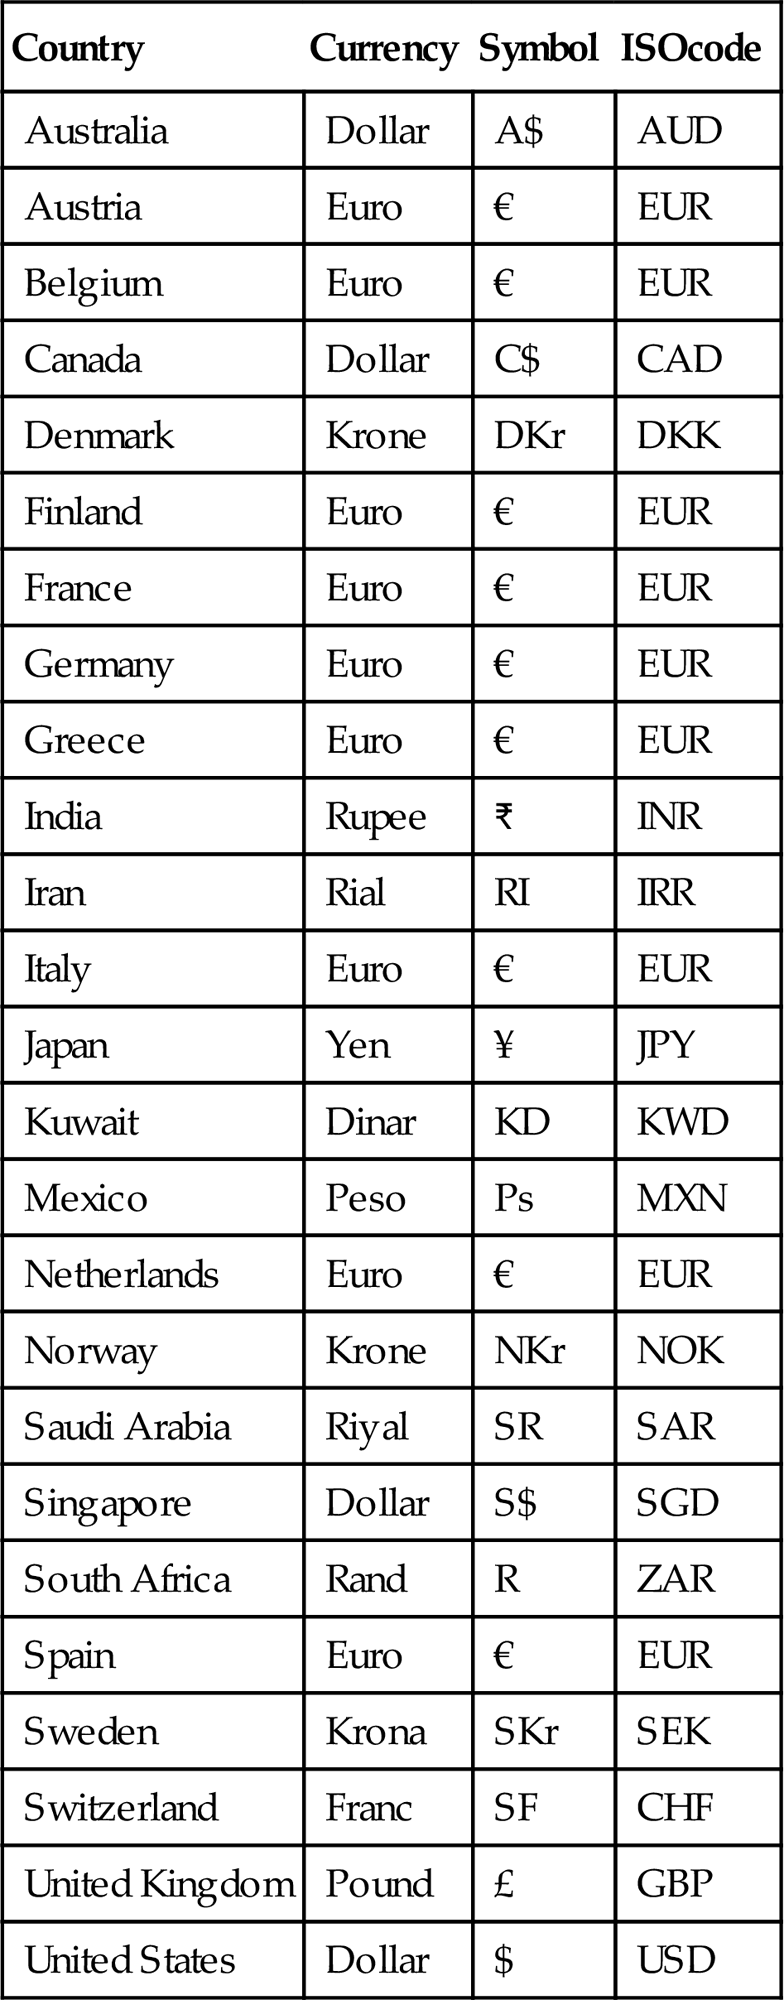
Thus far, we have discussed trading Swiss francs and Canadian dollars using the symbols SF and C$, respectively. Table 1.4 lists the commonly used symbols for several currencies along with their international standard (ISO) code. Exchange rate quotations are generally available for all countries where currencies may be freely traded. In the cases where free markets are not permitted, the state typically conducts all foreign exchange trading at an official exchange rate, regardless of current market conditions.
Table 1.4
International currency symbols
| Country | Currency | Symbol | ISOcode |
| Australia | Dollar | A$ | AUD |
| Austria | Euro | € | EUR |
| Belgium | Euro | € | EUR |
| Canada | Dollar | C$ | CAD |
| Denmark | Krone | DKr | DKK |
| Finland | Euro | € | EUR |
| France | Euro | € | EUR |
| Germany | Euro | € | EUR |
| Greece | Euro | € | EUR |
| India | Rupee | INR | |
| Iran | Rial | RI | IRR |
| Italy | Euro | € | EUR |
| Japan | Yen | ¥ | JPY |
| Kuwait | Dinar | KD | KWD |
| Mexico | Peso | Ps | MXN |
| Netherlands | Euro | € | EUR |
| Norway | Krone | NKr | NOK |
| Saudi Arabia | Riyal | SR | SAR |
| Singapore | Dollar | S$ | SGD |
| South Africa | Rand | R | ZAR |
| Spain | Euro | € | EUR |
| Sweden | Krona | SKr | SEK |
| Switzerland | Franc | SF | CHF |
| United Kingdom | Pound | £ | GBP |
| United States | Dollar | $ | USD |
This chapter discusses the buying and selling of foreign exchange to be delivered on the spot (actually, deposits traded in the foreign exchange market generally take two working days to clear); this is called the spot market. In Table 1.3 the first column shows the spot market on July 15, 2016, whereas the last column shows what the spot market looked like 6 months prior on February 15, 2016. Comparing the quotes in the two spot markets we can see what has happened to the exchange rate in this 6-month period. If the exchange rate increases in value we say that the currency appreciated. If the currency falls in value then the currency depreciated. For example, the yen/dollar rate fell from 114.001 to 105.693. The dollar depreciated against the yen, because the value of a dollar decreased in terms of yen. Because of the reciprocal nature of exchange rates, a depreciating dollar means that the yen appreciated against the dollar. In contrast, we can see that the UK pound depreciated against the US dollar. In fact, the UK pound depreciated by almost 8%, a substantial fall for such a short period.
In Chapter 4, Forward-Looking Market Instruments, we will consider the important issues that arise when the trade contract involves payment at a future date. First, however, we should consider in more detail the nature of the foreign exchange market.
Currency Arbitrage
The foreign exchange market is a market where price information is readily available by telephone or computer network. Since currencies are homogeneous goods (a dollar is a dollar regardless of where it is traded), it is very easy to compare prices in different markets. Exchange rates tend to be equal worldwide. If this were not so, there would be profit opportunities for simultaneously buying a currency in one market while selling it in another. This activity, known as arbitrage, would raise the exchange rate in the market where it is too low, because this is the market in which you would buy, and the increased demand for the currency would result in a higher price. The market where the exchange rate is too high is one in which you sell, and this increased selling activity would result in a lower price. Arbitrage would continue until the exchange rates in different locales are so close that it is not worth the costs incurred to do any further buying and selling. When this situation occurs, we say that the rates are “transaction costs close.” Any remaining deviation between exchange rates will not cover the costs of additional arbitrage transactions, so the arbitrage activity ends.
For instance, suppose the following quotes were available for the Swiss franc/US dollar rate:
This means that Citibank will buy dollars for 0.8745 francs and will sell dollars for 0.8755 francs. Deutsche Bank will buy dollars for 0.8725 francs and will sell dollars for 0.8735 francs. This presents an arbitrage opportunity. We call this a two-point arbitrage as it involves two currencies. We could buy $10 million at Deutsche Bank’s offer price of 0.8735 and simultaneously sell $10 million to Citibank at their bid price of 0.8745 francs. This would earn a profit of SF0.0010 per dollar traded, or SF10,000 would be the total arbitrage profit.
If such a profit opportunity existed the arbitrage would result in changes in the banks changing the rates as arbitrageurs enter the market. An increase in the demand to buy dollars from Deutsche Bank would cause them to raise their offer price above 0.8735, while the increased willingness to sell dollars to Citibank at their bid price of 0.8745 francs would cause them to lower their bid. In this way, arbitrage activity pushes the prices of different traders to levels where no arbitrage profits can be earned. Suppose the prices moved to where Citibank is quoting the Swiss franc/dollar exchange rate at 0.8740–50 and Deutsche Bank is quoting 0.8730–40. Now there is no arbitrage profit possible. The offer price at Deutsche Bank of 0.8740 is equal to the bid price at Citibank. The difference between the bid and offer prices of each bank is equal to the spreads of SF0.001. In the wholesale banking foreign exchange market, the bid–offer spread is the only transaction cost. When the quotes of two different banks differ by no more than the spread being quoted in the market by these banks, there is no arbitrage opportunity.
Arbitrage could involve more than two currencies. Since banks quote foreign exchange rates with respect to the dollar, one can use the dollar value of two currencies to calculate the cross rate between the two currencies. The cross rate is the implied exchange rate from the two actual quotes. For instance, if we know the dollar price of pounds ($/£) and the dollar price of Swiss francs ($/SF), we can infer what the corresponding pound price of francs (£/SF) would be. From now on we will explicitly write the units of our exchange rates to avoid the confusion that can easily arise. For example, $/£=$1.76 is the exchange rate in terms of dollars per pound.
Suppose that in London $/£=$1.76, while in New York $/SF=$1.10. The corresponding cross rate is the £/SF rate. Simple algebra shows that if $/£=$1.76 and $/SF=1.1, then £/SF=($/SF)/($/£), or 1.10/1.76=0.625. If we observe a market where one of the three exchange rates—$/£, $/SF, £/SF—is out of line with the other two, there is an arbitrage opportunity, in this case a triangular arbitrage. Triangular arbitrage, or three-point arbitrage, involves three currencies.
To simplify the analysis of arbitrage involving three currencies, let us ignore the bid–offer spread and assume that we can either buy or sell at one price. Suppose that in Geneva, Switzerland the exchange rate is £/SF=0.625, while in New York $/SF=1.100, and in London $/£=$1.600, as shown in Table 1.5. Examining Table 1.5 it appears to have no possible arbitrage opportunity, but astute traders in the foreign exchange market would observe a discrepancy when they check the cross rates. Computing the implicit cross rate for New York, the arbitrageur finds the implicit cross rate to be £/SF=($/SF)/($/£), or 1.100/1.600=0.6875. Thus the cost of SF is high in New York, and the cost of £ is low.
Table 1.5
| Location | $/SF | $/£ | £/SF |
| New York | 1.100 | 1.600 | – |
| London | – | 1.600 | 0.625 |
| Geneva | 1.100 | – | 0.625 |
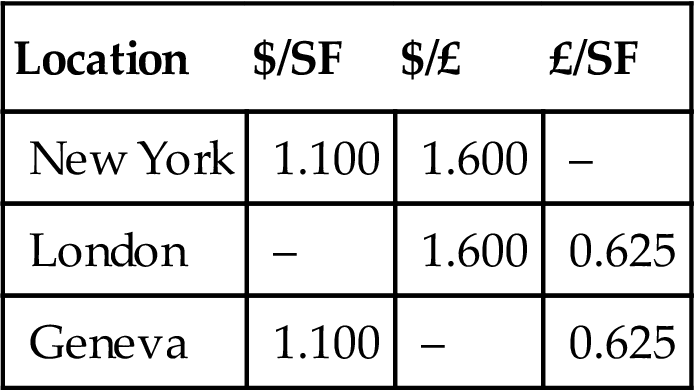
Assume that a trader starts in New York with 1 million dollars. The trader should buy £ in New York. Selling $1 million in New York (or London) the trader receives £625,000 ($1 million divided by $/£=$1.60). The pounds then are used to buy Swiss francs at £/SF=0.625 (in either London or Geneva), so that £625,000=SF1 million. The SF1 million would be used in New York to buy dollars at $/SF=$1.10, so that SF1 million=$1,100,000. Thus the initial $1 million could be turned into $1,100,000, with the triangular arbitrage action earning the trader $100,000 (costs associated with the transaction should be deducted to arrive at the true arbitrage profit).
As in the case of the two-currency arbitrage covered earlier, a valuable product of this arbitrage activity is the return of the exchange rates to internationally consistent levels. If the initial discrepancy was that the dollar price of pounds was too low in London, the selling of dollars for pounds in London by the arbitrageurs will make pounds more expensive, raising the price from $/£=$1.60. Note that if the pound cost increases to $/£=$1.76 then there is no arbitrage possible. However, the pound exchange rate is unlikely to increase that much because the activity in the other markets would tend to raise the pound price of francs and lower the dollar price of francs, so that a dollar price of pounds somewhere between $1.60 and $1.76 would be the new equilibrium among the three currencies.
Since there is active trading between the dollar and other currencies, we can look to any two exchange rates involving dollars to infer the cross rates. So even if there is limited direct trading between, for instance, Mexican pesos and yen, by using pesos/$ and $/¥, we can find the implied pesos/¥ rate. Since transaction costs are higher for lightly traded currencies, the depth of foreign exchange trading that involves dollars often makes it cheaper to go through dollars to get from some currency X to another currency Y when X and Y are not widely traded. Thus, if a business firm in small country X wants to buy currency Y to pay for merchandise imports from small country Y, it may well be cheaper to sell X for dollars and then use dollars to buy Y rather than try to trade currency X for currency Y directly.
Short-Term Foreign Exchange Rate Movements
Understanding the “market microstructure” allows us to explain the evolution of the foreign exchange market in an intradaily sense, in which foreign exchange traders adjust their bid and offer quotes throughout the business day.
A foreign exchange trader may be motivated to alter his or her exchange rate quotes in response to changes in his or her position with respect to orders to buy and sell a currency. For instance, suppose Helmut Smith is a foreign exchange trader at Deutsche Bank, who specializes in the dollar/euro market. The bank management controls risks associated with foreign currency trading by limiting the extent to which traders can take a position that would expose the bank to potential loss from unexpected changes in exchange rates. If Smith has agreed to buy more euros than he has agreed to sell, he has a long position in the euro and will profit from euro appreciation and lose from euro depreciation. If Smith has agreed to sell more euros than he has agreed to buy, he has a short position in the euro and will profit from euro depreciation and lose from euro appreciation. His position at any point in time may be called his inventory. One reason traders adjust their quotes is in response to inventory changes. At the end of the day most traders balance their position and are said to go home “flat.” This means that their orders to buy a currency are just equal to their orders to sell. Thus, the profit the bank receives is from trading activity, not from speculative activity.
Let us look at an example. Suppose Helmut Smith has been buying and selling euros for dollars throughout the day. By early afternoon his position is as follows:
In order to balance his position, Smith will adjust his quotes to encourage fewer dollar purchases and more dollar sales. For instance, if the euro is currently trading at $1.4650–60, then Helmut could raise the bid and offer quotes to encourage others to sell him euros in exchange for his dollars, while deterring others from buying more euros from him. For instance, if he changes the quote to 1.4655–65, then someone could sell him euros (or buy his dollars) for $1.4655 per euro. Since he has raised the dollar price of a euro, he will receive more interest from people wanting to sell him euros in exchange for his dollars. When Helmut buys euros from other traders, he is selling them dollars, and this helps to balance his inventory and reduce his long position in the dollar. At the same time Helmut has raised the sell rate of euros to $1.4665. This discourages other traders from buying more euros from Helmut (giving him dollars as payments).
This inventory control effect on exchange rates can explain why traders may alter their quotes in the absence of any news about exchange rate fundamentals.
In addition to the inventory control effect, there is also an asymmetric information effect, which causes exchange rates to change due to traders’ fears that they are quoting prices to someone who knows more about current market conditions than they do. Even without news regarding the fundamentals, information is being transmitted from one trader to another through the act of trading. If Helmut posts a quote of 1.0250–260 and is called by Ingrid Schultz at Citibank asking to buy $5 million of euros at Helmut’s offer price of 1.0260, Helmut then must wonder whether Ingrid knows something he doesn’t. Should Ingrid’s order to trade at Helmut’s price be considered a signal that Helmut’s price is too low? What superior information could Ingrid have? Every bank receives orders from nonbank customers to buy and sell currency. Perhaps Ingrid knows that her bank has just received a large order from Daimler Benz to sell dollars, and she is selling dollars (and buying euros) in advance of the price increase that will be caused by this nonbank order being filled by purchasing euros from other traders.
Helmut does not know why Ingrid is buying euros at his offer price, but he protects himself from further euro sales to someone who may be better informed than he is by raising his offer price. The bid price may be left unchanged because the order was to buy his euros; in such a case the spread increases, with the higher offer price due to the possibility of trading with a better-informed counterparty who wants him to sell euros.
The inventory control and asymmetric information effects can help explain why exchange rates change throughout the day, even in the absence of news regarding the fundamental determinants of exchange rates. The act of trading generates price changes among risk-averse traders who seek to manage their inventory positions to limit their exposure to surprising exchange rate changes and limit the potential loss from trading with better-informed individuals.
Long-Term Foreign Exchange Movements
Thus far we have examined short-run movements in exchange rates. For the most part we are interested in long-term movements in this book. Since the exchange rate is the price of one money in terms of another, changes in exchange rates affect the prices of goods and services traded internationally. Therefore most of this book is concerned with why exchange rates move and how we can avoid these effects. In this section we will introduce a simple but powerful tool, called the trade flow model. The trade flow model argues that the exchange rate responds to the demand for traded goods by countries.
We can use a familiar diagram from principles of economics courses—the supply and demand diagram. Fig. 1.4 illustrates the market for the yen/dollar exchange rate. Think of the demand for dollars as coming from the Japanese demand for US goods (they must buy dollars in order to purchase US goods). The downward-sloping demand curve illustrates that the higher the yen price of the dollar, the more expensive US goods are to Japanese buyers, so the smaller the quantity of dollars demanded. The supply curve is the supply of dollars to the yen/dollar market and comes from US buyers of Japanese goods (in order to obtain Japanese products, US importers have to supply dollars to obtain yen). The upward-sloping supply curve indicates that as US residents receive more yen per dollar, they will buy more from Japan and will supply a larger quantity of dollars to the market.

The initial equilibrium exchange rate is at point A, where the exchange rate is 90 yen per dollar. Now suppose there is an increase in Japanese demand for US products. This increases the demand for dollars so that the demand curve shifts from D1 to D2. The equilibrium exchange rate will now change to 100 yen per dollar at point B as the dollar appreciates in value against the yen. This dollar appreciation makes Japanese goods cheaper to US buyers.
In the above example the demand for US dollars changed. The supply may also change. Such an example is illustrated in Fig. 1.5. Assume that the US starts at point B with a 100 yen/$ exchange rate. If US consumers start liking Japanese products more than before, this will result in a supply curve shift. US importers will be more eager to give up their dollars in exchange for yen. This shifts the supply curve out to the right, from S1 to S2, and lowers the value of the dollar. The new equilibrium is at point C, where the yen/dollar rate is at 85.
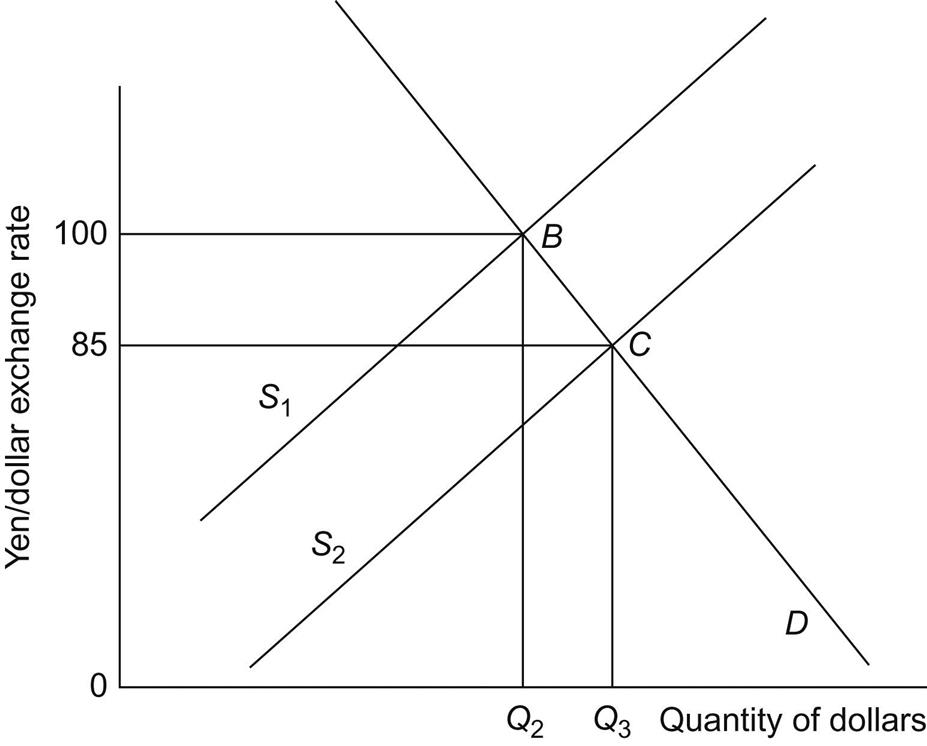
The examples above illustrate that the trade flow model can be a useful model to show the exchange rate changes in response to changes in demand for products in two countries. In the next chapter we will expand the trade flow model by adding central bank intervention. Later in the text we will examine other models that can explain exchange rate movements.
Summary
1. The foreign exchange market is a global market where foreign currency deposits are traded. Trading in actual currency notes is generally limited to tourism or illegal activities.
2. The dollar/euro currency pair dominates foreign exchange trading volume, and the United Kingdom is the largest trading location.
3. A spot exchange rate is the price of a currency in terms of another currency for current delivery. Banks buy (bid) foreign exchange at a lower rate than they sell (offer), and the difference between the selling and buying rates is called the spread.
4. Arbitrage realizes riskless profit from market disequilibrium by buying a currency in one market and selling it in another. Arbitrage ensures that exchange rates are transaction costs close in all markets.
5. The factors that explain why exchange rates vary so much in the short run are inventory control and asymmetric information.
6. In the long run, economic factors (e.g., demand/supply of foreign and domestic goods) affect the exchange rate movements. The trade flow model is useful for discussing fundamental changes in the foreign exchange rate.
Exercises
1. Suppose Nomura Bank quotes the ¥/$ exchange rate as 110.30–.40. Assume you need ¥100,000. How much dollars do you need to pay Nomura Bank to buy ¥100,000. Explain.
2. Compute the cross rate for the following quotes.
a. Compute the C$/€ using the following C$/$=1.5613, $/€=1.0008
b. Compute the £/¥ using the following ¥/$=124.84, $/£=1.5720
c. Compute the SF/C$ using the following SF/$=1.4706, C$/$=1.5613
3. Suppose Citibank quotes the ¥/$ exchange rate as 110.30–.40 and Nomura Bank quotes 110.40–.50. Is there an arbitrage opportunity? If so, explain how you would profit from these quotes. If not, explain why not.
4. Suppose that the spot rates of the US dollar, British pound, and Swedish kronor are quoted in three locations as the following:
| $/£ | $/SKr | SKr/£ | |
| New York | 2.00 | 0.25 | – |
| London | 2.00 | – | 10.00 |
| Stockholm | – | 0.25 | 10.00 |

Is there an arbitrage opportunity? If so, explain how you, as a trader who has $1,000,000, would profit from these quotes. If not, explain why not.
5. Consider the market for Japanese yen using the trade flow model. What would happen to the value of the Japanese yen (dollar per yen) if Japanese people like American automobiles more than before? Explain graphically.
Appendix A Trade-Weighted Exchange Rate Indexes
Suppose we want to consider the value of a currency. One measure is the bilateral exchange rate—say, the yen value of the dollar. However, if we are interested in knowing how a currency is performing globally, we need a broader measure of the currency’s value against many other currencies. This is analogous to looking at a consumer price index to measure how prices in an economy are changing. We could look at the price of shoes or the price of a loaf of bread, but such single-good prices will not necessarily reflect the general inflationary situation—some prices may be rising while others are falling.
In the foreign exchange market it is common to see a currency rising in value against one foreign currency while it depreciates relative to another. As a result, exchange rate indexes are constructed to measure the average value of a currency relative to several other currencies. An exchange rate index is a weighted average of a currency’s value relative to other currencies, with the weights typically based on the importance of each currency to international trade. If we want to construct an exchange rate index for the United States, we would include the currencies of the countries that are the major trading partners of the United States.
If half of US trade was with Canada and the other half was with Mexico, then the percentage change in the trade-weighted dollar exchange rate index would be found by multiplying the percentage change in both the Canadian dollar/US dollar exchange rate and the Mexican peso/US dollar exchange rate by one-half and summing the result. Table A.1 lists two popular exchange rate indexes and their weighting schemes. The indexes listed are the Federal Reserve Board’s Major Currency Index, (TWEXMMTH) and the Broad Currency Index (TWEXBMTH).
Table A.1
Percentage weights used in 2016 for the major and broad exchange rate indexes
| Exchange rate index | ||
| Country | Major | Broad |
| Euro area | 38.9 | 16.6 |
| Canada | 29.7 | 12.7 |
| Japan | 15.2 | 6.5 |
| United Kingdom | 7.7 | 3.3 |
| Switzerland | 4.0 | 1.7 |
| Australia | 2.8 | 1.2 |
| Sweden | 1.6 | 0.7 |
| Mexico | 12.1 | |
| China | 21.6 | |
| Taiwan | 2.4 | |
| Korea | 3.9 | |
| Singapore | 1.7 | |
| Hong Kong | 1.3 | |
| Malaysia | 1.5 | |
| Brazil | 2.1 | |
| Thailand | 1.4 | |
| Philippines | 0.6 | |
| Indonesia | 1.0 | |
| India | 2.0 | |
| Israel | 1.0 | |
| Saudi Arabia | 1.0 | |
| Russia | 1.4 | |
| Argentina | 0.6 | |
| Venezuela | 0.3 | |
| Chile | 0.8 | |
| Colombia | 0.7 | |
| Total | 100.0 | 100.0 |

Source: Board of Governors of the Federal Reserve System, Table H.10; Authors' calculation.
Since the different indexes are constructed using different currencies, should we expect them to tell a different story? It is entirely possible for a currency to be appreciating against some currencies while it depreciates against others. Therefore, the exchange rate indexes will not all move identically. Fig. A.1 plots the movement of the various indexes over time.

Fig. A.1 indicates that the value of the dollar generally rose in the early 1980s—a conclusion we draw regardless of the exchange rate index used. Differences arise in the 1990s where the dollar stayed fairly constant against the major currencies, but appreciated according to the broad currency index. In the 2000s both indexes again tell the same story, with both indexes showing a depreciating dollar, until 2015 when the dollar appreciates according both indexes.
Since different indexes assign a different importance to each foreign currency, the different movement of the dollar for the two indexes is not surprising. For instance, if we look at the weights in Table A.1, then a period in which the dollar appreciated rapidly against the Mexican peso relative to other currencies would result in the Major Currency Index to record a smaller dollar appreciation relative to the Broad Currency Index. This is because the peso accounts for 12.1 percent of the Broad Currency Index, but zero for the Major Currency Index.
Exchange rate indexes are commonly used analytical tools in international economics. When changes in the average value of a currency are important, bilateral exchange rates (between only two currencies) are unsatisfactory. Neither economic theory nor practice gives a clear indication of which exchange rate index is best. In fact, for some questions there is little to differentiate one index from another. In many cases, however, the best index to use will depend on the question addressed.
Appendix B The Top Foreign Exchange Dealers
Foreign exchange trading is dominated by large commercial banks with worldwide operations. The market is very competitive, since each bank tries to maintain its share of the corporate business. Euromoney magazine provides some interesting insights into this market by publishing periodic surveys of information supplied by the treasurers of the major multinational firms.
When asked to rank the factors that determined who got their foreign exchange business, the treasurers responded that the following factors were the most important: The speed with which a bank makes foreign exchange quotes was ranked third. A second-place ranking was given to competitiveness of quotes. The most important factor was the firm’s relationship with the bank. A bank that handles the other banking needs of a firm is also likely to receive its foreign exchange business.
The significance of competitive quotes is indicated by the fact that treasurers often contact more than one bank to get several quotes before placing a deal. Another implication is that the foreign exchange market will be dominated by big banks, because only the giants have the global activity to allow competitive quotes on a large number of currencies. Euromoney conducts an annual survey of major financial market participants to create a view of who does the most business. Table B.1 gives the rankings of the Euromoney survey. According to the rankings, Citi receives more business than any other bank. Note also that the big two—Citi and Deutsche Bank—dominate the foreign exchange market. The top ten banks are responsible for over ¾ of all foreign exchange trade in the world.
Table B.1
The top ten foreign exchange dealers by market share
| Rank | Bank | Market share |
| 1 | Citi | 16.1% |
| 2 | Deutsche Bank | 14.5% |
| 3 | Barclays | 8.1% |
| 4 | JPMorgan | 7.7% |
| 5 | UBS | 7.3% |
| 6 | Bank of America Merrill Lynch | 6.2% |
| 7 | HSBC | 5.4% |
| 8 | BNP Paribas | 3.7% |
| 9 | Goldman Sachs | 3.4% |
| 10 | RBS | 3.4% |
Source: Euromoney FX Survey–Global FX Market Share, May 2015.
What makes Citi the world’s best foreign exchange dealer? Many factors have kept them on top of the heap. An important factor is simply sheer size. Citi holds the bank accounts for many corporations, giving it a natural advantage in foreign exchange trading. Foreign exchange trading has emerged as an important center for bank profitability. Since each trade generates revenue for the bank, the volatile foreign exchange markets of recent years have often led to frenetic activity in the market with a commensurate revenue increase for the banks.