Chapter 13: Forecasting Slugging in Gas Lift Wells
Peter Kronberger Wintershall Dea Norge AS, Stavanger, Norway
Abstract
Digital transformation of existing processes using technologies such as big data, advanced data analytics, machine learning, automation, and cloud computing will enable continuous performance improvements within the operational sphere. The application of the technology will link the physical and digital world, providing a digital model of physical assets and processes. It will represent the evergreen, wholly integrated digital asset model-from reservoir to export pipeline.
Keywords
gas lift wells
forecasting
slugging
digital transformation
data analytics
machine learning
Digital transformation of existing processes using technologies such as big data, advanced data analytics, machine learning, automation, and cloud computing will enable continuous performance improvements within the operational sphere. The application of the technology will link the physical and digital world, providing a digital model of physical assets and processes. It will represent the evergreen, wholly integrated digital asset model-from reservoir to export pipeline.
The Brage operations team identified processes with the highest potential for digital transformations during an initial opportunity-framing workshop. Based on pain points and business needs clear emphasis is in the areas of production and well performance optimization, live-data implementation, and handling, as well as the entire flow of information from database integration up to dashboarding.
Strong reliance on an improved data infrastructure and IT/OT performance will require close cooperation with the IT/OT team. New solutions will be aligned with and integrated into already identified global solutions. The improved acquisition of data, together with the integration of already existing “Digital Twin” technologies will enable the first redesign of work processes. Prioritization of processes to be transformed will be mandated by their business impact as well as possibility to scale to other Wintershall Dea assets too.
Focus areas, such as slugging, digital production engineer, intelligent maintenance, dashboarding, and planning and scheduling were defined as more and more ideas evolved. Individual processes such as water injection and scaling surveillance were made more time-efficient and transparent. The vision is to bring all processes together into a customizable and collaborative dashboarding solution.
13.1. Introduction
The digital transformation is revolutionizing the oil and gas industry, together with the fast amount of data collected throughout the lifetime of the platform, it is now possible for production technology and operators to utilize this to lower operational expenditure and improve production efficiency.
The Brage field consists of four reservoirs, Fensfjord, Statfjord, Sognefjord, and Brent where in each of the mentioned reservoirs gas lifting is applied. Water breakthrough already happened a couple of years ago. Last year the Brage field celebrated its 25th anniversary, which means production optimization is key. Many parameters such as maximum water and gas lift capacity, slugging, sand production, and scaling issues show that it is not a straightforward process to do. That challenges are not something new and to better understand, solve and mitigate them digitalization is key.
The motivation to tackle the digitalization journey with Brage in a brown field environment is fueled by production increase due to even more efficient production operations, cost savings as possible predictive maintenance and automated processes can proactively mark possible failures and routine tasks can be done by the system. This, eventually, results in a more efficient way of working and ultimately in a lifetime extension of the platform.
Digitalization in brown versus green field environments, are two different challenges due to various reasons. In green field developments, one can design the system and data environment from the very beginning. Digitalization is a topic from the beginning and sensors, systems, and processes can be designed and set up accordingly.
In brown field environments, however, the challenge is a different one as the underlying systems are usually old and as the platform at its end of planned life. Often data systems need to first get exchanged or upgraded to have the basis for starting to implement digitalization processes. Another important aspect is the data availability and quality. In brown field environments a lot of data was collected of the lifetime of the platform, however, that often cannot be used, as the quality is too low. Moreover, data sensors might be missing, as they were not installed at the start of the platform.
What are the key benefits it will give to Brage? Is the underlying question for starting the digitalization journey?
- 1. To connect humans, devices, and systems across one entire value chain to have all information available in real-time whenever needed.
- 2. Turning data fast into better-informed decision do work more efficient and optimized to lower the operation costs, increase production, and increase the field lifetime.
- 3. Fostering partner and stakeholder management.
- 4. Improving HSEQ performance by faster and better diagnosing deficiencies and causalities to correct and reveres negative trends for more safely work.
13.2. Methodology
Starting with an internal ideation phase to map the pain points and possible work processes to improve in the daily working environment. In the next stage external providers assisted in structuring these findings and mapping the key areas by, for example, design thinking methodologies.
These key areas were then steadily refined and structured and business cases were created, where eventually five focus projects were defined based on their areas of impact and economic values.
This process, from the first get together and ideation phase until the definition of the business cases and mapping of the focus projects took several months, whereas some high value projects did already start earlier.
The approach was therefore driven by analysis of pain points and opportunities, rather than digitalizing the entire platform. Individual processes and their business cases were defined and selected. How would digital technologies change the way we work and create efficiencies or cost savings? Answering this question helped developing the current Brage Digital twin project portfolio, of which all address three steps of data process:
Data Liberation: Generally said, putting operational data into a data lake infrastructure, which is for a 25-year-old platform a complex, as hardware components need to be updated, yet very important step. The ultimate vision of that step is to have one single source of data, available for anyone at any time when needed.
Data Analytics: Once the data is available, the next step is to optimize and improve the processes and workflows by getting the most out of the data. Collaborations with different specialized vendors for applying advanced analytics that help us to operate more safely and efficiently were established.
Data Visualization: Insightful visualization of data is then the key for communicating these insights to the individual engineers and operators. Live dashboards will support in decision-making processes and notifications of unfavorable conditions. The focus is on customizability and collaboration. Often that is already the solution.
Digitalization and digitization are two different, yet sometimes exchanged expressions. Digitization is the process or task to make physical items, for example, a written letter, digital to make it for instance usable for processing on a PC. Digitalization is then the process to use digital technologies or digitized tasks to improve processes.
This is important to understand as the Brage Digital Twin project is a digitalization project, which therefore utilizes existing and proven technologies such as machine learning to improve and optimize the daily operational work to improve efficiency, increase production, and decrease costs.
After the ideation phase and structuring the ideas different topics were identified and explained in more detail, whereas a first estimation of business cases was estimated. The business cases were based production increase, more efficient work and therefore saved hours which could be used for other more important tasks rather than routines tasks and cost reduction. The first estimation was very rough and simply done to get an understanding of the magnitude comparability of the different topics. Over time those estimations got more and more matured and therefore refined in more detail.
The initiatives were ranked based on their estimated business cases and probability of success; however, it was and is still a living process and changes on the priority might be made based on new information and adjustments in business cases or resent findings in increasing the probability of success.
The project is mainly be executed in an agile project management manner. The scrum framework is applied as much as possible, which is explained in detail in Chapter 7 of this book.
13.3. Focus projects
The five focus projects selected are defined as the following:
- 1. Dashboarding Landscape: The key aspect within this idea lays on transparency and collaboration. To unbreak the chain of data silos and spreadsheet-based workflows.
- 2. Digital Production Engineer (DPE): The DPE consist of several sub-projects as Production Optimization, Injection Optimization, Scale Treatment Optimization, and Sand Choke Optimization.
- 3. Slugging: Due to its early kick off, importance, and high
- 4. Intelligent Maintenance
- 5. Planning/Scheduling
These projects and sub projects were assessed to have the highest impact with the highest probability of success. However, there is also a side project going on with regards to the already installed Narrowband technology on Brage. The goal of this project is to have a cheap and fast proof of concept for IoT technology for a more efficient cooler monitoring on the platform. Benefits of IoT sensors are amongst others its cheap prices and installation, long battery life, and easy maintenance.
13.3.1. Dashboarding landscape/architecture
Data visualization is a major aspect in spotting erroneous behavior and possibly prevents failures or costly interventions. Often data is not easily accessible, and it takes time to access and extract data for analysis. Transparency and accessibility of data is therefore an important topic.
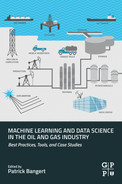
A specialized vendor called Eigen was selected for a dashboarding solution pilot (Fig. 13.1). For testing purposes, an Eigen Ingenuity framework was installed in the Azure cloud. This included a VPN link to the historian AspenTech IP.21, allowing process and production data to be displayed a manipulated in various ways.
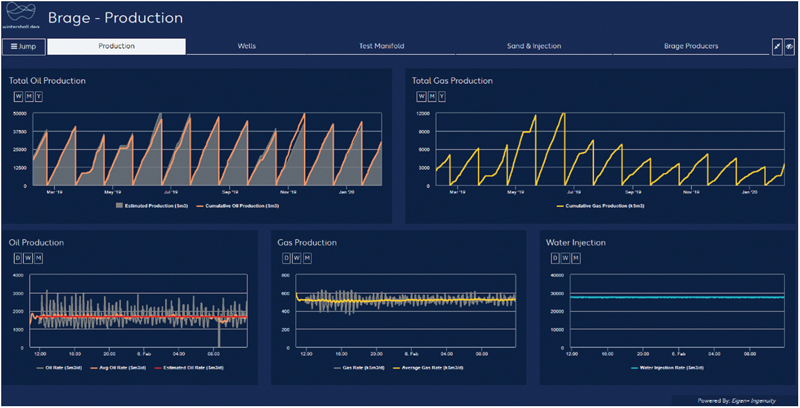
Figure 13.1 First implementation of production dashboard in pilot phase.
This stage took a lot of time as getting access to production data is a complex task due to various restrictions and security barriers. A clear reference on how to establish such a connection was not available as it was not done before.
After successfully setting up the live connection, the first tasks were defined for a 3 months testing period, this is important to test the functionality and integration of the solution in the daily operations. These task are (1) creating a new dashboard overview for more transparency and faster spotting unwanted behavior, (2) creating an overview and trends of all wells and parameters including analysis and notifications for engineers being on duty for an efficient follow up, (3) automating and improving the process and its underlaying tasks for creating the weekly production plan, and (4) automating the well rate allocation process to have live rates implemented in the Eigen dashboard environment.
The intent of the pilot project is to test the analytics, trending and dashboarding capability of the Eigen Ingenuity platform for your operations and optimize or re-define some of our work processes. The work focuses on the replacements of systems used in the technical engineering management and monitoring of the Brage field, more specifically the field’s production and injection wells.
13.3.2. Slugging
The life of an oil production well can often be very challenging and differs from well to well. Some wells are drilled and produce high oil rates from the beginning without any further operational issues; however, other wells start to have challenges from early on. These production challenges, such as slugging, stress the facilities to a point that production engineers are forced to operate the well intermitted or even shut in the well permanently, which will result in production losses in every case. Besides production losses slugs can damage the processing equipment and accelerate erosion effects, which result in higher failure rates and maintenance costs. This all together leads to significant economic losses.
Slugging can be induced by different underlying causes. The main types of slugs are severe, or riser induced slugs, which are caused by offshore pipeline rises, where liquid can accumulate at the bottom of the riser and block the gas flow. However, pressure will build up upstream the liquid accumulation and at some point, will push the liquid up. Another type is the pigging induced slug. A pig is a pipeline-cleaning device, which is send through the pipeline to clean possible precipitations. This device then creates a liquid slug. A third type is the hydrodynamic slugging, which is often caused in pipelines when liquid and gas flow at different speeds. The difference in speed can, at a certain point, cause flow instabilities-in a horizontal well-small waves in the liquid phase, which ultimately leads to a slug. Hydrodynamic slugging mostly, however, dependent on the phase rates and the topography, has a high frequency.
The fourth type, and for our use case the most interesting one, is terrain slugging. As the name says terrain slugging is induced by the topography of a pipeline or horizontal well. Often occurring in the late life of wells with long horizontal sections when the reservoir pressure has declined. Topographical differences can occur because of geo-steering, which might result in a water lag where liquids are likely to accumulate at a certain point in time. The force upstream coming from the produced gas is not high enough to push the liquid phase through the liquid lag further up the wellbore and fluids start accumulating. The gas phase builds up pressure and at some point it will be high enough to push through the water leg and pull the liquid as a slug along up the well until the hydrostatic pressure of the liquid is bigger than the gas pressure again, when the next volume of liquid starts accumulating in the leg.
Mitigating these kinds of slugs is particularly challenging as the trajectory of the well is given and sometimes, even if known it will cause challenges, cannot be changed due to geological and drilling reasons. Therefore, it is of up most importance for a production engineer to be prepared and equipped with mitigation tools.
Over the years a lot of data was collected from each individual well such as wellhead pressures and temperatures. Often it was not utilized for its full potential to optimize the production of each well. This big amount of data per well combined with data science knowledge can be used to predict and mitigate production issues. This is particularly interesting as some wells on the Brage field are struggling with slugging. Major production losses are due to slugging therefore wells often cannot even be put on production.
A slug flow is characteristic for oil wells during their tail end production, where a volume of liquid followed by a larger volume of gas causes intermitted liquid flow and therefore instabilities in the production behavior. These instabilities are undesirable as the consequences in the facilities can be severe: from insufficient separation of the fluids, increased flaring to tripping the whole field in the worst case. The intention of the slugging project has been to develop an algorithm, which can predict the state of the well some time in advance, identify a possible upcoming slug to have the possibility to intervene timely.
The first question to ask is how to model the slug flow physically. If there would be a physical model, which is tuned to the well it might be possible to optimize the flow. That approach exists with industry proven simulators. However, these purely physical models need constant tuning and adjustment. Moreover, slug frequencies are often very short, but a calculation cycle is performance intensive and takes time. Although the model might be well maintained, and the performance is good, the predictability is often mediocre.
Seeing the value that can be generated by mitigating slugging and guaranteeing stable flow makes the problem especially important to solve. Understanding the restrictions and downsides of a purely physical model approach, such as its tuning and maintenance time, the value of trying a data-driven approach became attractive.
A data driven approach must provide the key behaviors of needing low to no maintenance with a low uncertainty in predicting upcoming slugs and an even more important than a long and uncertain prediction horizon is an accurate optimization.
Besides the above-mentioned points physical restrictions also play a role, such as the reaction time and the acting speed of the choke. If a well would suffer from high frequency slugging, but the reaction time and closing speed of the choke is too slow, the best algorithm will not be able to help mitigating the slugging.
Concluding that it is important understand the technical feasibility of the slugging problem throughout the whole solution process, starting from the data. What data is available (which measurements) in which frequency and quality? Understanding the kind and characteristics of the slugging and the key parameters that is causing it. Investigate and understand the equipment restrictions, such as what is needed if an optimization technique is in place. Is the choke able to be automatically changed? Is it necessary to make modifications topside to get the solution running?
These questions need to be answered beforehand, as they are important milestones in the maturation process to not get unpleasant surprises in the end.
After understanding these unknowns, some key milestones and phases for the project where outlined:
- 1. Technical feasibility: Can a data-driven algorithm predict an upcoming slug at least a required amount of time so that the choke can be adjusted?
- 2. Is the algorithm reliable and trustworthy? Put the algorithm on a screen so that it creates visibility and trust. Visually show that the predictions are good. Try to manually adjust the choke as the optimization suggests and observe the reaction.
- 3. Operationalization: Starting to let the optimization algorithm control the choke first for a restricted amount of time and after a while more and more extent the time until the trained model is fully controlling the choking in order to mitigate the slugging.
A vendor with experience and expertise in data science and the oil and gas industry named algorithmica technologies was selected for a pilot project.
An important aspect already early in the phase was to get a proof of concept, whether it is possible to identify a slug, at least within the choke reaction time, to possibly interact proactively. Therefore, the project was divided into 4 main milestones. The first to answer the question of proof of concept to model the well state, the second to verify it is possible to indicate the slug proactively. The third phase is to manually test different choke settings. This step is important and necessary, as the algorithm needs to be trained on how to optimize the well to mitigate slugging automatically in the end. The fourth step, after verifying that the optimization would theoretically work, is a modification project to upgrade the choke actuators to have the possibility for a faster and automatic reaction.
To start with the proof of concept in time, a selected dataset was exported from the historian for one slugging well. However, in that process it was realized that it is of upmost importance to start as early as possible finding a solution for an IT environment so that a possible solution can run real-time. Questions such as will the trained model run as an application in the environment of the company and how will that look like, or will the real-time data stream transferred to algorithmica technologies and the calculations will take place there? The decision was made that these questions will be answered as soon as the proof of concept is successful.
Two major pathways for modeling the well state were initiated:
- 1. Explicitly feeding a limited history into an unchanging model, for example, multi-layer perceptron; however, it is (1) difficult to determine the length of this limited history and other parameters and (2) this model results in lower performance

- 2. Feeding the current state to a model with internal memory that retains a processed version of the entire past, for example, LSTM (Long Short-Term Memory). Characteristics of this approach are (1) easier to parametrize and (2) better performance; however, the training time is longer

An LSTM ingests and forecasts not just one variable but multiple ones. For our purposes, all the quantities measured and indicated in Fig. 13.2 were provided, including the production choke setting. The model therefore forecasts the slugging behavior relative to the other variables. As the production choke setting is a variable under our influence, we may ask whether we can mitigate the upcoming slug by changing the choke. The model can answer this question.
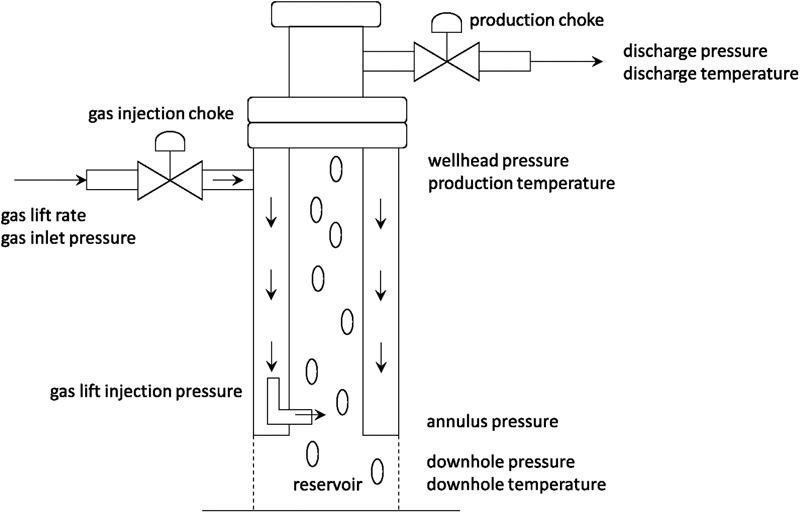
Figure 13.2 Schematic of a gas lift well.
An optimization algorithm is required to compute what change to the choke will accomplish in the best reaction of slugging and this is a guided trial and error calculation, which is why it is necessary to have a model that can be computed quickly in real-time. The method of simulated annealing was used because this is a general-purpose method that works very quickly, converges to the global optimum, requires little working memory, and easily incorporates even complex boundary conditions.
An LSTM network is composed of several nested LSTM cells, see Fig. 13.3. Each cell has two different kinds of parameters. Some parameters are model coefficients that are tuned using the reference dataset and remain constant thereafter. The other parameters are internal states that change over time as each new data point is presented for evaluation. These state parameters are the “memory” of the network. They capture and store the information contained in the observation made now, which will be useful in outputting the result at some later time. This is how the LSTM can forecast events in the future (Hochreiter and Schmidhuber, 1997).
Figure 13.3 Schematic of a LSTM network.
x, input signal; h, hidden signal; A, cell with steps in each cell to determine the state, forget and update functionalities. (Olah, 2015).
x, input signal; h, hidden signal; A, cell with steps in each cell to determine the state, forget and update functionalities. (Olah, 2015).
It was discovered that a forecast horizon of 300 minutes was achievable given the empirical data. This forecast has a Pearson correlation coefficient R2 of 0.95 with the empirical observation and so provides a forecast of acceptable accuracy. The next challenge was to define a slugging indicator so that the system can recognize a certain behavior as a slug.
Defining an indication of what a slug is for the system was a challenge on its own. The peaks of a slug as can be seen in Fig. 13.4 would be too late for a reaction for the choke. Therefore, as can be seen the indicator (orange | vertical lines) is going to 1 (representing a slug) before the peak and going back to zero (no slug).
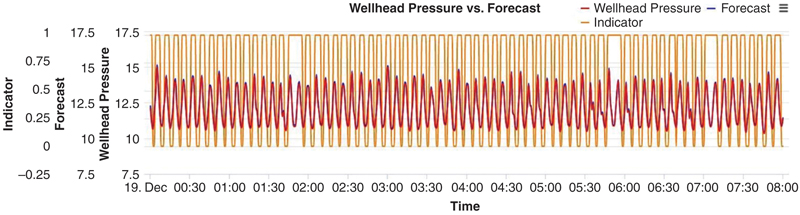
Figure 13.4 Comparison of observed WHP data with modelled data, almost on top of each other, including a defined slugging indicator (vertical lines).
These findings-being able to forecast the wellhead pressure changes of a well up to 300 minutes, which gives enough time for the choke to react and being able to isolate, meaning detecting slugs automatically.
Although these results seem very promising and positively surprising as up to 300 minutes is definitely enough to interact in some matter to mitigate a slug, the point is definitely “in some matter.” Forecasting the behavior of the well is one concept that needed to be proven, however, forecasting alone is fascinating to see, but does not give any added value, as the how to intervene is important. Should the wellhead choke be changed, if yes, how much? Or should the gaslift choke be changed? If yes, to which degree?
For the model to know how to mitigate the slugging optimally it needs data from when the variable parameters are changed-in this case the wellhead choke and possibly the gaslift choke. One might think that in the life of a well are certain times with different choke positions, however, as many wells are infill wells that is often is not the case. The wells are often long horizontal wells with a low reservoir pressure, as a result gas lift injection starts from the early life of the well with a fully opened wellhead choke. Training the data-driven model therefore required to produce variation in the data by choking the well. For this task, a program was designed and carried out offshore which captured all relevant ranges of combinations in an efficient way, as choking results in certain production losses.
After finishing the program, the data was extracted again and sent to algorithmica technologies for training the model to that newly gained data, which took several days. The results looked good and the data-driven model gave suggestions to optimize the well.
In the meantime, training the model to the newly gained choking data, the well became less and less economical and the decision was made to shut it in. So, on the one hand there was a trained and basically ready to implement data-driven model to mitigate slugging, but on the other hand it was decided to shut in the well as the production gain was far too low.
One of the big learnings was that timing is an important factor. It takes time to train a data-driven model and it takes even more time to fully implement such a solution, therefore the selected might not be within economical margins anymore.
It was decided to train the model again on anther well, as after the proof of concept, the confidence was in place that it would work on any other well too. The chosen well did not fully slug yet, but already showed some indications. Meaning that during normal production the well shows stable flow, however, if the well was shut in and then started up again it slugged for some time. This behavior made it the perfect candidate.
A direct connection between the data historian and algorithmica technologies was also set up in the meantime, which helped a lot to start training the new well optimally. The scope for this attempt was slightly adjusted. In addition to be able to mitigate slugging, it should be first used as a surveillance tool so that the model can give an alarm when the well might start slugging more heavily in before though stable conditions, as the slugging itself is not a great problem yet. It needs to be mentioned that experience shows that the selected wells are due to the formation they are producing from and shape of well trajectory very likely to start slugging at some point after startup as can be seen in Fig. 13.5.
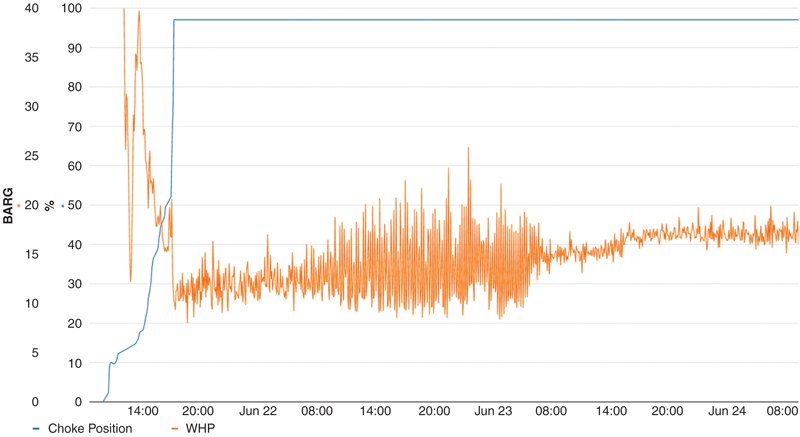
Figure 13.5 Second attempt to surveil a slugging prone well and get a notification if the slugging will become more severe.
After the gained confidence from of proofing the concept from the originally selected well, it was started to train the model to the new well with the adjusted scope. Interestingly, it seemed to take longer than before to train the model to that data, which might already give an indication of a higher complexity. That assumption was then verified after the model was trained. The forecasting horizon showed to be shorter than the one from the first well trained with 300 minutes. However, that turned out not to be an obstacle as it was still enough for the tasks of surveillance and possible mitigation later.
By now there are two well behaviors trained with a data driven model, and one also for optimization purposes including an offshore test. It can be said that forecasting the state of the well is possible with only having the historian available. The next step is to put the calculations in real-time, so that engineers can judge the forecasts compared to the actual behavior the well will then show. Assuming that this is successful it will trigger a new project to update the choke actuators on the wells suffering from slugging so that the model can automatically make changes. This last step is exciting, as a data-driven model will-on a long-term perspective-monitor and optimize a well autonomously. It might then reduce then on the one hand the amount of time an engineer needs to spend on such a problem well and on the other hand also increase the value of that well. Besides that, it might also reduce maintenance costs as the flow in the flowlines and into the separator is more stable and therefore induces less stress on the equipment.
The mitigation of slugging by automatically choking the well is not a trivial task and requires a throughout planning of the phases and milestones until a model will automatically optimize a well on stable flow. However, the proof of concept for two wells has shown that it is possible to forecast the well state and to get recommendations on optimal choking. Besides that, it needs to be mentioned that it was not yet tried in practice, which is still one major step to do. This might give also further insights as how stable the forecast is on changing the choke and therefore answering the question how it works in operations. Furthermore, field testing will also show on how precise the choking must be to get the wanted positive effect. What would happen for example if the choke reacts with a 5 minutes delay and slightly differently compared to the suggestion of the model? Will the output be the same or will the slugging even get worse? Generally, how sensitive or stable will be model and the suggestions be?
13.4. Data structure
A solid underlying data structure is key for a successful digital transformation. It is a complex process as different kind of information are saved in different databases and structures and security features on top make it a great challenge to build a solid data lake architecture.
As of this importance Wintershall Dea started its own company-wide project called data integration project with the goal of building a data lake infrastructure. As a result of the project there should be “one single source of data truth” to connect.
A possible outline of such an infrastructure was created for Brage (Fig. 13.6) where the Data Lake would be the center of information connected via the data explorer with the historian AspenTech IP.21 databases. Since January 2019, a narrowband infrastructure is available at Brage to install IoT sensors, that technology can be integrated by streaming data from an IoT hub into the system.
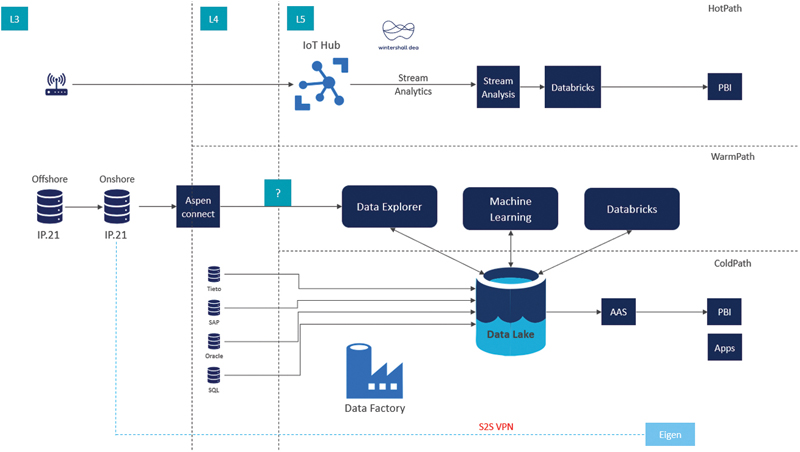
Figure 13.6 Outline of a possible data lake solution for Brage.
All data sources, currently saved in different databases such as SAP, Tieto or SQL can be pushed to the data lake where it can be accessed via different applications through one connection. Applications then can be selected based on their need and functionality as a service (AAS-application as a service), rather than its connectivity to different data sources.
As by today this infrastructure does not exist yet, as an example the pilot for the dashboarding solution is for the proof of concept phase currently directly connected to the historian database.
13.5. Outlook
Digitalization is a key aspect for the future to optimize processes and reduce costs by utilizing the available data combined with the right know how. In the short and mid-term, the importance lay with manifesting the solutions within the Brage operations to daily work will transform in being more efficient and effective. In a long-term perspective, it should be able to upscale solutions based on their needs to all business units in the Wintershall Dea environment.
13.6. Conclusion
This chapter showed the journey from the ideation phase until the first implementations of a digital transformation of a brownfield platform. It explained why it makes sense to digitalize a brownfield platform. The origin of many challenges was often culturally rather than technologically.
A consequential finding already in the ideation phase was that it is important that the external facilitator has great experience in the oil and gas industry with a deep understanding of the uniqueness of the business otherwise it was experience that the progress in identifying and developing ideas is slow and the engagement of people is less strong.
Creating an understanding of scrum and its benefits in product development and creating an understanding of ownership for the initiatives. A challenge was and still is in some cases to have product ownership.
Data availability, connectivity, liberation, and a clear data foundation is still a vision rather than reality. This, however, is a particularly important topic as it gives the foundation for all following analysis and data science work. Currently data connects are established on request and often takes weeks or months. Data availability, not only process data, but also getting data out of software tools and in the right format is complex and often a bottleneck in executing digitalization initiatives.
Beside the described focus projects and the deeper dive into two of them, so called “low hanging fruits,” easy and quick implementations, often with a great time saving benefit where executed as side initiatives, such as the water injection surveillance. Previously the surveillance was performed with various spreadsheets; a quick MVP was designed and then implemented in the Eigen Ingenuity platform, which provides now a compact dashboard overview with automatic alarms if threshold values were exceeded. This implementation did not take more than three days of active work.
..................Content has been hidden....................
You can't read the all page of ebook, please click here login for view all page.