Chapter 5: Data Management from the DCS to the Historian
Jim Crompton Reflections Data Consulting, Colorado Springs, CO, United States
Abstract
The oil and gas industry produces great volumes of data on an ongoing basis. This data must be acquired, stored, curated, and made available properly for data science to be able to take place. This process starts at the sensor and continues via systems such as the control system and the historian. In this journey, information and operational technologies converge. Sensor data is acquired and transmitted through various systems to arrive at the control system, which then makes it available through various protocols for consumption by analysis software. Historians save the data and make it available to the human user as diagrams. Documents and simulation data can also be integrated into the picture. This complex landscape is discussed in this chapter.
Keywords
data management
oil and gas industry
sensor data
digital operations
simulation
automation
5.1. Introduction
Many operators in the oil and gas industry are increasingly looking to move toward a data-driven and technology-enabled way of working. Often this is called the Digital Oilfield 2.0. Although in principle, this may sound relatively straightforward, the reality is that things have become a lot more complicated since companies deployed their initial real-time information technology solutions. Organizations face many challenges of scale and performance, data quality, data silos, integration, and cybersecurity. There are also an increasing number of confusing and conflicting messages from within the industry as to how best to support digital operations in order to enable further automation and advanced “Big Data” predictive analysis.
Most companies are trying to see how the new “digital” approach fits and how techniques like machine learning, artificial intelligence, and advanced statistics can improve the performance of field operations and reservoir performance. It is not that modeling; simulation and automation projects are something new to the oilfield; the industry has been implementing these techniques and technologies for many years. What is different is that the Digital Oilfield 2.0 is more instrumented and more connected than ever before. With this degree of digitization, operators can develop data-driven models that combine physics, statistics, and best practice engineering principles in order to gain greater insight on what is going on in the field, and how they can improve performance of the total asset lifecycle.
Seismic acquisition, processing, and interpretation have been “Big Data” programs (at least lots-of-data programs) since the 1970s. The industry began the Digital Oilfield (i.e., integrated operations), smart field, integrated field, intelligent field, or whatever you want to call it, programs nearly 2 decades ago. The oil and gas industry has learned quite a bit about workflow optimization, remote decision support, and real-time operations. Some projects have gone well and created a lot of value. Others we do not talk about as much.
The barriers are usually not the technology. The wise advice is to think about people, process, and technology when starting a Digital Oilfield program. This chapter adds some much-needed consideration around the data foundation as well. The technology is the “bright shiny object” that gets too much attention. The trouble spots are often difficult access to relevant data, uncertain data quality (especially when used outside our infamous functional and asset silos), a resistant organizational culture that still values experience over new statistical models and often a lack of digital literacy within the organization. All of this is especially true when a company starts adding in data from sensors in the field and down the wellbore, to the volumes of data they have from transactional and engineering systems.
5.1.1. Convergence of OT and IT
This chapter is about data management. It starts with the oilfield instrumentation and control systems perspective from the ground up; which brings a new data type to traditional analytical projects. This area of Operations Technology, or OT, has developed independently from the Information Technology, or IT, world that companies are probably more familiar with. OT systems have largely been in the domain of electrical engineering, instrumentation, and control systems technology. Recently, this operations world is converging with consumer information technology, whereas previous proprietary systems have become more open. The desired learning outcome of this chapter is to better understand and be able to describe this convergence of OT and IT and understand the vocabulary used.
Why is this important? This convergence brings the physical world of instrumented equipment and meters into the digital world where predictive models can:
• Identify and monitor field performance
• Recognize key ways that the field system can failure
• Develop models to predict those failure points
• Build safe, secure, reliable, and performant systems to optimize all of the elements of the system to increase production, while lowering operating costs and minimizing the environmental footprint of the oilfield
Wearables and mobile devices connect the human operator to the process systems. Sensor measure physical behavior and actuators allow the human to control specific process steps. Data collection and aggregation bridge the gap to the Internet of Things (IoT), or edge computing devices, that bring the field data into the cloud where it can be sent anywhere, processed by large computing resources, remotely monitored, and modeled to create the digital twin of the physical field system.
The Digital Oilfield 1.0 was about installing more sensors on field equipment, increasing information intensity, and improving the surveillance of what was going on. The Digital Oilfield 2.0 is about connectivity and building predictive models to be able to respond, and predictively intervene in order to improve process results.
5.1.2. A maturity model for OT/IT convergence
One place one can go to see this convergence taking place is a modern control room. A visitor’s eyes will be drawn to all of the screens on the front wall of the operations room. All of the data captured from the field is visualized in a variety of different ways, and process alarms will alert operations staff when equipment or process behavior start to vary from normal conditions, allowing emergency situations to be managed with minimal impact.
These control rooms are getting to the state where they have too much data for the human to comfortably comprehend. So, behind the screen operators build predictive models (or AI assistants) that help the human operator understand all the big events, and even many of the small events that are going on in the field. When processes are well-known and appropriately instrumented, the control systems behind the screens can be set to automatic and the human is alerted only when necessary.
The convergence process is not happening overnight, the journey is taking several decades. One way to understand this convergence is through a maturity model. The following describes how OT and IT began to grow toward a common integrated perspective. One key observation is that the industry does not swap out its operations technology as often as you change your smart phone, or as quickly as agile development methods update software and websites. An engineer in the control room will probably come across facilities that are in each of the three phases. Dealing with legacy technology and infrastructures is a challenge that all petroleum data analytics professionals have to deal with. In one situation, the engineer has more data than they need, yet in another situation, they are lacking critical information and are uncertain of the data quality that they have on hand.
Generation One:
• Focus on keeping the plant running
• Simple Data Processing: Data In-Data Out to trending reports (Process Book)
• Plant operations centers are local
Generation Two:
• Data is Contextualized (Asset Framework and Asset Analytics)
• Custom workflows as fit-for-purpose solutions
• Remote decision support environments begin to lower manning levels
• Analytics and links to specialized advanced algorithms and modeling are beginning to be used
Generation Three:
• A Digital Twin concept is developed
• Predictive capabilities (process alarms and optimization, (event frame) emerge
• Autonomous (normally unmanned) operations complement field operations
The key message from the convergence of OT and IT is about building the bridge between the technology used in the field, to the processing power, and engineering expertise in the office. The technology is not the hard part of this convergence; it is the organization change and access to trusted data. The operations groups need to think beyond reacting to what is happening at this moment in the field, to planning and responding to a “manage-by-exception” mentality where field surveillance is combined with the predictive power of a digital twin model, and the algorithms that are developed from field data, and engineering and physics principles.
For their part, the IT group needs to expand their scope beyond the data center and the desktop environment at headquarters, to the field environment. The digital ecosystem now includes the world of sensors and control systems, of telecommunications all the way to the well head, the operations reliability, and security of a full lifecycle view of the system.
5.1.3. Digital Oilfield 2.0 headed to the edge
The Digital Oilfield 2.0 is now headed for the edge, edge computing that is. Advances are now allowing companies to place their intelligent algorithms in instrumentation and control systems. While the information intensity of the oilfield has grown by orders of magnitude over the last several decades, most of that data has been trapped in legacy SCADA and engineering systems or by limited communications solutions, and not available to build holistic asset lifecycle models. The twin dangers are that the previous generation of operators did not use or trust the data they had; and that the new digital generation may believe data-driven models too much, without a good understanding of the data that is driving these models.
Whether one is talking about predictive models for maintenance, or optimization, or full digital twins of their assets, understanding of data is still very important. How can an operator implement a “manage-by-exception” process when the data used in building the model behind the prediction engine is biased, or poor quality, missing key attributes, or is out of date? How can automation replace experienced workers when the rules and logic of the models are based upon flawed data?
Let’s take a deeper dive into the operational data world and find out just what an operator is dealing with before the data scientists start programming the robots to do the heavy lifting.
5.2. Sensor data
Sensor data is the output of a device that detects and responds to some type of input from the physical environment. The output may be used to provide information, or input, to another system or to guide a process. Sensors can be used to detect just about any physical element. Here are a few examples of sensors, just to give an idea of the number and diversity of their applications:
• An accelerometer detects changes in gravitational acceleration in a device it is installed in; such as a smart phone or a game controller, to determine acceleration, tilt, and vibration.
• A photosensor detects the presence of visible light, infrared transmission (IR) and/or ultraviolet (UV) energy.
• Lidar, a laser-based method of detection, range finding, and mapping; typically uses a low-power, eye-safe pulsing laser working in conjunction with a camera.
• A charge-coupled device (CCD) stores and displays the data for an image in such a way that each pixel is converted into an electrical charge, the intensity of which is related to a color in the color spectrum.
• Smart grid sensors can provide real-time data about grid conditions, detecting outages, faults and load, and triggering alarms.
Wireless sensor networks combine specialized transducers with a communications infrastructure for monitoring and recording conditions at diverse locations. Commonly monitored parameters include: temperature, humidity, pressure, wind direction and speed, illumination intensity, vibration intensity, sound intensity, power-line voltage, chemical concentrations, pollutant levels, and vital body functions.
Sensor data is in integral component of the increasing reality of the Internet of Things (IoT) environment. In the IoT scenario, almost any entity imaginable can be outfitted with a unique identifier (UID) and the capacity to transfer data over a network. Much of the data transmitted is sensor data. The huge volume of data produced and transmitted from sensing devices can provide a lot of information but is often considered the next big data challenge for businesses. To deal with that challenge, sensor data analytics is a growing field of endeavor (Rouse et al., 2015).
According to Talend, a Big Data Software company, sensor data and sensor analytics are poised to become the next Big Thing in information technology; with experts predicting that the volume of sensor data will soon dwarf the amount of data that social media is currently producing. Gathered from cell phones, vehicles, appliances, buildings, meters, machinery, medical equipment, and many other machines; sensor data will likely completely transform the way organizations collect information and process business intelligence.
Working with sensor data is problematic for most organizations today. Most enterprises are not equipped to integrate data from such a wide range of sensor sources—their legacy integration technology simply is not up to the task. On top of infrastructure problems, few organizations have developers with the skills, like MapReduce programming, required to manipulate massive sets of sensor data, and training existing developers is extremely costly and time-consuming (Pearlman, 2019).
5.2.1. There are problems with data from sensors: data quality challenges
In today’s data-driven world, it has become essential for companies using IoT technologies to address the challenges posed by exploding sensor data volumes; however, the sheer scale of data being produced by tens of thousands of sensors on individual machines is outpacing the capabilities of most industrial companies to keep up.
According to a survey by McKinsey, companies are using a fraction of the sensor data they collect. For example, in one case, managers at a gas rig interviewed for the survey said they only used one percent of data generated by their ship’s 30,000 sensors when making decisions about maintenance planning. At the same time, McKinsey found serious capability gaps that could limit an enterprise’s IoT potential. In particular, many companies in the IoT space are struggling with data extraction, management, and analysis.
Timely, and accurate, data is critical to provide the right information at the right time for business operations to detect anomalies, make predictions, and learn from the past. Without good quality data, companies hurt their bottom line. Faulty operational data can have negative implications throughout a business, hurting performance on a range of activities from plant safety, to product quality, to order fulfillment. Bad data has also been responsible for major production and/or service disruptions in some industries (Moreno, 2017).
Sensor data quality issues have been a long-standing problem in many industries. For utilities who collect sensor data from electric, water, gas, and smart meters, the process for maintaining sensor data quality is called Validation, Estimation and Editing, or VEE. It is an approach that can be used as a model for other industries, as well when looking to ensure data quality from high volume, high velocity sensor data streams.
Today, business processes and operations are increasingly dependent on data from sensors, but the traditional approach of periodic sampling for inspecting data quality is no longer sufficient. Conditions can change so rapidly that anomalies and deviations may not be detected in time with traditional techniques.
Causes of bad sensor data quality include:
• Environmental conditions—vibration, temperature, pressure or moisture—that can impact the accuracy of measurements and operations of asset/ sensors.
• Misconfigurations, miscalibrations, or other types of malfunctions of asset/sensors.
• Different manufacturers and configurations of sensors deliver different measurements.
• Loss of connectivity interrupts the transmission of measurements for processing and analysis.
• Tampering of sensor/device and data in transit, leading to incorrect or missing measurements.
• Loss of accurate time measurement because of use of different clocks, for example.
• Out-of-order, or delayed, data capture and receipt.
5.2.2. Validation, estimation, and editing (VEE)
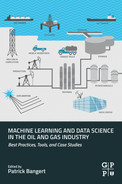
The goal of VEE is to detect and correct anomalies in data before it is used for processing, analysis, reporting, or decision-making. As sensor measurement frequencies increase, and are automated, VEE is expected to be performed on a real-time basis in order to support millions of sensor readings per second, from millions of sensors. Fig. 5.1 displays examples of real time data within the industry.
Figure 5.1What is real time data.(Crompton).
The challenge for companies seeking actionable operational and business knowledge from their large-scale sensor installations is that they are not able to keep up with the VEE processes needed to support data analytics systems because of the high volume and velocity of data. This is why so many companies today are using less than 10% of the sensor data they collect (Tomczak, 2019).
5.3. Time series data
A time series is a series of data points indexed, listed, or graphed in time order. Most commonly, a time series is a sequence taken at successive equally spaced points in time. Thus, it is a sequence of discrete-time data. Examples of time series are; heights of ocean tides, counts of sunspots, well head pressure and temperature readings, and the daily closing value of the Dow Jones Industrial Average.
Time series are very frequently plotted via line charts. As displayed in Fig. 5.2, they are used in statistics, signal processing, pattern recognition, econometrics, mathematical finance, weather forecasting, earthquake prediction, electroencephalography (heart monitoring), control engineering, astronomy, communications engineering, and largely in any domain of applied science and engineering which involves temporal measurements.
Time series analysis comprises methods for analyzing time series data in order to extract meaningful statistics and other characteristics of the data. Time series forecasting is the use of a model to predict future values based on previously observed values. While regression analysis is often employed in such a way as to test theories that the current values of one or more independent time series affect the current value of another time series, this type of analysis of time series is not called “time series analysis;” which focuses on comparing values of a single time series, or multiple dependent time series at different points in time. Interrupted time series analysis is the analysis of interventions on a single time series.
Time series data have a natural temporal ordering. This makes time series analysis distinct from cross-sectional studies in which there is no natural ordering of the observations (e.g., explaining people’s wages by reference to their respective education levels, where the individuals’ data could be entered in any order). Time series analysis is also distinct from spatial data analysis where the observations typically relate to geographical locations (i.e., a leasing or drilling program in a basin). A stochastic model for a time series will generally reflect the fact that observations close together in time will be more closely related than observations further apart. In addition, time series models will often make use of the natural one-way ordering of time so that values for a given period will be expressed as deriving in some way from past values, rather than from future values. Transactional data is recorded in a tabular format with values associated by columns in each row. Real-time data is recorded with only time context (i.e., value and timestamp) (Ullah et al., 2013).
Time series analysis can be applied to real-valued, continuous data, discrete numeric data, or discrete symbolic data (i.e., sequences of characters, such as letters and words in the English language). Methods for time series analysis may be divided into two classes: frequency-domain methods and time-domain methods. The former includes: spectral analysis and wavelet analysis; the latter include auto-correlation and cross-correlation analysis. In the time domain, correlation and analysis can be made in a filter-like manner using scaled correlation, thereby mitigating the need to operate in the frequency domain.
Additionally, time series analysis techniques may be divided into parametric and non-parametric methods. The parametric approaches assume that the underlying stationary stochastic process has a certain structure, which can be described using a small number of parameters (e.g., using an autoregressive or moving average model). In these approaches, the task is to estimate the parameters of the model that describes the stochastic process. By contrast, non-parametric approaches explicitly estimate the covariance or the spectrum of the process without assuming that the process has any particular structure. Methods of time series analysis may also be divided into linear and non-linear, and univariate and multivariate (Lin et al., 2003).
5.4. How sensor data is transmitted by field networks
The goal of all information technology implementations, regardless of industry, should be to improve productivity. The bottleneck for oilfield data flow until now has been the transfer of real-time data to the engineers’ desktop in an accurate, timely, and useful fashion. Engineers typically have seen only a subset of the field data available (i.e., daily production volumes and rates, along with a few gauge pressures and temperature settings). With databases updated only periodically from real-time historians, engineers have lacked sufficient insight into the dynamics of platform or field operations. What’s needed, “is an alarm system to inform engineers of under-performing or critical conditions of a well or reservoir,” before it begins to degrade production and the revenue stream. Oilfield operations need to move beyond the familiar data management mantra of the “right data to the right person at the right time” and adopt the 21st century goal of “validated data, to the decision maker, before the critical event,” (Piovesan and Jess, 2009).
As field automation moved from plants, where wired connections are possible, to the field, the evolution of radio transmission networks began. There are countless SCADA radio networks monitoring and controlling municipal water, waste-water, drainage, oil and gas production, power grids, automatic meter reading, and much more. These SCADA radio technology-based communications systems have ranges from yards, to hundreds of miles.
Selecting the right technology, defining the projects requirements, and creating a robust SCADA communications network is crucial. Having an understanding of the advantages and disadvantages of each technology can help the engineer, or operator, to make the best business decisions for a system that will have a ten to twenty-year service lifetime and are often mission critical or high importance SCADA systems.
5.4.1. From Plant to Field: Communications Protocols (HART, Fieldbus, OPC, OPC-UA and Wireless Hart)
Here are just a few examples of field, or plant, to office communications protocols.
The HART Communications Protocol (Highway Addressable Remote Transducer) is an early implementation of Fieldbus, a digital industrial automation protocol. Its most notable advantage is that it can communicate over legacy 4–20 mA analog instrumentation wiring, sharing the pair of wires used by the older system. An example of this protocol is shown in Fig. 5.3.
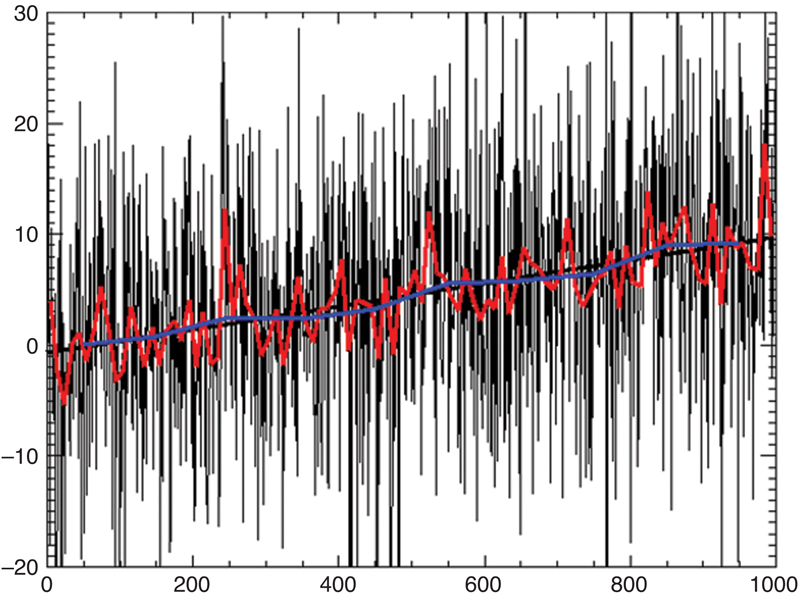
Fieldbus is the name of a family of industrial computer network protocols used for real-time distributed control, standardized as IEC 61158. A complex automated industrial system—such as manufacturing assembly line—usually needs a distributed control system—an organized hierarchy of controller systems—to function. In this hierarchy, there is usually a Human Machine Interface at the top, where an operator can monitor or operate the system. This is typically linked to a middle layer of programmable logic controllers via a non-time-critical communications system. At the bottom of the control chain is the fieldbus that links the PLCs to the components that actually do the work, such as; sensors, actuators, electric motors, console lights, switches, valves, and contactors.
Requirements of Fieldbus networks for process automation applications (i.e., flowmeters, pressure transmitters, and other measurement devices and control valves in industries such as hydrocarbon processing and power generation) are different from the requirements of Fieldbus networks found in discrete manufacturing applications and is shown in Fig. 5.4. Examples of implementation of these Fieldbus networks are; automotive manufacturing, where large numbers of discrete sensors are used including motion sensors, position sensors, and so on. Discrete Fieldbus networks are often referred to as “device networks,” (Anderson, 2009).
Figure 5.4Fieldbus architecture.(Crompton).
OPC (OLE for Process Control) was first defined by a number of players in automation together with Microsoft in 1995. Over the following ten years it became the most used versatile way to communicate in the automation layer in all types of industry. Over the years it has evolved from the start with simple Data access (DA), over Alarm and Events (AE), to the more advanced Historical Data Access (HDA) to have quite extensive functionality and reach. Though there were always some gaps where it did not cover the needs and requirements from the more advanced control systems, it was out of those needs for model-based data and getting more platform independent that resulted in the creation of the OPC UA standard (Marffy, 2019).
Building on the success of OPC Classic, OPC UA was designed to enhance and surpass the capabilities of the OPC Classic specifications. OPC UA is functionally equivalent to OPC Classic, yet capable of much more.
1. Discovery: find the availability of OPC servers on local PCs and/or networks
2. Address space: all data is represented hierarchically (e.g., files and folders) allowing for simple and complex structures to be discovered and utilized by OPC clients
3. On-demand: read and write data/information based on access-permissions
4. Subscriptions: monitor data/information and report-by-exception when values change based on a client’s criteria
5. Events: notify important information based on client’s criteria
6. Methods: clients can execute programs, etc., based on methods defined on the server
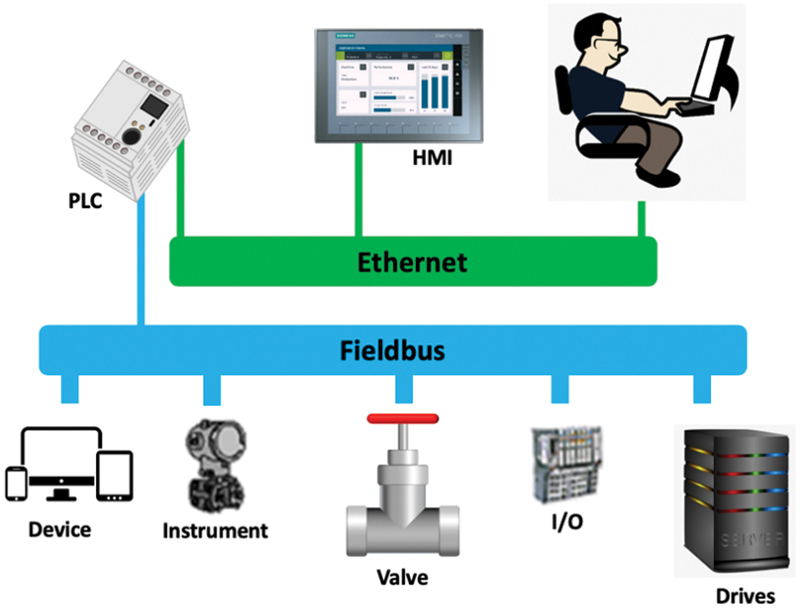
Integration between OPC UA products and OPC Classic products is easily accomplished with COM/Proxy wrappers (Unified, 2019). The differences are visualized in Fig. 5.5.
The most significant difference between classical OPC and OPC UA (OPC Unified Architecture) is that it does not rely on OLE or DCOM technology from Microsoft that makes implementation possible on any platform (i.e., Apple, Linux [JAVA] or Windows). The other very important part of UA is the possibility to use structures or models. This means that the data tags, or points, can be grouped and be given context, making governance and maintenance much easier. These models can be identified in runtime, which makes it possible for a client to explore connection possible by asking the server.
The information modeling is very modern in OPC UA. These models can be defined by manufactures, or protocols like BACNet; but it can also contain more of a MESH structure where very complex relations and connections between points and nodes can be defined. The possibility also exists to have data structures so that certain data always is grouped and handled as one piece. This is important in many applications where you want to be sure that the data set is taken at the same time.
OPC UA, as said before, is built to be platform independent and the communication is built into layers on top of the standard TCP/IP stack. Above the standard transport layers there are two layers, one that handles the session, and one to establish a secure channel between the client and server. The transport layer is made up of TCP/IP and on top of that SSL, HTTP, or HTTPS. The Communication layer secures the communication channel, not just that the data is corrupted but also it secures the authentication so that the end points cannot be infiltrated and changed. This is based on X.509 certificates that have three parts to it and the first peer to peer trust needs to be manually done; but after that the rest is taken care of securely.
With approximately 30 million HART devices installed and in service worldwide, HART technology is the most widely used field communication protocol for intelligent process instrumentation. With the additional capability of wireless communication, the legacy of benefits this powerful technology provides continues to deliver the operational insight users need to remain competitive.
Even though millions of HART devices are installed worldwide, in most cases the valuable information they can provide is stranded in the devices. An estimated 85% of all installed HART devices are not being accessed to deliver device diagnostics information, with only the Process Variable data communicated via the 4–20 mA analog signal. This is often due to the cost and the difficulty of accessing the HART information.
5.4.2. Wireless SCADA radio
Wireless SCADA is required in those applications when wireline communications to the remote site is prohibitively expensive, or it is too time-consuming to construct. In particular types of industry, such as Oil and Gas, or Water and Wastewater, wireless SCADA is often the only solution due to the remoteness of the sites. Wireless SCADA systems can be built on a private radio, licensed or unlicensed, cellular or satellite communications.
One major difference between private radio and cellular or satellite is that private radio has no associated monthly fees. Once an operator builds their hardware infrastructure, they own it. With cellular, or satellite service providers, there is an associated monthly fee.
The list of communications protocols that have been developed goes on from Foundation FieldBus, ProfiBus, HART, wireless HART, ProfiNet, Modbus, and DeviceNet Ethernet.
5.4.3. Which protocol is best?
The right answer is “it depends on the application and what is already installed.” An optimized solution will probably use more than one communication type, for example, new “analog” installations benefit greatly from FOUNDATION Fieldbus, while new “discrete” installations can benefit from PROFIBUS, PROFINET, DeviceNet, and Ethernet/IP. Electrical Integration depends on the equipment-supported protocol; but IEC 61850, Ethernet/IP and PROFIBUS could all prove useful. The most common view is to look at the current installed base, HART, PROFIBUS, DeviceNet, MODBUS, or others. Why replace when one can integrate?
For the decision maker, it comes down to deciding between a large capital investment and no monthly service fees, OR a smaller capital investment with monthly service fees. If the client’s remote assets are well within the Service Providers coverage area, they have high speed or TCP/IP data requirements, or their remote sites are there for a short term (lasting no more than 1 or 2 years) all of these factors contribute to making Cellular communications a more attractive option.
If the assets are extremely remote (hundreds or thousands of miles away from civilization) and/or they have TCP/IP LAN speed requirements, then Satellite communications is obviously the only solution. Often it is more typical for companies to have a mixture of solutions; using Point-Multipoint Private Radio communications where there is a high density of remote sites served by the one Master site, using Cellular for sites for from Private radio clusters, and/or satellite for the very remote sites.
Another difference between Private Radio networks and Cellular or Satellite networks is expansion capabilities. With Private Radio systems, if distances between communicating sites are too great for a single hop, then repeaters can always be installed to further the range. This certainly adds to the overall project cost, but it is at least an option if required.
With Cellular or Satellite, one is leveraging the vast existing infrastructure of the Service Provider. The advantage of Cellular or Satellite is that the client has access to very wide coverage but the disadvantage is that if there is a site that happens to be outside of the Service Providers coverage, there is no way for the client to increase the range; only the Service Provider can do that (Bentek, 2019).
5.5. How control systems manage data
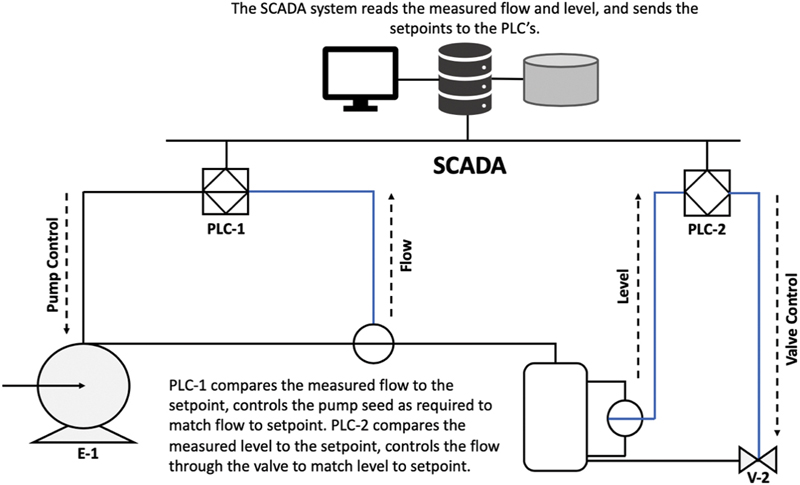
Supervisory Control and Data Acquisition (SCADA) is a control system architecture that uses computers, networked data communications, and graphical user interfaces for high-level process supervisory management; but uses other peripheral devices, such as programmable logic controllers and discrete PID controllers to interface to the process plant, oilfield operations or critical equipment (seen in Fig. 5.6). The operator interfaces which enables monitoring and the issuing of process commands, such as controller set point changes, are handled through the SCADA supervisory computer system. The real-time control logic, or controller calculations, are performed by networked modules which connects to the field sensors and actuators. The main purpose of a SCADA system is to collect data from sensors on well heads, tanks, and critical equipment (i.e., temperature, pressure, vibrations, flow rates, fill levels, and provide a view to the human operator the condition of field operations).
Figure 5.6Supervisory control and data acquisition.(Crompton).
5.5.1. Cloud-based SCADA and web-based SCADA
Cloud computing is a hot topic. As people become increasingly reliant on accessing important information through the Internet, the idea of storing, or displaying, vital real-time data in the cloud has become more commonplace. With tech giants like Apple, Microsoft, and Google pushing forward the cloud computing concept, it seems to be more than just a passing trend.
While many cloud services are specifically meant as storehouses for data, some cloud-based SCADA systems are offered as a “service;” which is referred to as SaaS (Software as a Service). Instead of having the SCADA system software installed on local computers, the entire system and its data is stored and maintained in the cloud. SaaS companies offer their customers the power of software applications, off-site IT support, and scalable server space all through the cloud.
The manufacturing industry is big, encompassing a wide variety of companies; likewise, the type of information each company tracks can vary greatly. This fact should be taken into account when determining what information, if any, should be stored in the cloud. Information such as reports, analytics, and configurations are ideal candidates for the cloud; however, information that is vital to safety and control functions—and that which relies on bandwidth availability and reliability—is particularly important to the operation of a manufacturer. It is essential to weigh the risks involved with putting this type of information in the cloud because it can directly affect the functionality and productivity of your company.
5.6. Historians and information servers as a data source
A Data Historian, also known as a Process Historian or Operational Historian, is a software program that records and retrieves production and process data by time. It stores the information in a time series database that can efficiently store data with minimal disk space and fast retrieval. Time series information is often displayed in a trend or as tabular data over a time range (i.e., the last day, last 8 hours, last year).
5.6.1. What can you record in a data historian?
A historian will record data over time from one or more locations for the user to analyze. Whether one chooses to analyze a valve, tank level, fan temperature, or even a network bandwidth, the user can evaluate its operation, efficiency, profitability, and setbacks of production. It can record integers (whole numbers), real numbers (floating point with a fraction), bits (on or off), strings (e.g., product name), or a selected item from a finite list of values (e.g., Off, Low, High).
Some examples of what might be recorded in a data historian include:
• Analog Readings: temperature, pressure, flowrates, levels, weights, CPU temperature, mixer speed, fan speed
• Product Info: product ID, batch ID, material ID, raw material lot ID
• Quality Info: process and product limits, custom limits
• Alarm Info: out of limits signals, return to normal signals
• Aggregate Data: average, standard deviation, moving average
A Data Historian could be applied independently in one or more areas; but can be more valuable when applied across an entire facility, many facilities in a department, and across departments within an organization. An operator can discover that a production problem’s root cause is insufficient power supply to the production equipment, or they could discover the two similar units produce significantly different results over time.
A Data Historian is not designed to efficiently handle relational data, and relational databases are not designed to handle time series data. If an operator can have a software package that offers both with the ability to integrate data from each different storage type, then they have a much more powerful solution.
There are many uses for a Data Historian in different industries:
• Manufacturing site to record instrument readings
• Production Status (e.g., machine up/down, downtime reason tracking)
• Performance Monitoring (e.g., units/hour, machine utilization vs. machine capacity, scheduled vs. unscheduled outages)
• Product Genealogy (e.g., start/end times, material consumption quantity, lot number tracking, product setpoints, and actual values)
• Quality Control (e.g., quality readings inline or offline in a lab for compliance to specifications)
• Manufacturing Costing (e.g., machine and material costs assignable to a production)
• Utilities (e.g., Coal, Hydro, Nuclear, and Wind power plants, transmission, and distribution)
• Data Center to record device performance about the server environment (e.g., resource utilization, temperatures, fan speeds), the network infrastructure (e.g., router throughput, port status, bandwidth accounting), and applications (e.g., health, execution statistics, resource consumption).
• Heavy Equipment Monitoring (e.g., recording of run hours, instrument and equipment readings for predictive maintenance)
• Racing (e.g., environmental and equipment readings for sail boats, race cars)
Information collected within a facility can come from many different types of sources including:
• PLCs (Programmable Logic Controllers) that control a finite part of the process (e.g., one machine or one processing unit)
• DCS (Distributed Control System) that could control an entire facility
• Proprietary Instrument Interface (e.g., Intelligent Electronic Devices): data delivered directly from an instrument instead of a control system (e.g., Weighing system, clean-in-place skid)
• Lab Instrument (e.g., Spectrophotometer, TOC Analyzer, Resonance Mass Measurement)
• Manual Data Entry (e.g., an operator periodically walks the production line and records readings off manual gauges) (Winslow, 2019).
5.7. Data visualization of time series data—HMI (human machine interface)
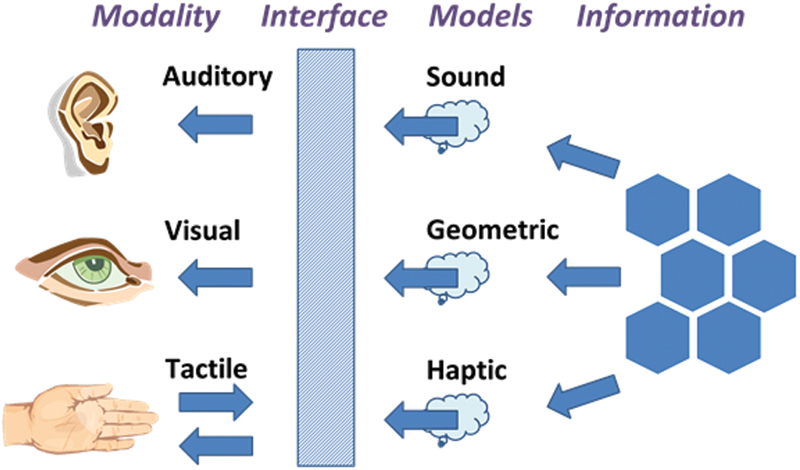
Human-Machine Interface (HMI) is a component of certain devices that are capable of handling human-machine interactions. The interface consists of hardware and software that allow user inputs to be translated as signals for machines that, in turn, provide the required result to the user. Human-machine interface technology has been used in different industries, like; electronics, entertainment, military, medical, etc. Human-machine interfaces help in integrating humans into complex technological systems. Fig. 5.7 displays how the information can be displayed to the human in different ways (i.e., touch, vision, and sound). Human-machine interface is also known as Man-Machine Interface (MMI), computer-human interface, or human-computer interface (Techopedia, 2019).
In an HMI system, the interactions are basically of two types (i.e., human to machine and machine to human). Since HMI technology is ubiquitous, the interfaces involved can include motion sensors, keyboards and similar peripheral devices, speech-recognition interfaces, and any other interaction in which information is exchanged using sight, sound, heat, and other cognitive and physical modes are also considered to be part of HMIs.
Although considered as a standalone technological area, HMI technology can be used as an adapter for other technologies. The basis of building HMIs largely depends on the understanding of human physical, behavioral, and mental capabilities. In other words, ergonomics forms the principles behind HMIs. Apart from enhancing the user experience and efficiency, HMIs can provide unique opportunities for applications, learning and recreation. In fact, HMI helps in the rapid acquisition of skills for users. A good HMI is able to provide realistic and natural interactions with external devices.
The advantages provided by incorporating HMIs include error reduction, increased system and user efficiency, improved reliability and maintainability, increased user acceptance and user comfort, reduction in training and skill requirements, reduction in physical or mental stress for users, reduction in task saturation, and increased economy of production and productivity, etc.
Touch screens and membrane switches can be considered as examples of HMIs. HMI technology is also widely used in virtual and flat displays, pattern recognition, Internet and personal computer access, data input for electronic devices, and information fusion. Professional bodies like GEIA and ISO provide standards and guidelines applicable for human-machine interface technology.
5.7.1. Asset performance management systems (APM)
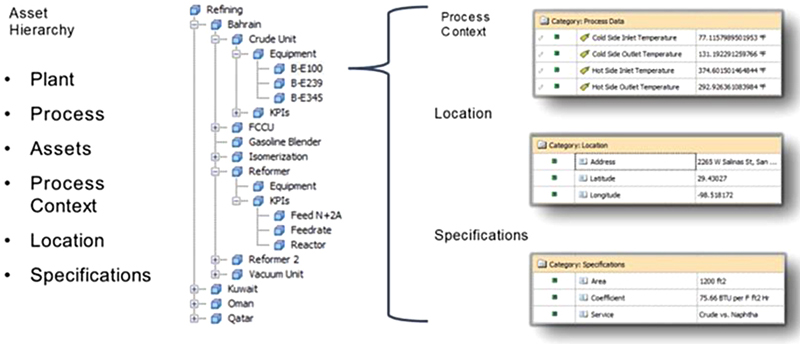
The objective is to move from the traditional monitoring and surveillance processes where the operator wants to know what happened (descriptive analytics) and why it happened (diagnostic analytics) to a new state where the operator can predict what will happen under certain operating conditions (predictive analytics). It may even be possible in the future to move toward prescriptive analytics where the operator can “tune” the processing system to produce optimum results most of the time (how can we make only good things happen). This end state is sometimes called Asset Performance Management and is visualized in Fig. 5.8.
Figure 5.8Real-time data requires context.(Crompton).
“Asset Performance Management (APM) is an approach to managing the optimal deployment of assets to maximize profitability and predictability in product supply, focusing on real margin contribution by asset by product code. Rather than looking at an asset on the basis of market value or depreciated value, companies can see how the asset is contributing to their profitability by looking at how individual assets are performing—whether inventory or Plant, Property, and Equipment (PP&E)—and developing a vision of how they want to allocate resources to assets in the future. APM is not necessarily purely financial or even operational, but it will cross functional lines. It combines best-of-breed enterprise asset management (EAM) software with real-time information from production and the power of cross-functional data analysis and advanced analytics. More broadly, it looks at the whole lifecycle of an asset, enabling organizations to make decisions that optimize not just their assets, but their operational and financial results as well,”
One of the basic steps of Asset Performance Management is process control and alarm management.
5.7.1.1. Process control and alarm management
Alarm management is the application of human factors (or “ergonomics”) along with instrumentation engineering and systems thinking to manage the design of an alarm system to increase its usability. Most often the major usability problem is that there are too many alarms annunciated in a plant upset, commonly referred to as alarm flood (similar to an interrupt storm), since it is so similar to a flood caused by excessive rainfall input with a basically fixed drainage output capacity.
There can also be other problems with an alarm system, such as poorly designed alarms, improperly set alarm points, ineffective annunciation, unclear alarm messages, etc. Poor alarm management is one of the leading causes of unplanned downtime, contributing to over $20B in lost production every year, and of major industrial incidents, such as the one at the Texas City refinery in March of 2005. Developing good alarm management practices is not a discrete activity, but more of a continuous process (i.e., it is more of a journey than a destination) (Mehta and Reddy, 2015).
5.7.2. Key elements of data management for asset performance management
Process historians are the “system of record” for sensor readings, but there are other data management tools that are important as well. Historians store tag names for identification of where a sensor is located in the operations environment, but an operator needs additional contextual information to place the sensor in the operating or plant system. The contextual data, sometimes called master data, is often found in an Asset Registry.
5.7.2.1. What is an asset registry?
The Asset Registry is an editor subsystem, which gathers information about unloaded assets asynchronously as the editor loads. This information is stored in memory so the editor can create lists of assets without loading them. Asset registers are typically used to help business owners keep track of all their fixed assets and the details surrounding them. It assists in tracking the correct value of the assets, which can be useful for tax purposes, as well as for managing and controlling the assets.
There are different ways of building the data model for this kind of information; taxonomy and ontology.
5.7.2.2. What is the definition of data taxonomy?
Data taxonomy in this case means an organized system of describing data and information. The information exists. The challenge is to help executives, analysts, sales managers, and support staff, find and use the right information both efficiently and effectively. Many enterprises extract value from the business information they accumulate by organizing the data logically and consistently into categories and subcategories; therefore, creating a taxonomy. When information is structured and indexed in a taxonomy user can find what they need by working down to more specific categories, up to a more inclusive topic, or sideways to related topics (Walli, 2014).
5.7.2.3. What is the definition of data ontology?
In both computer science and information science, ontology is a data model that represents a set of concepts within a domain, and the relationships between those concepts. It is used to reason about the properties of that domain, and may be used to define the domain.
5.8. Data management for equipment and facilities
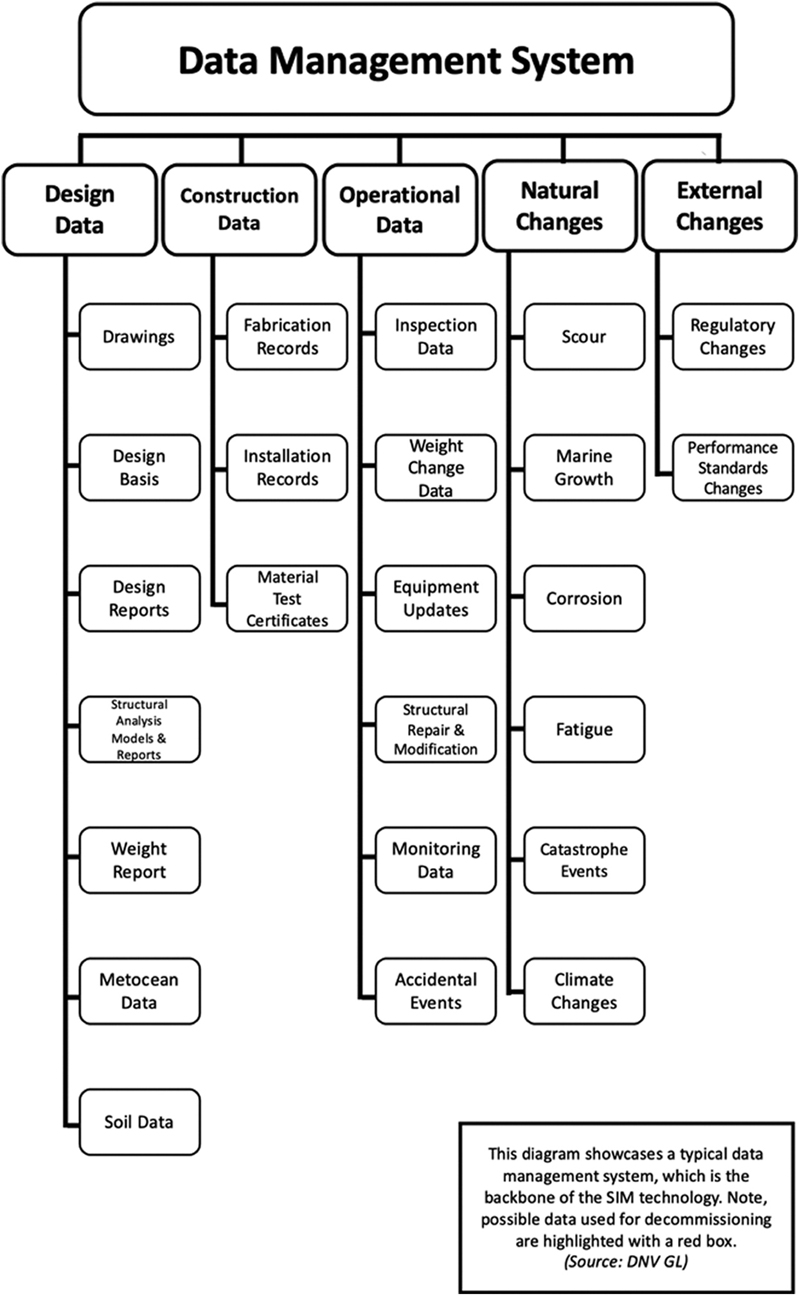
In addition to the sensor measurements and control system readings, there are many other important data records available; however, many of these data types are in the form of drawings, permits, documents, inspection records, certificates, P&ID drawings, process diagrams, etc. A data management system designed for documents is another type of data management technology that is needed (depicted in Fig. 5.9).
Figure 5.9Data management system for equipment and facilities.(Crompton).
5.8.1. What is a document management system?
Document management systems are essentially electronic filing cabinets an organization can use as a foundation for organizing all digital and paper documents. Any hard copies of documents can simply be uploaded directly into the document management system with a scanner. Oftentimes, document management systems allow users to enter metadata and tags that can be used to organize all stored files.
Most document management software has a built-in search engine, which allows users to quickly navigate even the most expansive document libraries to access the appropriate file. Storing sensitive documents as well? Not to worry! Most document management systems have permission settings, ensuring only the appropriate personnel can access privileged information.
These are some of the most important document management features:
• Storage of various document types, including word processing files, emails, PDFs, and spreadsheets
• Keyword search
• Permissioned access to certain documents
• Monitoring tools to see which users are accessing which documents
• Versioning tools that track edits to documents and recover old versions
• Controls regulating when outdated documents can be deleted
• Mobile device support for accessing, editing and sharing documents (Uzialko, 2019).
5.9. Simulators, process modeling, and operating training systems
Now that you have a basic understanding of the data involved from field instrumentation and process control systems, let’s take a look at some of the applications that the sensor data is input to starting with process simulation, or training simulation systems.
Process simulation is a model-based representation of chemical, physical, biological, and other technical processes and unit operations in software. Basic prerequisites are a thorough knowledge of chemical and physical properties of pure components and mixtures, of reactions, and of mathematical models which, in combination, allow the calculation of a process in computers.
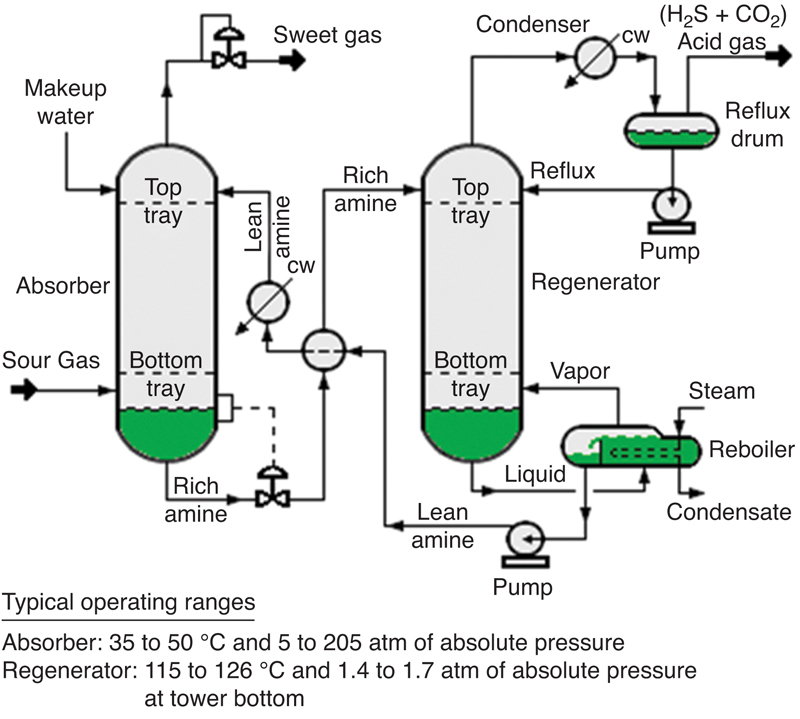
Process simulation software describes processes in flow diagrams where unit operations are positioned and connected by product streams, as illustrated in Fig. 5.10. The software has to solve the mass and energy balance to find a stable operating point. The goal of a process simulation is to find optimal conditions for an examined process. This is essentially an optimization problem, which has to be solved in an iterative process.
Process simulation always uses models which introduce approximations and assumptions; but allow the description of a property over a wide range of temperatures and pressures, which might not be covered by real data. Models also allow interpolation and extrapolation, within certain limits, and enable the search for conditions outside the range of known properties (Rhodes, 1996).
5.10. How to get data out of the field/plant and to your analytics platform
5.10.1. Data visualization
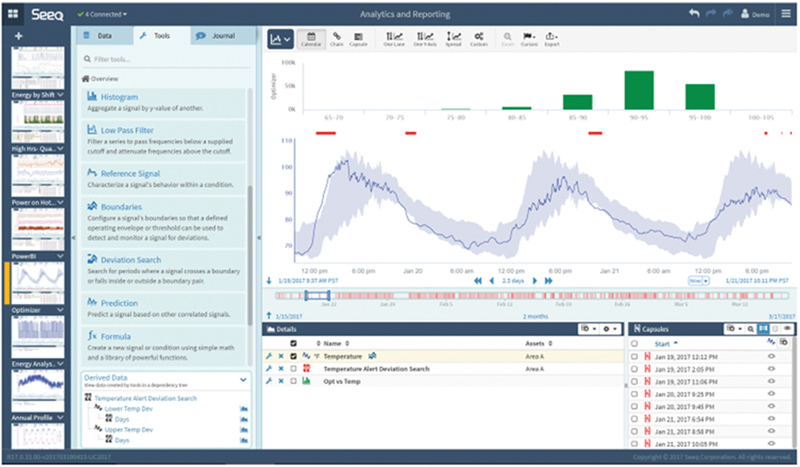
One area of rapid technology development in this area is the challenge of visualization of time-series data. Getting beyond the alarm stage and looking at the data historically to recognize patterns of equipment or process failure and building predictive models to help operators take action before catastrophic failure occur. You can see from this slide, included as Fig. 5.11, one of the many new data visualization technologies that are improving the HMI (Human Machine Interface).
Figure 5.11Data visualization of time series data.(Seeq, 2018).
5.10.1.1. From historians to a data infrastructure
While traditional process historians have served an important purpose for control systems for many decades, the limitations of historians are starting to become a barrier for providing data to advanced analytics. The limitations include:
• The data is “tag based” creating integration problems with enterprise data access
• One-off data feeds to specific solutions promote data silos
• This architecture is difficult to scale and requires expensive maintenance
• Solutions depend on analyst bringing data together to develop solutions
• There is limited use of automation to speed up data processing and data exchange
One leading vendor is this space defines the data infrastructure as a “system of insight” versus the traditional “system of data.” The new architecture includes the traditional process historian but adds real-time operational data framework capabilities such as an asset framework to provide asset-based hierarchy context and a library of appropriate data templates to help organize diverse inputs from sensor to metadata streams.
5.10.2. Data analytics
The end goal is to make the operations-oriented sensor, time-series data available for:
1. Monitoring and Surveillance
2. Addition of IIoT devices, edge, and cloud computing
3. Alarm Detection (process alarms more than just static set points)
4. Automation of routine tasks
5. Mobility solutions and advanced visualizations
6. Integrated Operations
7. Simulation Modeling
8. “Big Data” and Data-Driven predictive, “digital twin” models to drive manage-by-exception processes
These objectives have been coming in stages. The evolution of industrial analytics can be viewed in these three stages of development and maturity.
5.10.3. Three historical stages of industrial analytics
The first stage was defined by employees walking around with pencil and paper reading gauges on various assets in the plant; over time walking around was replaced with wired connections to sensors which used a pen in the control room to write sensor levels on a roll of paper, the “strip chart.”
The second stage came with the digitization of sensors and the electronic collection of data, presented to operators on monitors and then stored in historians. Data was viewed with trending applications that started out as electronic versions of strip charts. A connector imported historian data into a spreadsheet and enabled engineers to do calculations, data cleansing, etc. The history of the spreadsheet and historian are closely intertwined; both were invented in the mid-1980s and used in conjunction ever since. Every historian includes at least two application features; a trending application, and an Excel connector.
The third stage is currently emerging and assumes changes to the software and architecture for data storage and analytics, tapping advances such as; big data and cognitive computing, cloud computing, wireless connectivity, and other innovations.
5.10.3.1. Where is data analytics headed?
Advanced analytics refers to the application of statistics and other mathematical tools to business data in order to assess and improve practices. In manufacturing, operations managers can use advanced analytics to take a deep dive into historical process data, identify patterns and relationships among discrete process steps and inputs, and then optimize the factors that prove to have the greatest effect on yield. Many global manufacturers in a range of industries and geographies now have an abundance of real time shop-floor data and the capability to conduct such sophisticated statistical assessments. They are taking previously isolated data sets, aggregating them, and analyzing them to reveal important insights. The process to move from new technology into optimization of use in the field is shown in Fig. 5.12.
Automation increases productivity and helps engineers spend more time on translating data into meaningful information and valuable decisions. Real-time analytics for equipment and operations is providing significant bottom line value. Multiple predictive analytics are underway to predict compressors and valves failure. The objective is to reduce cost and increase uptime—(i.e., compressors trips/failure is one of the top bad actors). Moving to condition-based maintenance will help reduce OPEX and deferment.
Valves example: Valves maintenance is mostly time-based; if you are too late, the operator ends up with unscheduled deferment and health, safety, and environmental risks. If your maintenance routine is too early, the operator ends up with scheduled deferment and unnecessary costs.
Artificial Lift Optimization example: The data comes from the dyna-card measurement, or the pump cycle. The algorithms attempt to separate out the patterns of good performance (constant fluid getting moved up the wellbore) or bad performance. For the patterns of poor performance (vibration of the rod, no fluidbeing lifted, etc.) the operator wants to algorithms to suggest possible causes and mitigation or repair steps.
5.11. Conclusion: do you know if your data is correct?
Are there dark clouds on the horizon, holding your data hostage? As organizations look to adopt the new wave of coming technologies (like automation, artificial intelligence and the Internet of Things), their success in doing so and their ability to differentiate themselves in those spaces will be dependent upon their ability to get operational data management right. This will become increasingly important as connected devices and sensors proliferate, causing an exponential growth in data—and a commensurate growth in opportunity to exploit the data.
Those that position their organizations to manage data correctly and understand its inherent value will have the advantage. In fact, leaders could pull so far in front that it will make the market very difficult for slow adopters and new entrants.