Chapter 6: Getting the Most Across the Value Chain
Robert Maglalang Value Chain Optimization at Phillips 66, Houston, TX, United States
Abstract
In today’s global and fast changing business environment, the urgency with multinational companies to find readily implementable digital solutions has increased significantly as the underlying science yielding operational and business improvements has matured over the past decade. Companies lacking innovative ways to extract incremental value from existing and new business ventures will be left behind.
Manufacturing plants, in general, manage billion dollars’ worth of raw and finished products daily across the US—and globally. The quantities of data analyzed in a product life cycle, capturing cost-to-produce, logistics, working capital, and other ancillary costs are massive and difficult to both consolidate and integrate. Many production companies still rely heavily on manual processes to evaluate opportunities and economics.
Keywords
machine learning
value chain optimization
incremental value chain economics
digital platform
asset utilization
grow new markets
integrated strategies
innovation
6.1. Thinking outside the box
In today’s global and fast changing business environment, the urgency with multinational companies to find readily implementable digital solutions has increased significantly as the underlying science yielding operational and business improvements has matured over the past decade. Companies lacking innovative ways to extract incremental value from existing and new business ventures will be left behind.
Manufacturing plants, in general, manage billion dollars’ worth of raw and finished products daily across the US—and globally. The quantities of data analyzed in a product life cycle, capturing cost-to-produce, logistics, working capital, and other ancillary costs are massive and difficult to both consolidate and integrate. Many production companies still rely heavily on manual processes to evaluate opportunities and economics.
Adopting new technologies has been slow in many industries, and much more so in the oil and gas sector. The traditional, siloed infrastructures to drive quantitatively based decision making are not up to the challenge as the processes in-place are simply inefficient, thereby creating business risks with regards to data consistency, accuracy, and completeness. In a production plant setting for example, replacing a paper-based system with intrinsically safe gadgets or storing data in a cloud is not an easy transition due to the sensitivity in the security level and risks of causing disruption in the operations. However, since many architecture foundational systems are near the end of useful life—and with renewed focus on improving productivity and yield while cutting down costs—more energy companies are opening their world to the digital technology era.
The production plant is the universe around which the organizational improvement focus revolves—a wise investment of resources, as they are the outright cash cows. Emphasis on the plant level optimization and improvements can help a company realize significant value creation through asset reliability and integrity and increase in energy efficiency and productivity. However, putting all strategic efforts alone in the production margin may not move the needle in terms of dollars, especially for the oil majors. Outside of this huge “plant box,” the greater portion of the business operates in a very competitive market environment where significant opportunities lie. Decision makers require intelligent models with real-time information not only to be immediately available but also to provide valuable insights.
6.2. Costing a project
When implementing ML methods in the industry, we naturally ask: Is it worth it? Measuring the benefit of the technology and its outcomes is not easy. In fact, not even its cost is easy to measure. Fig. 6.1 presents a common situation in large corporations when a significant new initiative is launched. While it is comical to portray the misunderstandings in this fashion, the dire reality is that they often prevent the value from being generated and, in turn, give the technology a bad name.
Figure 6.1Common problems in communication when implementing a complex project, such as machine learning initiative.
The point is that before we can talk about measuring the added value of machine learning, we must be very clear and transparent in our communication what we expect it to deliver. Often, industry managers are unsure about what they expect and need help to fully understand even what they could expect. Many vendors choose to dazzle with vocabulary, acronyms, technologies and dashboards without ever getting down to properly defining the situation—the last image in Fig. 6.1. As John Dewey said, “a problem well stated is a problem half solved.”
In costing an ML application, consider
• Providing sufficient domain expertise to the machine learners so that they can model the problem in its full practical complexity.
• Involving the end users to define in what manner they need the answer delivered so that the answer becomes actionable and useful.
• Obtaining good quality, comprehensive, representative, statistically significant, and high-frequency data to enable the data-driven learning to take place.
• Employing expert machine learners to design the algorithms to calculate a precise and accurate answer.
• Spending enough time and effort not just in building the system but testing and debugging it while involving everyone concerned.
• Investing in change management to transition the organization’s procedures into being able to utilize the new technology in a practical way.
Vendors focus on the technological costs of the project, the effort and cost of testing and change management are significant. In fact, most projects that fail, fail because of poorly executed change management. We will discuss this issue later in this chapter.
Most projects that run over the time and financial budget, do so because testing and debugging the system takes longer than expected. One way to mitigate this problem is to use the agile methodology of software development—discussed in Chapter 7 of this book—which incorporates feedback into the development cycle. No matter how the project is run however, sufficient attention must be paid to gathering practical feedback from the end users and adjusting to that feedback. The second most common reason for project failure, after insufficient change management, is a lack of real-world understanding flowing into the analysis. Whenever a vendor claims to be able to solve a problem without detailed and deep domain knowledge, it spells doom from the start.
6.3. Valuing a project
After knowing what it would cost to realize a project, we can think about what it would yield. The reason to think about the benefit after the cost is that the process of costing involved a detailed definition of what the project entails. From experience, projects that were valued prior to a detailed planning were overvalued because of the hype of machine learning that supposedly promises a panacea to all ills in no time at all.
Based on the project definition, what is the kind of benefit being derived? In many cases, there are several benefits. Common dimensions include (1) an increase of revenue, (2) a decrease in cost, (3) a higher production yield, (4) a higher production efficiency, (5) a reduction in staff, (6) a speed-up of some kind, (7) consumption of fewer material resources, (8) a reduction in waste or scrap, and (9) a novel business model. Most of these can be measured if we have realistic estimates available.
The last item, a novel business model, is interesting because it is often cited and recognized as very exciting. It is also quite uncertain. Nevertheless, artificial intelligence has enabled numerous new business models that are very profitable and are based essentially in the fast speeds and high complexities that ML models support. Cars without drivers are perhaps the most commonly envisioned transformation in this respect.
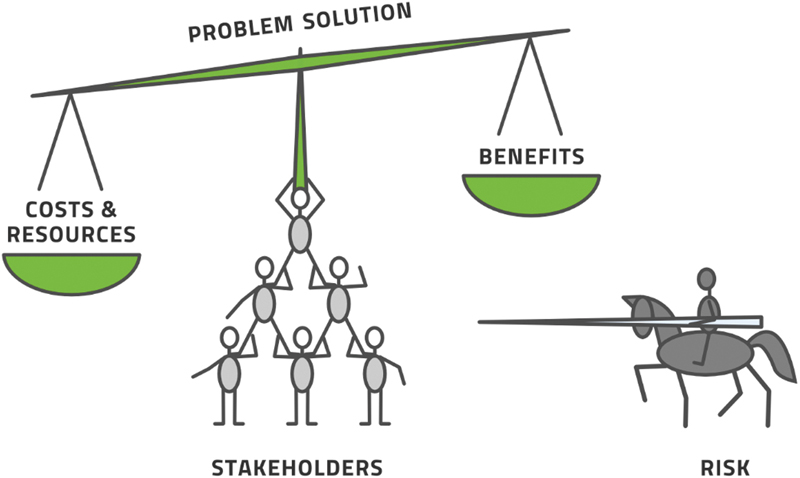
In considering the benefits of a project, consider all the stakeholders and their individual benefits as well. They may align with the corporate goals, or not. Also consider the risks if the project does not work out or works less well than imagined. See Fig. 6.2 for an overview of all the factors involved in valuing a project.
Figure 6.2Overview of the drivers in the business case behind a data science project.
A case in point is the famous “pain point” of the customer. Frequently, the issue that generates the most frustration for certain individuals is at the top of their mind and quickly raises the idea that ML could make this issue go away. Enthusiasm is quickly built and a project is envisioned. Vendors are tripping over themselves to fulfill the need and make the customer’s pain go away. Finally, a real customer has a real pain point! A sale might be near. Celebrations! But hold your horses. Two separate issues must be examined before too much enthusiasm can be spent on this idea by either the vendor or the people who feel the pain.
First, it must be determined how the benefit is going to be measured. Second, the benefit must then be measured and determined to be large enough. Many situations conspire together to make these two issues work out against doing the project. Let’s address both points.
6.3.1. How to measure the benefit
The example for this is predictive maintenance. This is the most discussed topic in the oil and gas industry where applications of ML are concerned. By the number of articles published and webinars held—by top managers of oil and gas operators—on this topic, one would think that this is applied ubiquitously across the industry and world. Far from it. Only a very few companies have deployed it, and even then only in special cases and restricted geographical areas.
One common reason is that maintenance is almost always viewed as an annoying cost item and entirely separated from production. Assessing a maintenance solution by the amount of additional production it enables, is obvious. However, most companies do not do their accounting in this way. As a maintenance solution, the maintenance department will have to pay for it and so it must yield a financial benefit within the confines of the maintenance budget. This benefit may be large but the effect on production is almost certainly far greater. Can your organization think broadly enough to consider cross-departmental benefits?
6.3.2. Measuring the benefit
At first glance, measuring the benefit is just an estimate of what the ML project can deliver and putting a financial value to it. However, it is not quite so easy.
All ML methods will produce some false-negatives and false-positives. In the cases of a regression or forecasting task, the equivalent would be an outlier calculation. No matter what method you employ, it will sometimes make a mistake. Hopefully, this will be rare but it will occur and you must consider it.
Statistically speaking, the most dangerous events are those that are very rare and cause large damage. It is very difficult to accurately assess the cost of such events because we cannot reliably assess their likelihood or cost. The most famous example is Deepwater Horizon where a simple cause leads to a global disaster. Clearly this type of event is rare and very costly in multiple ways. Fear of such events often leads to an operator not implementing, or not rolling out, an ML initiative. It may represent the main obstacle to full adoption of ML by the industry. The perception of risks threatens to undermine the entire value consideration and so it is important that this be dealt with early on in the discussions, see Fig. 6.3.
Figure 6.3Risk, or the perception of them, may derail any careful consideration of costs and benefits.
6.4. The business case
The business case, then is a combination of five items
1. Definition of the situation, challenge and desired solution
2. Cost and time plan for producing or implementing the solution.
3. Benefit assessment of the new situation.
4. Risk analysis of what might go wrong and lower the benefits or increase the costs.
5. Change management plan of how to implement the solution once it has been created.
If the benefits outweigh the costs—plus or minus the risks—it is worth doing. The assessment is very sensitive to one’s point of view as illustrated above with the manner in which benefits are calculated.
Chapter 8 in this book analyses the position of pilot testing in this process in some detail. It is often desired by oil and gas operators to conduct a pilot for an ML project in which the ML method is tested out. There are three common dangers in pilot programs. First, pilots often assess only the technology and not the benefits. Second, some pilots try to fully gain and assess the benefits without spending the costs and then obviously fail. Third, most pilots are started using a concrete problem only as a stand-in because the real vision is a vague desire to learn what ML can offer and how it works. This last danger is particularly significant because it means that the organization never intends to put this particular project to productive use.
The business case of ML is similar to all business case arguments. It differs in only two essential ways.
First, the uncertainty of what the solution will look like, which makes the cost and benefit analysis more intransparent.
Second, the expectations and fears of ML in general. Often both are overly inflated by marketing from vendors (who inflate expectations) and cautionary tales by utopians (who are afraid of the robot apocalypse).
The first can be solved easily by some level-headed thinking. The second by talking with some machine learners who are not afraid to say what is realistic and what is squarely within the realm of Hollywood movies.
6.5. Growing markets, optimizing networks
A simple example of an application of ML in the oil and gas industry is a plant operation with multiple terminals and retail stations, see Fig. 6.4. Each node on the graph represents either a terminal (if arrows are leaving it) or a retail station (if arrows arrive at it).
Figure 6.4Integrated network of terminals and retail stations.
The product distribution and placement are bounded by many challenges. There are logistics constraints, bottlenecks, new routes, and infrastructure restrictions among others that require predictive analytics for real-time decision support. With the sheer volume of information moving at lightning speed, lacking intelligent details and degree of granularity is not optimal for agile, yet vetted decisions.
In an ideal environment, plant production is well matched with secure placement demand. The volume allocation in a pipeline or terminal is at the optimum integration and any additional barrels will fill the line up-to capacity. However, even in this ideal logistics set-up, price fluctuations in the market can represent significant risks. In addition, operating plants normally have unplanned outages and unit upsets that can disrupt the supply and demand equilibrium, and the integrated systems would need to absorb the impact in a dynamic market.
The availability of advanced tools such as Machine Learning (ML) provides a better way to analyze data more quickly and accurately than ever—and unlock potential for margin improvements by incorporating optimization and growth economics to maximize value chain profitability. Machine learning allows manipulation and analysis of “Big Data” to generate key insights such as: (1) what happened in the business, (2) what is happening now, and (3) what is likely to happen in the future. Likewise, optimization using ML offers more detailed analytics and new possibilities to answer important strategic business questions such as:
• What is the optimum integration target that maximizes overall margin?
• What is the impact to the net margin if new products or blend stocks are produced to meet the market needs?
• What is the overall net effect to re-supply a network of terminals to cover production shorts?
• Where is the optimum volume allocation if new route is added?
• Where is the next best alternative?
• What happens to the net margin if there are production change impacts or market shifts?
• How much volume should be sold at the spot market or exchange partners?
• Where are the growth opportunities based on industry views or market intelligence?
• Is a project investment justified to meet market demand?
The answers can be derived in multiple ways, and the level of accuracy and consistency can vary significantly depending on the methods utilized. While any forecasted metric is only an estimate, the decision criteria are tied mathematically and can be scientifically computed using real-time optimization to capture market opportunities.
6.6. Integrated strategy and alignment
In a multi-channel network, the applications of data driven analytics to make supply and demand decisions are integral to efficiently deliver consistent and transparent optimization processes and to increase margin capture. Across business units, the data mined to generate actionable insights do not provide a complete picture without the ability to view all the components together as a system. The diagram in Fig. 6.5 is a good example of a quantitatively dependent systems that can significantly benefit from business driven analytics:
Figure 6.5Value chain system.
In complex, multi-functional processes, using conventional ways of mining hundreds of thousands of rows of data, analyzing the information, and presenting the results is a huge challenge without a reliable ML model. It is enormously time consuming to clean-up, sort, or transfer data before it can be accessed and consumed by decision makers. The most cost-effective solution to solve this common problem in the industry is to build a supported IT architecture anchored by ML algorithms in order to align the value chain capture.
The ML model integrates, correlates, and computes answers to strategic business questions as well as screen opportunities dynamically. The traditional method would take several hours or days to get to a degree of granularity needed for vetted decisions and could be error prone due to its inability to handle this size of information with limited functionalities. Extracting useful data and moving the information to where it is needed quickly would add significant value to the financial bottom line.
6.7. Case studies: capturing market opportunities
The downstream refiners deal with a number of challenges across the energy value chain, from crude oil purchases to product placement all the way to the retail business. Employing ML as a tool to make many detailed analyses in real-time and respond to external factors that are moving too quickly enables refiners to adapt their go-to-market strategy and operation to support profitable business decisions.
One of the strategic opportunities is on crude optimization, which can be in billion-dollar transactions for refiners with multiple sites. The main challenges are crude transport and delivery period which can be roughly 1–2 months transit time; and there is no real-time dashboard for crude selection and trading decisions available that are “plug-and-play.” The process starts when a price forecast is published as the basis for a refining crude run. The site planning team determines how to re-optimize the plant on a weekly cycle according to the prior week’s forecast. A facility will run its own Linear Programming (LP) modeling which is oftentimes done via a simple spreadsheet program, and the results are shared back to the trading and commercial teams to show the optimized crude rates based on the incremental margin. If there are multiple refineries in a region, the synergies are often ignored, as the LP analysis is limited to a single site. Table 6.1 summarizes the process from data collection to dashboard development utilizing ML and analytics for crude selection and trading decisions on most recent LP reports.
Table 6.1
Crude/feedstock optimization.
Data sources
Database
Crude supply/trading (user inputs)
Results
Crude assays
Integrates all relevant data to find correlations and empirically develop the model without the involving human expertise
Mathematical representation to compute the “state” of the refinery based on the historical datasets, factoring in time and cause and effect
Adds price “real-time”
Compares base slate versus new/optimum slate in terms of volume swapped and margin versus reference
Price forecast ($/bbl cost/margin/crack, RCV, BE, etc.)
Goal is to maximize profit by comparing available crudes to purchase versus alternative
Enters transit time
Shows current tank levels (OIS connectivity), crude rates
OIS—plant monitoring system
Other relevant info for Traders/Supply Team to make decision real-time
Upcoming T/A plans—unit impacted
Independent variables:
Refinery
Crude Type
Update unit limitations, as needed
Note: At least 5 years of Historical Data are available to train the model
Price of Crude
Transportation Cost
Transit Time
Product Prices
Market Crack
Dependent variables:
Refinery Crude Value—margin or incremental relative to a base slate (generally determined via LP—change in variable margin per barrel of crude substituted). Delta objective function divided by barrels substituted
Breakeven Value—full product value without regards to its cost (a.k.a. cost at which you are indifferent)
Product Mix—expected production yields based on parameters
In a nutshell, the software tool streamlines the following process:
1. Crude assays are integrated into the data sets and merged with the refinery model and trader’s price inputs or forecasts, considering all the data sources as a single, complex system.
2. Models are created to correlate refinery LP results (i.e., crude base slate, available crudes for substitution, margin/or incremental value relative to a crude base slate, breakeven, products sales, etc.) to determine the mathematical relationships of the parameters.
3. Each crude will have a corresponding assay, crude/freight costs (changes over time) and relative crude value (value or margin of the candidate crude relative to a crude base slate) and break even (price at which the refinery is indifferent to the crude purchase) and other key measurement from the LP run.
4. Once the “state” of the refinery is set, crude buyers can then make crude selections based on current prices and product margins to capture opportunities.
5. The goal is to compute for the highest margin from the available crude in the market to maximize profit across the value chain.
6. The model is refreshed whenever the refinery updates the LP run (to incorporate process unit constraints, among others).
The process simplifies the data handoffs, improve agility and speed-to-deal, and consistent and transparent transactions when buyers term-up commitments and optimize crude purchases.
Another opportunity for refiners is on product placement economics. Re-balancing volume allocations to account for strategically advantaged markets and seasonal market liquidities are huge value creation—if all pieces of information are analyzed collectively. Combining hundreds of thousands transactional data points into a coherent scorecard, while examining the market conditions to figure out whether the benefits outweigh the risks, can be a game changer (Fig. 6.6).
Figure 6.6Marketing system.
Divisions within commercial or marketing organizations can rely on an optimization tool anchored by ML that determines the optimum integration level in specific regions, based on maximum return to the business unit. The model assesses logistics, identifies bottlenecks, incorporates seasonal market liquidity, and covers production shorts to re-balance volume allocation. Product placement economics is evaluated real-time to adjust for production changes and market shifts.
The first step is to understand the historical volumes produced at specific site, including seasonal market liquidities, see Fig. 6.7.
Figure 6.7Understanding seasonality.
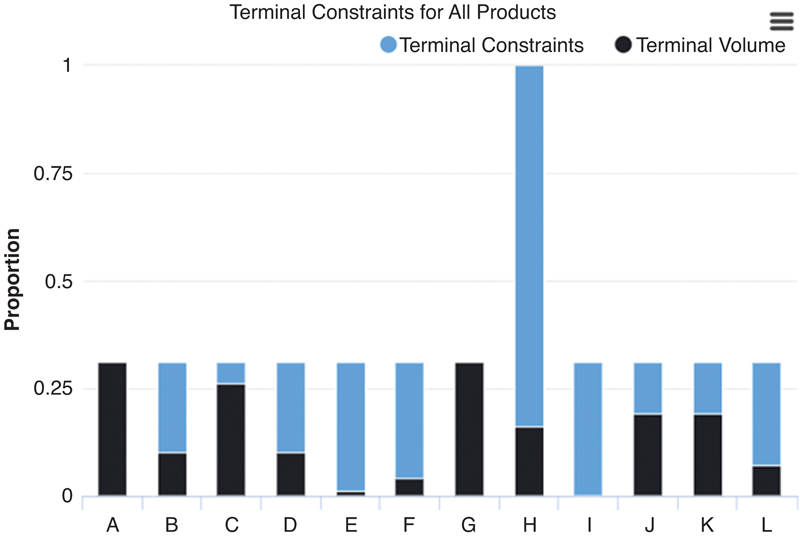
Then, the capacity constraints and capabilities at the terminals and pipelines to meet fuels requirements are incorporated into the model, including sourcing and blending, to establish baseline numbers, see Fig. 6.8.
Figure 6.8Visualizing constraints on the system.
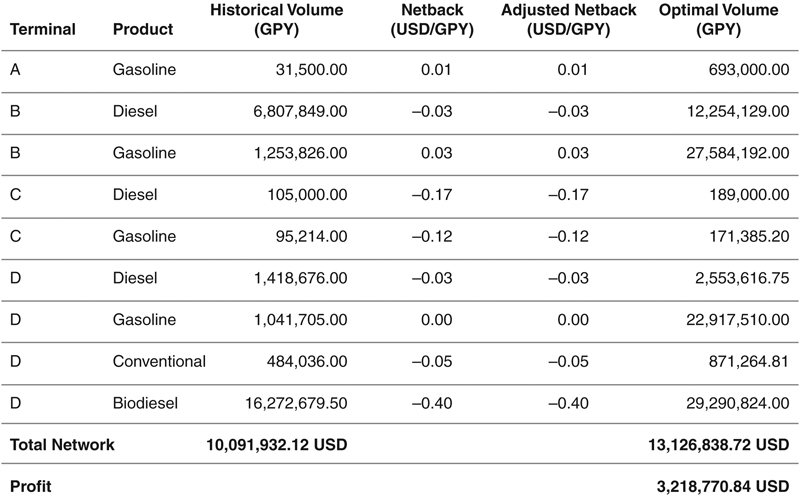
Once the baseline is established, the tool can evaluate the net margins at the terminal and product level, see Fig. 6.9.
Figure 6.9Analyzing margins.
One of the fundamental drivers to maximize net margin is the flexibility to allow for pricing sensitivities and variations. These can be manually inputted into the software interface, see Fig. 6.10.
Figure 6.10Specifying the drivers and decisions.
Once all the information is combined—and applying robust methodology to improve margins—the tool can determine the most advantaged market and incremental economics on a consistent basis. Key decisions, such as project investment, alternative supply availability, and integration targets, would require advanced predictive analytics to anticipate market shifts and production changes. The ML platform can view the entire market as a whole and allows for aggressive marketing penetration as local placement grows; or becomes more competitive.
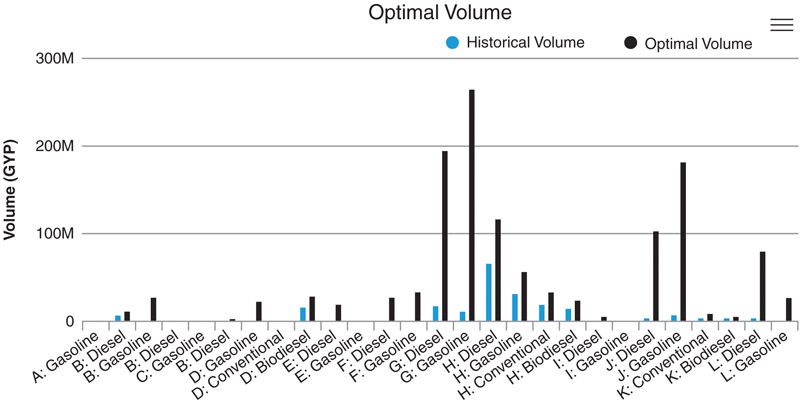
As shown in Fig. 6.11, significant margins can be realized when the overall network is optimized.
Figure 6.11Improved margins after optimization.
Relevant dashboards and data visualizations can also be built on the front-end to support real-time decision making, with seamless integration with other systems, see Fig. 6.12.
Figure 6.12Visualize actions that must be taken.
The digital foundation can be a mash-up of multiple applications built over a single optimization ML tool. Leveraging existing systems for crude or products data analytics can help achieve the profitability goals more efficiently, as long as the digital engine is backed by the right technology platform.
6.8. Digital platform: partner, acquire, or build?
In most cases, the software solutions for industrial applications are not readily available. Outside of the plant environment, business driven analytics and models with accompanying reports and dashboards have not been implemented on a large scale to augment decision-making. If vendors have plug and play software that works, the estimated cost is typically a tiny fraction compared to the potential earnings that can be realized if the right solution results in a timely and efficient execution.
To continuously improve and deliver sustainable business performance, companies have put together dedicated resources and formed digital analytics teams within the organization. Relying on internal capabilities is critical to ensure there are clear accountabilities and long-term success. The main players are the data engineers and data scientists combined with subject matter experts and consultants to develop a pipeline of projects around system improvements and automation. With the support from industry consultants, clients evaluate the project trade-offs to set the framework for capital allocation. Also, by going through discussions around effort vs. impact, for instance, they can prioritize high value projects, quick wins, and strategic activities aligned with the overall company objectives and aspirations.
One of the main challenges in launching new applications is timely implementation. Staff needs to understand the complexity of the problems and the right solutions while also figuring out whether to build the software, partner with vendors that have existing or similar type solutions, or acquire the technology outright, if available. There will be trade-offs and conflicting perspectives with these options, and the required implementation timeframe is an important parameter in the decision criteria.
Another consideration is developing a network of excellence with data science and engineers in-house, which is not easy since the roles require programming and IT skills, math and statistics knowledge, and scientific expertise. For oil and gas companies, it would take several months or even years to build internal capabilities as these roles are neither their bread-and-butter nor reside within the organization. Plus, the importance of the full-time internal experts may diminish over time when the technology has been implemented company wide.
A hybrid approach (in-house experts with outside consultants) is more suitable for skill reinforcement and coordination; and to distribute the load evenly. While it is costly to use consultants to provide on-site expertise and support, utilizing them to varying degrees and fostering knowledge sharing could fast track the implementation of the key projects across the enterprise, allowing the company to improve cross functional collaboration and enhance competitive position in the market in a timelier fashion.
6.9. What success looks like
Applying machine learning in the decision process is business critical, most especially when the key factors are unknown, and the quantification of uncertainties and risks can be formulated using existing data. ML has been fully tested in various applications not only to measure opportunities but also to predict and prescribe solutions that enable rapid decisions and deliver profitable growth and enhance returns.
Adoption of ML in the workplace environment is not going to be easy, like any new tool to get the users’ buy-in and trust. Change management is fundamental in this process to communicate the scope definition and expectations up-front and drive awareness and establish connection points with the impacted stakeholders. With dedicated change management resources, they can support the tool implementation by providing required training, gaining alignment, and creating an open channel for feedback.
Change management is nicely displayed in Fig. 6.13 where we see the evolution of an individual over the course of some change. It begins with anxiety and transitions into happiness that something will change, bringing with it the hope that a pain might go away. But quickly fear settles in as it becomes unclear what impact it will have and might present a bigger change than anticipated. This is followed by guilt at having initiated or participated. At this point, many people chose to stop or become hostile. We must encourage people to see the project as an opportunity here so that they can see it working and see themselves as part of the brave new world.
Figure 6.13An adaptation of John Fisher’s personal transition curve.
Guiding people through this process is what defines change management. Without a dedicated change management process, too many people involved will either give up or develop hostility and this leads to project failure. Only with dedicated effort can we bring most, or all, people to the new situation with some enthusiasm and only then will the ML project succeed.
In this effort, it must be recognized that the number of people affected by the new technology is usually quite a bit larger than the group that worked on the project itself. Particularly in the oil and gas industry, it is the end users who are expected to use the product on a daily basis that are not involved in the process of making or configuring the product. This alone leads to tensions and misunderstandings. If the end users are the maintenance engineers who are expected to use predictive maintenance, for example, we may be talking about several hundred individuals who have to transform from reactive to proactive lifestyles at the workplace.
Ultimately, the business solution needs to be simple and streamlined, provide a higher level of accuracy, and give decision makers the right information at their fingertips at the right time. The company significantly benefits financially when existing or new data is examined from a slightly different angle— and derive actionable insights.