
2. Navigating Project 2010
In this chapter, you’ll learn how to navigate around the interface and how to use the views in Project 2010.
The first step in really digging into Project 2010 is to look closely at the different parts of the user interface. At the top of the Project window is the ribbon, below that is the timeline, and below the timeline is the view display area.
Using the Ribbon
The ribbon is made up of several tabs that display commands appropriate for whatever view you’re using in Project 2010. Each tab contains several groups of buttons, separated by vertical gray lines and labeled in gray text at the bottom of the tab. Figure 2.1 illustrates the tabs and groups on the ribbon.
Figure 2.1. The ribbon is displayed at the top of the Project window.
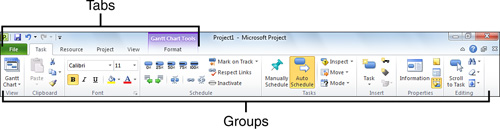
The Task, Resource, Project, and View tabs are always available, with some buttons on each tab made unavailable depending on what view you’re using or what you have selected.
Each view in Project 2010 has a special Format tab with buttons for commands that you can only use in each view. This special tab is the last one on the right and is highlighted using a different color for each view.
If you’re familiar with previous versions of Project, you may find the interactive ribbon mapping guides available on Office.com helpful in learning where to find menu commands on the ribbon. To view the Project 2010 interactive guide, go to http://office.microsoft.com/en-us/project-help/learn-where-menu-and-toolbar-commands-are-in-office-2010-HA101794130.aspx and then click Open the Project guide, under Use an interactive guide to find my commands.
For more information on using the ribbon, see Show Me Media 1.3.
Using the Timeline
The timeline, which illustrates your project’s tasks, is displayed between the ribbon and the main viewing area in the Project 2010 window. The timeline can be very helpful in communicating your project data with others.
If you click within the timeline portion of the window, a Format tab specific to the timeline is displayed on the ribbon, in the shaded area labeled Timeline Tools (shown in Figure 2.2).
Figure 2.2. The Format tab for the timeline contains several view options.
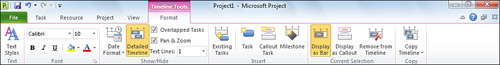
You can use the buttons on the Format tab for the timeline to add tasks and milestones to the timeline, change the date formats used for each task on the timeline, and change the text styles used for different elements of the timeline. Tasks can be displayed as bars within the timeline, or as callouts above or below the timeline.
After you have the timeline displayed with the information you want, you can share it with others.
Show Me: Media 2.1—Sharing the Timeline

Access this video file through your registered Web Edition at my.safaribooksonline.com/9780132182461/media.
Share the Timeline with Others
To share the Timeline with others, follow these steps:
- On the Format tab, in the Copy group, click Copy Timeline.
- Choose whether you want to copy the Timeline For E-mail, For Presentation, or Full Size. The timeline is copied to your clipboard.
- Paste the Timeline in another application, such as Outlook, Word, or PowerPoint, for sharing with others.
Understanding Project Views
Project 2010 has 27 built-in views that you can use to see different information about your project. Views display task information, such as task names and dates, resource information, such as names and rates for the people involved with your project, and assignment information, such as what tasks a specific person is working on at a given time.
Show Me: Media 2.2—Understanding Project Views
Access this video file through your registered Web Edition at my.safaribooksonline.com/9780132182461/media.
What Views Are Available in Project 2010?
Project 2010 provides several different default views, each designed for a unique purpose. The following sections go over each default view.
Tell Me More: Media 2.3—Deciding Which View You Should Use

Access this audio recording through your registered Web Edition at my.safaribooksonline.com/9780132182461/media.
Bar Rollup
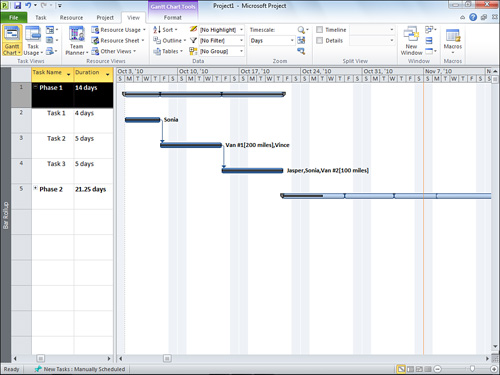
Use the Bar Rollup view, shown in Figure 2.3, to display subtasks overlapping summary tasks on the Gantt Chart.
Figure 2.3. The Bar Rollup view
 LET ME TRY IT
Roll Up a Subtask
To include a subtask overlapped on a summary task in the Bar Rollup view, follow these steps:
- In the Bar Rollup view, double-click a subtask to display the Task Information dialog box.
- On the General tab, select the Rollup check box, shown in Figure 2.4.
Figure 2.4. Select the Rollup check box.
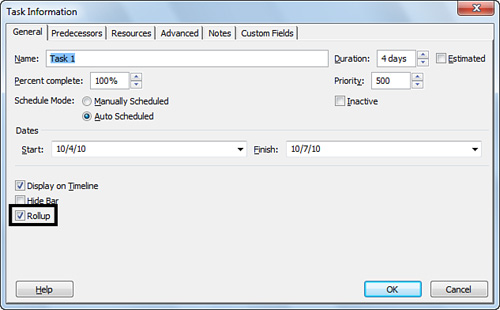
- Click OK. The subtask bar now appears overlapped on its summary task bar on the Gantt chart.
Calendar
The Calendar view, shown in Figure 2.5, displays your project’s tasks as overlays in a standard calendar format. This view enables you to jump between viewing a month, a week, or a custom span of weeks or dates.
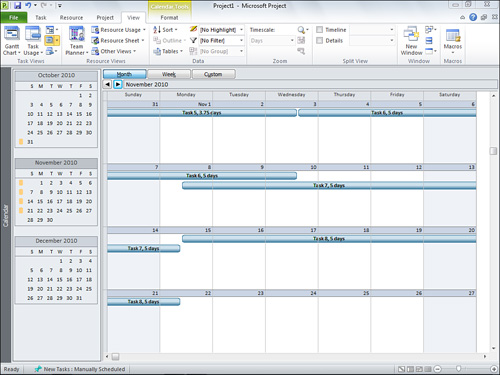
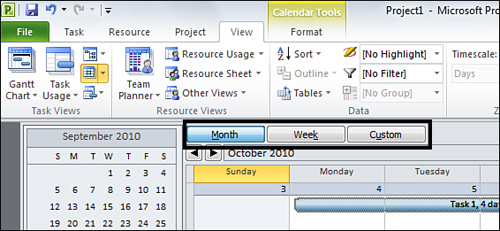
Click Month, Week, or Custom, above the calendar, to change what dates the Calendar view displays. Figure 2.6 highlights these buttons on the Calendar view.
Figure 2.6. Click Month, Week, or Custom.
LET ME TRY IT
Set a Custom Calendar Period
To choose a specific set of dates to display in the Calendar view, follow these steps:
- In the Calendar view, click Custom, above the calendar.
- On the Zoom dialog box, choose whether you want to display a certain number of weeks, or a specific date range, using the options shown in Figure 2.7.
Figure 2.7. Use the Zoom dialog box to set a custom calendar period.
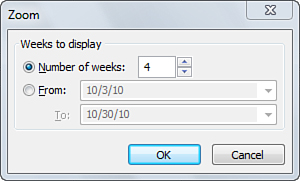
- Click OK. The calendar is updated to display the period you specified.
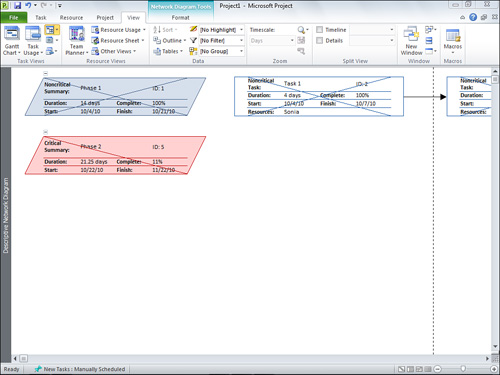
Descriptive Network Diagram
As shown in Figure 2.8, the Descriptive Network Diagram view displays boxes for each task in your project, containing details about each task. When appropriate, the boxes are connected using arrows that show dependencies between the tasks. Tasks on the critical path are highlighted in red.
Figure 2.8. The Descriptive Network Diagram view
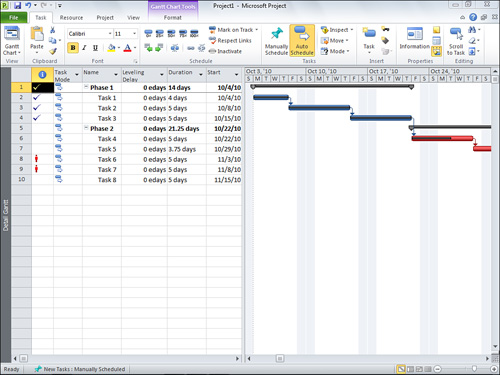
Detail Gantt
The Detail Gantt view, shown in Figure 2.9, helps to highlight how much a task can be delayed before other task dates are impacted. This view shows the critical path using red bars on the Gantt chart.
Figure 2.9. The Detail Gantt view
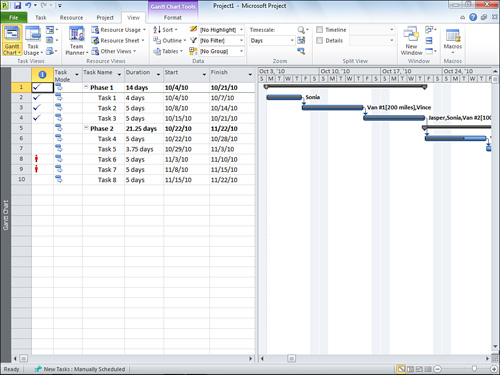
Gantt Chart
The Gantt Chart view, shown in Figure 2.10, is probably the most-used view in Project 2010. It lists the project’s tasks on the left portion of the view, and displays coordinating bars across a timeline on the right portion of the view.
Figure 2.10. The Gantt Chart view
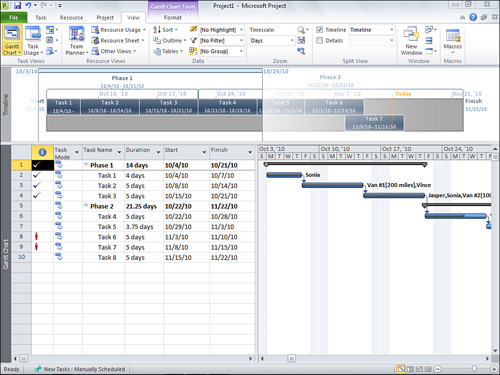
Gantt with Timeline
The Gantt with Timeline view, shown in Figure 2.11, is a split view that displays the Timeline view in the top pane and the Gantt Chart view in the bottom pane.
Figure 2.11. The Gantt with Timeline view
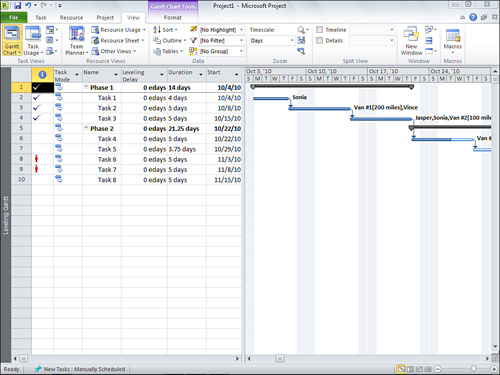
Leveling Gantt
The Leveling Gantt view, shown in Figure 2.12, shows how the tasks in your project will be affected if you use the resource-leveling feature in Project 2010.
Figure 2.12. The Leveling Gantt view
Milestone Date Rollup
Use the Milestone Date Rollup view, shown in Figure 2.13, to view your project’s summary tasks on the Gantt chart, with labels for milestones and dates.
Figure 2.13. The Milestone Date Rollup view
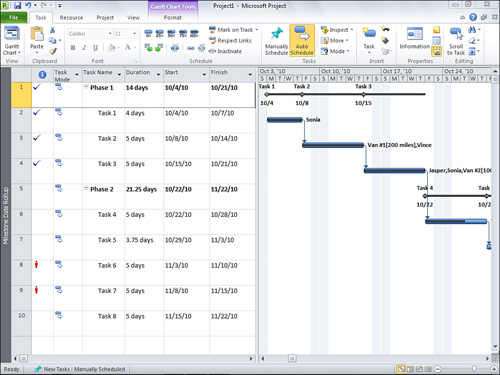
The Milestone Date Rollup view will only display milestones and dates on the summary task Gantt bar if the subtasks are set to roll up to the summary task. Refer to the section, “Roll Up a Subtask,” for information on how to roll subtasks up to the summary task level.
Milestone Rollup
Use the Milestone Rollup view, shown in Figure 2.14, to view your project’s summary tasks on the Gantt chart, with labels for milestones.
Figure 2.14. The Milestone Rollup view
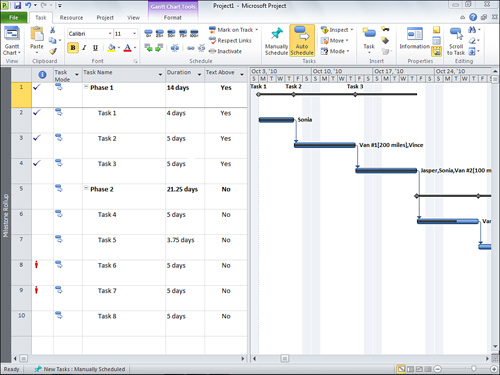
The Milestone Rollup view will only display milestones on the summary task Gantt bar if the subtasks are set to roll up to the summary task. Refer to the section, “Roll Up a Subtask,” for information on how to roll subtasks up to the summary task level.
Multiple Baselines Gantt
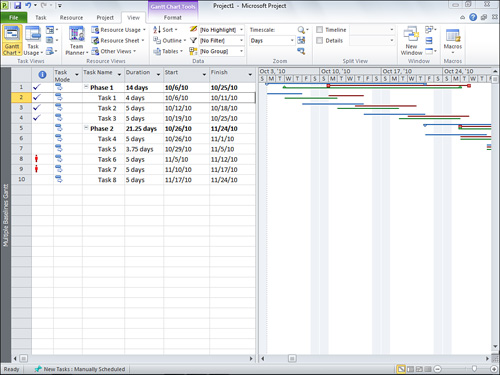
The Multiple Baselines Gantt view, shown in Figure 2.15, displays the dates saved as Baseline, Baseline 1, and Baseline 2, using different colored Gantt bars on the right portion of the view.
Figure 2.15. The Multiple Baselines Gantt view
Network Diagram
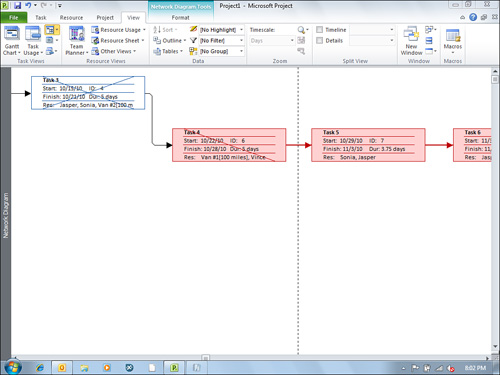
The Network Diagram view, shown in Figure 2.16, displays boxes for each task in your project. When appropriate, the boxes are connected using arrows that show dependencies between the tasks. Tasks on the critical path are highlighted in red. This view may come in handy when you need an illustrated look at how tasks in your project are connected.
Figure 2.16. The Network Diagram view
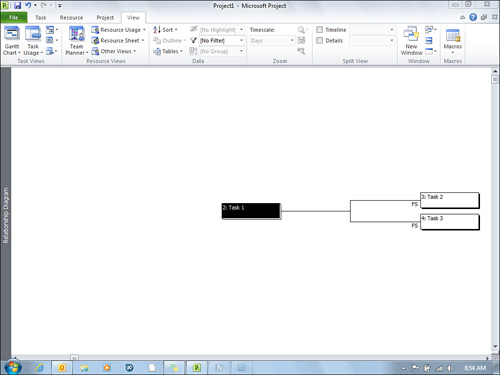
Relationship Diagram
Use the Relationship Diagram view, shown in Figure 2.17, to clarify how a single task relates to other tasks, in projects with many dependencies.
Figure 2.17. The Relationship Diagram view
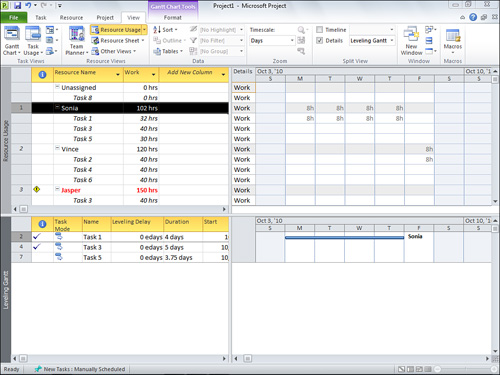
Resource Allocation
The Resource Allocation view, shown in Figure 2.18, is a split view, displaying the Resource Usage view in the top pane and the Leveling Gantt view in the bottom pane.
Figure 2.18. The Resource Allocation view
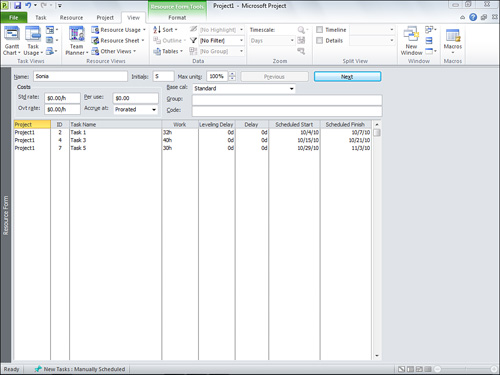
Resource Form
The Resource Form view, shown in Figure 2.19 enables you to view or enter detailed information about each of your project’s resources individually.
Figure 2.19. The Resource Form view
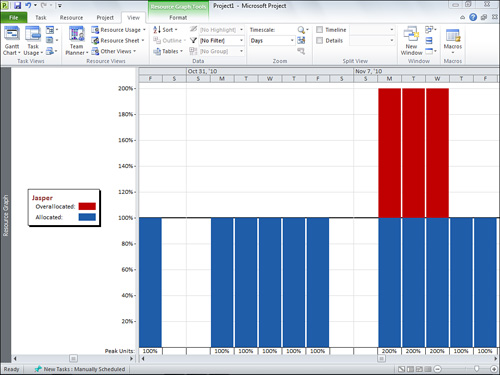
Resource Graph
The Resource Graph view, shown in Figure 2.20, displays a bar graph for each resource assigned to at least one task in your project. The bar graph illustrates allocation, availability, cost, and work details throughout the project’s life cycle.
Figure 2.20. The Resource Graph view
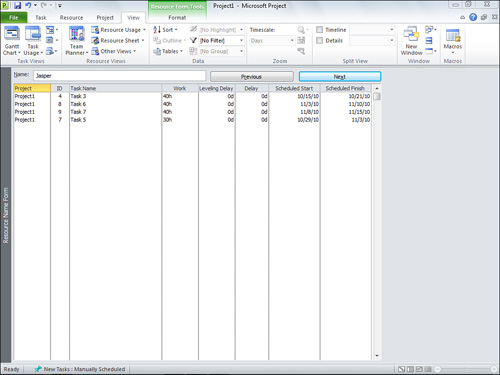
Resource Name Form
The Resource Name Form view, shown in Figure 2.21, enables you to view or enter basic information about each of your project’s resources individually.
Figure 2.21. The Resource Name Form view
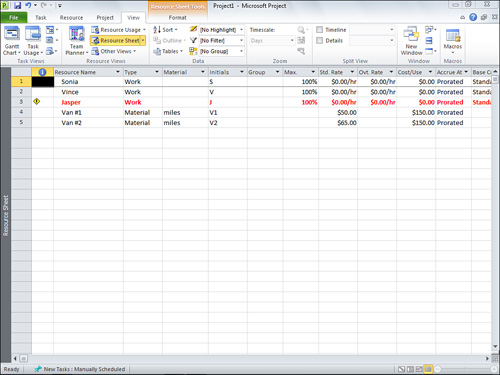
Resource Sheet
Use the Resource Sheet view, shown in Figure 2.22, to enter or review details about the resources that may be assigned to tasks in your project.
Figure 2.22. The Resource Sheet view
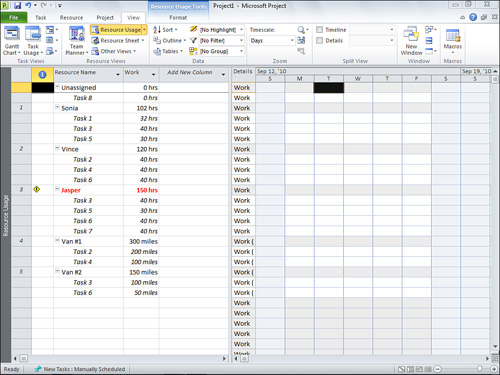
Resource Usage
The Resource Usage view, shown in Figure 2.23, displays task assignments for each resource on the left portion of the view, and the work or cost information about the task assignments over time in the right portion of the view.
Figure 2.23. The Resource Usage view
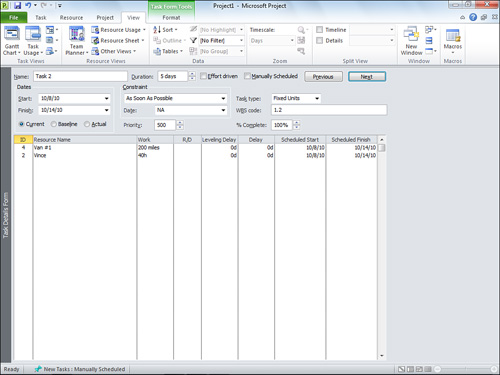
Task Details Form
The Task Details Form view, shown in Figure 2.24, enables you to view or enter detailed information about each of your project’s tasks individually.
Figure 2.24. The Task Details Form view
Task Entry
The Task Entry view, shown in Figure 2.25, is a split view, displaying the Gantt Chart view in the top pane and the Task Form view in the bottom pane.
Figure 2.25. The Task Entry view
Task Form
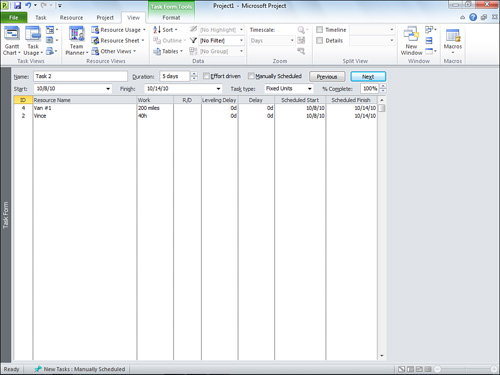
The Task Form view, shown in Figure 2.26, enables you to view or enter basic information about each of your project’s tasks individually.
Figure 2.26. The Task Form view
Task Name Form
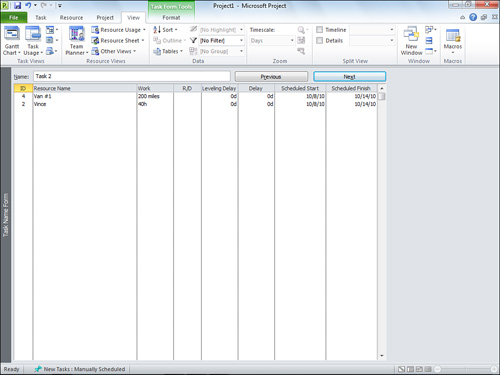
Use the Task Name Form view, shown in Figure 2.27, to view or enter a single task’s assigned resources, predecessors, and successors.
Figure 2.27. The Task Name Form view
Task Sheet
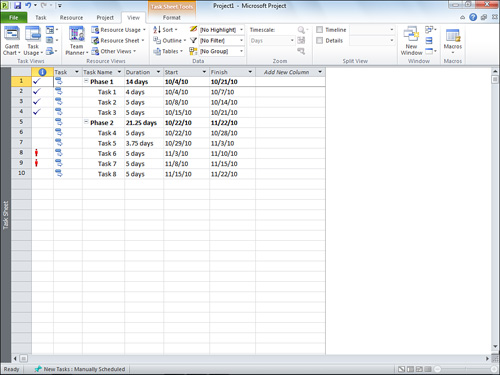
The Task Sheet view, shown in Figure 2.28, enables you to view or enter task information without simultaneously viewing the Gantt chart.
Figure 2.28. The Task Sheet view
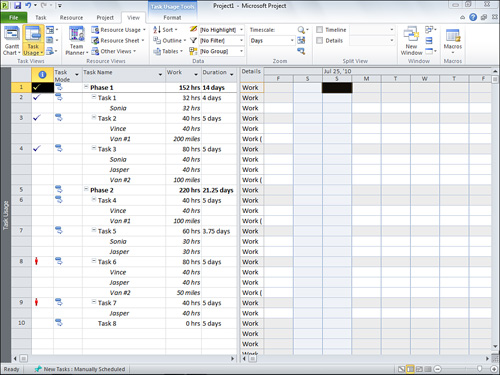
Task Usage
The Task Usage view, shown in Figure 2.29, displays assigned resources for each task on the left portion of the view, and the work or cost information about the resource assignments over time in the right portion of the view.
Figure 2.29. The Task Usage view
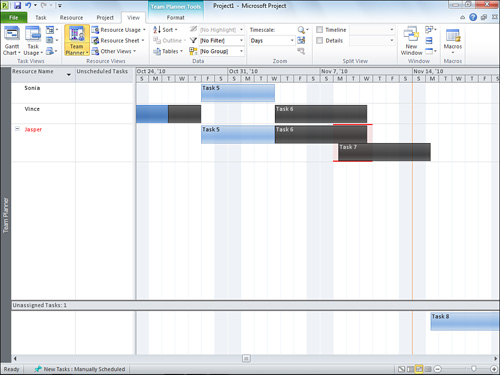
Team Planner
As shown in Figure 2.30, the Team Planner view, available only in Project Professional 2010, provides a visual representation of what the resources in your project are working on, throughout your project’s life cycle. You can drag task assignments between resources to adjust for overallocation or free up some of a resource’s time to make room for other work.
Figure 2.30. The Team Planner view
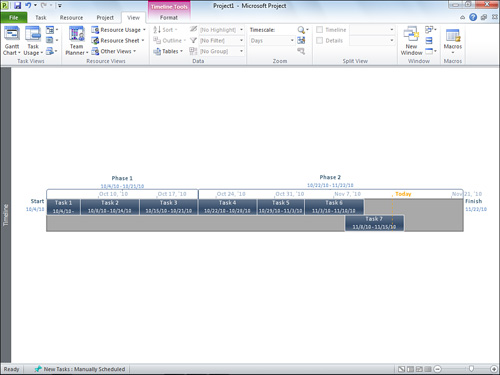
Timeline
The Timeline view, shown in Figure 2.31, illustrates your project’s tasks and dates using a traditional timeline format. It can be customized to display certain tasks as callouts on the timeline, and it can be printed or copied into other applications.
Figure 2.31. The Timeline view
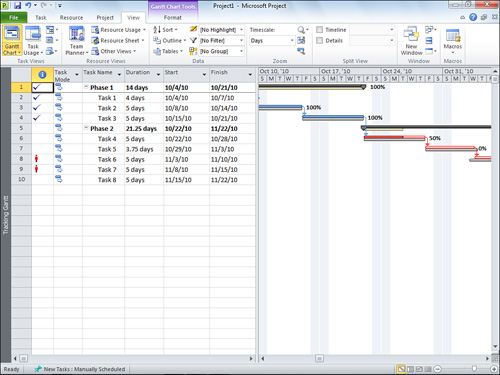
Tracking Gantt
The Tracking Gantt view, shown in Figure 2.32, displays Gantt bars for the baseline dates and the current schedule for each of your project’s tasks. This enables you to quickly see how well your project is tracking to your baseline dates.
Figure 2.32. The Tracking Gantt view
Working with Project Views
After you’ve decided which view you want to use to work with your project, the next step is to group, sort, filter, highlight, or split the view so that you are looking at the right set of data for whatever you’re trying to accomplish.
Show Me: Media 2.4—Group Data in a View
Access this video file through your registered Web Edition at my.safaribooksonline.com/9780132182461/media.
LET ME TRY IT
Grouping Data in a View
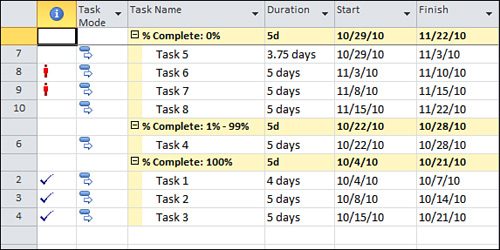
When you group data in a view, you display all tasks or resources with a common factor together. For example, in the Resource Sheet view, you might find it helpful to group the resources by Type, so that all work resources are displayed together, all material resources are displayed together, and all cost resources are displayed together. Figure 2.33 provide another example of grouping, with projects grouped by Complete and Incomplete.
Figure 2.33. Projects are grouped by Complete and Incomplete in the Gantt Chart view.
You can group data in a view in two ways. If the data you want to group is displayed in the view, click the arrow on the right side of the column header, click Group By, and then click the grouping option that meets your needs.
You can also group the data in a view using the ribbon by following these steps:
- On the View tab of the ribbon, in the Data group, choose the criterion you want to use to group data from the Group By list.
- If the criterion you want to group by is not listed, click More Groups if you think the grouping is already set up, or click New Group By to set up a new grouping.
- To set up a new grouping, in the Group Definition dialog box, complete the following:
• Name— Give the grouping a name.
• Show in Menu— Select this check box to display the grouping in the Group By list.
• Group By— Click the Field Name column in the Group By row, and then click the name of the first field you want to group by. Click the Order column in the Group By row to choose whether you want the data in the field you selected to be displayed in Ascending or Descending order.
• Then By— Complete each Then By row, as needed, to create subgroups within each group. For example, if you chose to group by Type, in a resource view, you might find it helpful to create a subgroup within that group to sort by Base Calendar. This would show all work resources, for example, that use a night shift calendar together in a resource view.
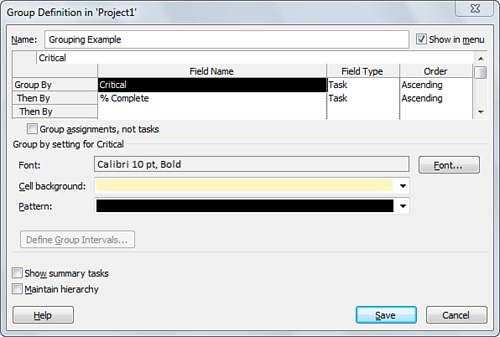
Figure 2.34 shows an example of how to set up tasks to be grouped first by whether they’re critical, and then by their percent complete.
Figure 2.34. The Group Definition dialog box with a grouping example
- Use the plus or minus signs next to the group rollups to expand or collapse each group.
- Click Clear Group in the Group By list to remove the grouping from the view.
Show Me: Media 2.5—Sort Data in a View
Access this video file through your registered Web Edition at my.safaribooksonline.com/9780132182461/media.
LET ME TRY IT
Sorting Data in a View
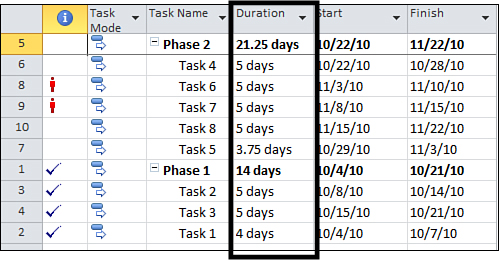
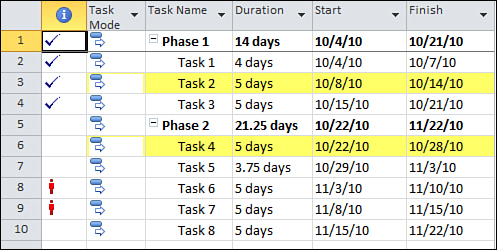
By sorting data in a view, you choose the order in which you want data to appear. For example, you may want a list of names to be displayed in order from A to Z, or you may want a list of dates to be displayed from earliest to latest. Figure 2.35 shows the Gantt Chart view sorted by Duration.
Figure 2.35. The Gantt Chart view with data sorted by Duration
There are two ways to sort data in a view. If the data you want to sort is displayed in the view, you can click the arrow on the right side of the column header and then choose the sort option from the list that appears. For example, if you click the arrow on the right side of the Duration column header, you can choose Sort Smallest to Largest or Sort Largest to Smallest.
You can also sort the data in a view using the ribbon by following these steps:
- On the View tab of the ribbon, in the Data group, click Sort.
- Choose a criterion you want to sort by, or, if none of the existing options meet your needs, click Sort By to create a custom sort order.
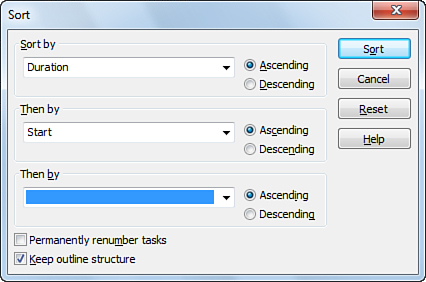
- To create a custom sort order, on the Sort dialog box, choose the first field you want to use in the Sort by list, and then choose whether you want to sort in Ascending or Descending order. If you want to refine the sort order using additional fields, choose those fields from the Then by lists, and choose orders for those fields as well. Figure 2.36 shows an example of a sort order where tasks will first be sorted by Duration, then by Start.
Figure 2.36. An example of setting up a custom order
- Click Sort to sort the view using this custom sort order.
Show Me: Media 2.6—Filter Data in a View
Access this video file through your registered Web Edition at my.safaribooksonline.com/9780132182461/media.
Filtering Data in a View
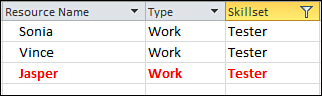
Filtering data can help by narrowing down the data displayed in a view. For example, let’s say you’re trying to find a resource with a particular skillset. If you’ve set Project 2010 up with a field for capturing resource skillsets, you can filter by that field in the Resource Sheet view to see only resources that meet your needs. Figure 2.37 shows this filter applied to the Resource Sheet view, looking only for Testers.
Figure 2.37. The Resource Sheet view filtered to only show resources with “Tester” in the Skillset column
Project 2010 provides two ways to filter data in a view. To filter data that appears in a view, click the arrow on the right side of a column header, click Filter in the list that appears, and then click the filter that you want to apply to the column. You can also use the check boxes that appear in the list to select the data you want to appear. You can filter multiple columns in a view using this method.
You can also filter a view using the ribbon by following these steps:
- On the View tab of the ribbon, in the Data group, choose a filtering option from the Filter list.
- If the filter that you want to apply is not listed, click More Filters if you think the filter is already set up. Otherwise, click New Filter.
- To set up a new filter, in the Filter Definition dialog box, complete the following:
• Name— Give the filter a name.
• Show in menu— Select this check box to display the filter in the Filter list.
• Filter— Complete the first row of the grid to indicate what field you want to filter on and what you want to look for with that field. Choose the field name, test, and value(s) for the filter. For example, if you want to create a filter that looks for cost overages, you might choose Actual Cost in the Field Name column, is greater than in the Test column, and [Baseline Cost] in the Value(s) column. You can include multiple rows in the filter to add conditions and use the And/Or column to indicate whether the filter should include all conditions or just select conditions.
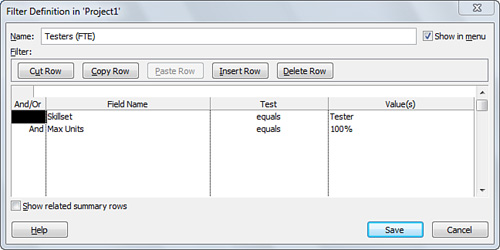
Figure 2.38 shows an example of a filter definition that will show only Testers that have 100% of their time available to your project.
Figure 2.38. An example of a filter definition
- Click Apply to apply the filter to the view, and then click Save to save the filter for future use.
- Click Clear Filter in the Filter list to remove the filter from the view.
Show Me: Media 2.7—Highlight Data in a View
Access this video file through your registered Web Edition at my.safaribooksonline.com/9780132182461/media.
LET ME TRY IT
Highlighting Data in a View
When you’re working with a project, it can be helpful to have certain tasks, dates, or other information called out with a visual indicator for easy identification. Project 2010 enables you to set up data highlight filters based on conditions that you define. Figure 2.39 shows the Gantt Chart view, with tasks using a specific resource highlighted.
Figure 2.39. Tasks with the “Van #1” resource assigned are highlighted.
Here are the steps to follow to highlight data in a view:
- On the View tab of the ribbon, in the Data group, choose a highlight filter from the Highlight list.
- If the highlight filter that you want to apply is not listed, click More Highlight Filters if you think the filter is already set up. Otherwise, click New Highlight Filter.
- To set up a new highlight filter, in the Filter Definition dialog box, complete the following:
• Name— Give the highlight filter a name.
• Show in menu— Select this check box to display the filter in the Highlight list.
• Filter— Complete the first row of the grid to indicate what field you want to filter on and what you want to look for with that field. Choose the field name, test, and value(s) for the filter. For example, if you want to create a filter that highlights tasks that you haven’t baselined, you might choose Baseline Start in the Field Name column, equals in the Test column, and type NA in the Value(s) column. You can include multiple rows in the filter to add conditions, and use the And/Or column to indicate whether the filter should include all conditions or just select conditions.
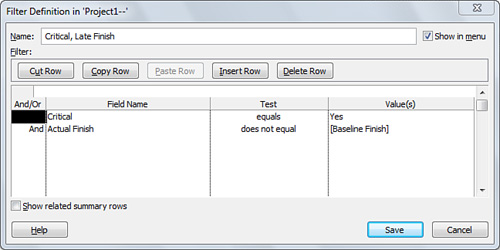
Figure 2.40 shows an example of how to set up a highlight filter for tasks that are critical, and that finished later than planned.
Figure 2.40. An example of the settings for a highlight filter
- Click Apply to apply the highlight filter to the view, and then click Save to save the filter for future use.
- Click Clear Highlight in the Highlight list to remove the filter from the view.
Show Me: Media 2.8—Display Two Views at Once
Access this video file through your registered Web Edition at my.safaribooksonline.com/9780132182461/media.
LET ME TRY IT
Displaying Two Views at Once
At times, it may be helpful to show more than one view in the Project window at the same time. The viewing area of the Project window can be split into two panes. The top pane can contain the Timeline view or another overall view of your project, such as the Gantt Chart view.
When the top pane displays the Timeline view, the bottom pane can display any other Project view. With the Timeline view in the top pane and the Gantt Chart view in the bottom pane, you can drag the highlighted box in the Timeline view horizontally to change the focus of the Gantt chart timeline.
To display the Timeline view, follow these steps:
- On the View tab of the ribbon, in the Split View group, select the Timeline check box.
- Click once in the Timeline view and then use the options on the Format tab to change the display options and data used in the Timeline view.
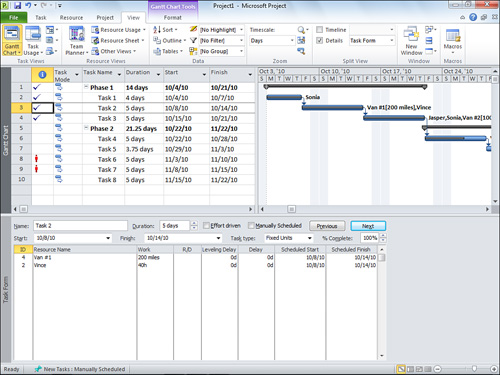
When the top pane displays another overall view of your project, the bottom pane is typically used to display one of the detail views, including the Resource Form, the Resource Graph, or the Task Form view, as shown in Figure 2.41.
Figure 2.41. Display the Gantt Chart view and the Task Form view at the same time to easily enter task details.
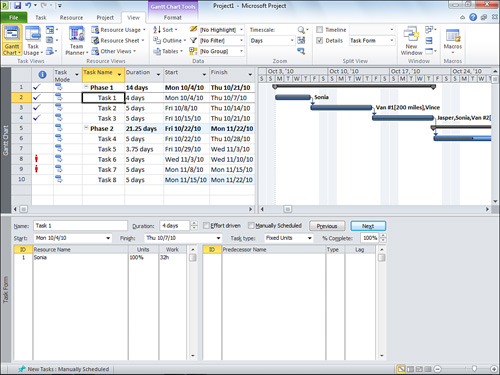
With this configuration, clicking a task or resource in the top pane focuses the details displayed in the bottom pane. For example, if you have the Gantt Chart view displayed in the top pane, and the Task Form view displayed in the bottom pane, when you click a task in the Gantt Chart view, that task’s details are displayed in the Task Form view.
To display a detail view in the bottom pane, follow these steps:
- On the View tab of the ribbon, in the Split View group, select the Details check box.
- Click the name of the detail view you want to display in the Details list.
- To change the display options for either displayed view, click once in the pane that displays the view you want to modify and then click the Format tab.