
9. Customizing Project 2010
This chapter covers how to customize fields, views, and tables in Project 2010.
There are many ways to customize Project 2010 to meet your organization’s needs. Among the more common ways are custom fields, custom tables, and custom views. By customizing these three elements, you’ll be able to capture exactly the information you need and display it in just the way you want using the framework provided by Project 2010.
Tell Me More: Media 9.1—Benefits of Customizing Project 2010

Access this audio recording through your registered web edition at my.safaribooksonline.com/9780132182461/media.
Creating Custom Fields
Custom fields can be used to add information to your project that isn’t captured using the default fields that come with Project 2010. That information might be specific to your project, your team, or your organization, for example.
Show Me: Media 9.2—Create a Custom Field

Access this video file through your registered Web Edition at my.safaribooksonline.com/9780132182461/media.
 LET ME TRY IT
To create a custom field in your project, follow these steps:
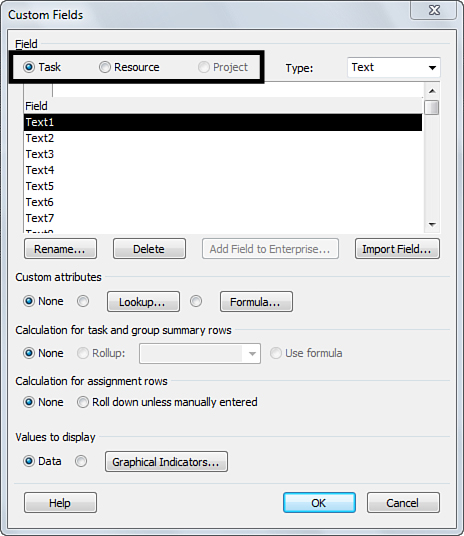
- On the Project tab, in the Properties group, click Custom Fields.
- Choose whether you are customizing a Task or Resource field, as shown in Figure 9.1.
Figure 9.1. Choose from Task, Resource, or Project in the highlighted portion of the Custom Fields dialog box.
- In the Type list, click the type of data you plan to enter in the field you are customizing.
- In the Field box, click the name of the field you are customizing. If the field has a friendly name followed by the original, generic name in parentheses, it is most likely already being used.
- Click Rename, type a new friendly name for the field in the New name for box, and then click OK.
- Under Custom Attributes, if you just want to be able to enter data in the field, leave it set to None. However, if you want to control the data, choose one of the following options:
• Lookup— If you want to choose a value from a list, click Lookup, type each of the list values in the Value column, choose any other options that may make sense for your list, and then click Close.
• Formula— If you want to calculate the value in the field using dates or other project data, click Formula. Formulas can only be used to calculate data for a single task or resource. Formulas cannot reference the values of fields in other tasks or resources. For example, if you create a formula that displays or acts upon the Start Date field, that formula will only be using the start date for the corresponding task.
- Under Calculation for task and group summary rows, choose one of the following options:
• None— Click None if you don’t want the field rolled up to the task and group summary levels.
• Rollup— Click Rollup and choose how you want the rollup calculated if you want the field values summarized at the task and group summary levels.
• Use formula— Click Use formula if you selected Formula under Custom attributes and you want to use that formula for the rollup values for the field you’re customizing.
- Under Calculation for assignment rows, click None if you don’t want the values in this custom field to be spread across assignments or click Roll down unless manually entered if you want the values spread evenly across each assignment. If you choose Roll down unless manually entered, the values will be evenly distributed, but you’ll still be able to manually enter data to refine the distribution.
- Under Values to display, click Data to display the data “as is” or click Graphical Indicators to display an icon based on the data entered in the field. For example, you can assign red, yellow, and green icons to different status descriptors to provide a visual health indicator.
- Click OK to save your custom field.
Show Me: Media 9.3—Graphical Indicators
Access this video file through your registered Web Edition at my.safaribooksonline.com/9780132182461/media.
After you’ve customized a field, you can add it as a column in a view.
Adding and Removing Columns in a View
The process of adding and removing columns in views in Project 2010 is incredibly easy. However, the concept behind what happens sometimes can be confusing, so before we get into how to add and remove columns, let’s talk a bit about what’s going on behind the scenes.
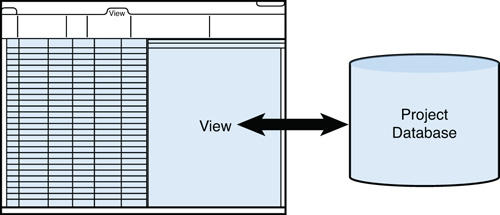
It’s important to remember that behind the shiny interface of Project 2010, there’s a database. A nice, stable, giant database. When you use Project to add information about your project, that information makes its way into that database. In the Project interface, you use views to look at the data in that database, as illustrated in Figure 9.2. Views are set up to slice and dice the information in the database, in a way that helps make sense of it. Columns are just parts of views. They’re a way of surfacing specific parts of the database.
Figure 9.2. The Project window uses views to access data in the Project database.
The confusion around this often comes when you go to remove a column from a view. Let’s say you’ve had a column in a view for a long time and data has been added to the column. You decide you no longer need that data, so you hide the column in the view. Then later, you decide you want to use that column for another purpose, so you add it again, and lo and behold your data is still in there. This sometimes comes as a rude surprise to some Project users, who thought that by hiding the column, the data would go away.
When you hide a column, that’s really all you’re doing. You’re taking that way of viewing information in the database out of a view. Imagine if you were simply trying to change which view surfaced the information. Let’s say you had a column of information in one view, and after you had been using it for a while, you realized it would be better suited for another view. If you had to re-create the column with its data in another view, it could really become quite an effort if you had a large project with several hundred rows of data.
So if columns are just a way to surface information in the database, how do you remove the data from the database altogether? Select the cells in a column that contain the data you want to delete and then press Delete. Got a lot of rows? Click the first cell in the column, scroll to the last row in the table, press and hold Shift, click the last cell in the column, and then press Delete. Poof, your data is gone.
Adding a Column to a View
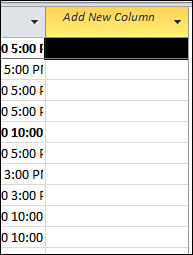
In any view with data displayed in a table, such as the Gantt Chart view, simply scroll to the right side of the table portion of the view and you’ll see the Add New Column header, as shown in Figure 9.3.
Figure 9.3. Click Add New Column to add a column to the current view.
To add a new column, click that header and then click the name of the column you want to add. After the column is added, you can click and drag it to relocate it within the view. Click the new column header to select the column and then use the four-direction arrow cursor to drag and drop the column within the view.
Alternatively, you can add a column exactly where you want it to appear. Right-click the column header for the column that you want to appear to the right of the column you’re adding and then click Insert Column. Click the name of the column to add it to the view.
Hiding a Column in a View
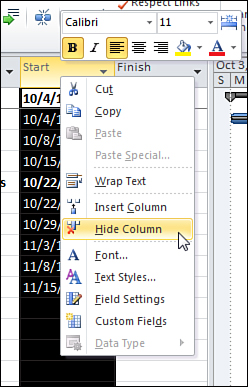
If you want to remove a column from a view without removing the data, click the column header to select the column and then press Delete. Alternatively, you can right-click the column header and then click Hide Column, as shown in Figure 9.4.
Figure 9.4. Right-click a column header and then click Hide Column.
With either of these options, the data that was entered in that column is not removed from your project. I really can’t emphasize this enough. If you want to remove the data, select the cells containing the data and then press Delete. You’ll see the data in the cells is no longer there after you press Delete. If you don’t actually see the data gone from the cells in the column, there’s a good chance it’s still sitting back there in the database. Consider this fair warning!
Saving a Set of Columns as a Table
The set of columns within a view is called a table. For views that contain tables, you can choose from a list of tables to determine what data is displayed. On the View tab, in the Data group, click Table to see the list of available tables for that view. If the existing tables don’t meet your needs, you can create a new table that will be available for use in all task views or all resource views.
There are two ways to create a new table. If you have customized a table in a view by adding or removing columns and you want to save that table as is, on the View tab, in the Data group, click Tables and then click Save Fields as a New Table. Type a name for the new table and then click OK.
Show Me: Media 9.4—Create a New Table
Access this video file through your registered Web Edition at my.safaribooksonline.com/9780132182461/media.
LET ME TRY IT
To create a new table from scratch, follow these steps:
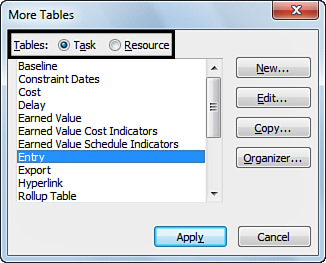
- On the View tab, in the Data group, click Tables and then click More Tables.
- Click Task or Resource, depending on what data you’re including in the new table, as shown in Figure 9.5.
Figure 9.5. Choose whether to include Task or Resource data.
- Click New and then type a name for your new table in the Name box.
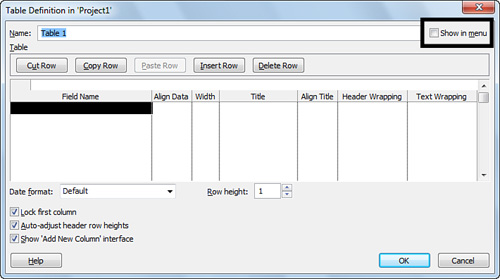
- Select the Show in menu check box, to the right of the Name box (as shown in Figure 9.6), if you plan on using the new table frequently. If you select this check box, the new table is included in the list that appears when you click Tables on the ribbon.
Figure 9.6. The Show in menu check box appears to the right of the Name box.
- Under Table, choose which fields you want to include in the table as columns by filling out the Field Name, Align Data, Width, Title, Align Title, Header Wrapping, and Text Wrapping columns.
- If you’ve included any date fields in the new table, click the Date format list and choose how you want dates to appear in the table.
- Type a number in the Row height box to adjust row spacing.
- Select or clear the Lock first column check box to determine whether you want the first column in the table to be frozen during scrolling.
- Select or clear the Auto-adjust header row heights check box to let Project automatically increase or decrease the height of the header row, based on header text length.
- Select or clear the Show ‘Add New Column’ interface check box to determine whether you want to include the ability to add new columns to the table using the far-right column, labeled Add New Column.
- Click OK to create the new table.
If you selected the Show in menu check box to display the table, on the View tab, in the Data group, click Tables and then click the name of the new table.
If you did not select the Show in menu check box to display the table, on the View tab, in the Data group, click Tables and then click More Tables. Click Task or Resource, depending on which type of table you created. Click the name of the new table and then click Apply.
Creating and Editing Views
If the default views in Project 2010 don’t meet your needs, you can make changes to an existing view or create your own by choosing different display elements, such as a table, a group, or a screen. You can create or edit a single view (in which one view is displayed in the Project window) or a combination view (in which two views are displayed in the Project window at one time).
Show Me: Media 9.5—Create a New View
Access this video file through your registered Web Edition at my.safaribooksonline.com/9780132182461/media.
LET ME TRY IT
Follow these steps to create or edit a single view:
- On the View tab, in the Task Views or Resource Views group, click Other Views and then click More Views.
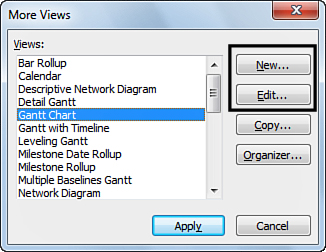
- If you are editing an existing view, click the name of the view in the list (as shown in Figure 9.7) and then click Edit. If you are creating a new view, click New.
Figure 9.7. Click New, or select a view and click Edit.
- If you are creating a new view, on the Define New View dialog box, click Single view and then click OK. If you are editing an existing view, skip this step.
- On the View Definition dialog box, edit the following fields:
• Name— Type a name for the view.
• Screen— Choose what type of view you are creating. If you are editing an existing view, this option cannot be changed.
• Table— Choose what table you want to display in the view, if the view type you selected includes a table.
• Group— Choose how you want to group data in the view, if the view type you selected includes grouping. If you don’t want to group data, click No Group in the list.
• Filter— Choose how you want to filter data in the view, if the view type you selected includes filtering. If you don’t want to filter data, click All Tasks or All Resources in the list.
• Highlight filter— Select this check box to highlight the filtered data, instead of hiding data that doesn’t meet the filter criteria.
• Show in menu— Select this check box to include the view in the corresponding menu on the View tab. For example, if the view type (Screen) is Gantt Chart, the view will appear in the list when you click Gantt Chart on the View tab.
- Click OK to save the view.
LET ME TRY IT
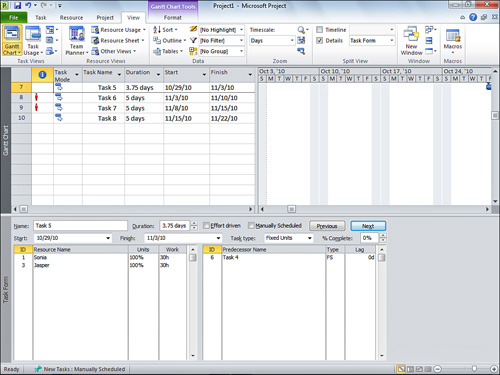
A combination view is a view in which two views are displayed in the Project window at one time. For example, the Task Entry view, shown in Figure 9.8, is a combination view. It displays the Gantt Chart view on the top portion of the screen, and the Task Form view on the bottom portion.
Figure 9.8. The Task Entry view is a combination view.
To create or edit a combination view, follow these steps:
- On the View tab, in the Task Views or Resource Views group, click Other Views and then click More Views.
- If you are editing an existing view, click the name of the view in the list and then click Edit. If you are creating a new view, click New.
- If you are creating a new view, on the Define New View dialog box, click Combination view and then click OK. If you are editing an existing view, skip this step.
- On the View Definition dialog box, shown in Figure 9.9, edit the following fields:
• Name— Type a name for the view.
• Primary View— Choose the view you want to display in the top portion of the Project window.
• Details Pane— Choose the view you want to display in the bottom portion of the Project window.
• Show in menu— Select this check box to include the view in the corresponding menu on the View tab. For example, if the view type for the primary (top) view is Gantt Chart, the view will appear in the list when you click Gantt Chart on the View tab.
Figure 9.9. Define the views to include in the combination view.

- Click OK to save the view.
Another way to save a custom view is to first set up the Project window using the views and tables you want. With your views set up, on the View tab, in the Task Views or Resource Views group, click Other Group and then click Save View. Type a name for the new view and then click OK.