19. Tracking Performance
Posting a video to YouTube is just the start of the marketing process. You need to judge how effective that video is—how many viewers it attracts and how many sales result from those viewers.
Fortunately, YouTube provides a number of metrics you can use to track the performance of each video you post. Read on to learn more.
Why Tracking Is Important
Why should you bother tracking the performance of your YouTube videos? For the same reasons you track the performance of other parts of your marketing mix—to fine-tune your activities to have bigger impact, to measure the effectiveness of your efforts, and to learn from your efforts when planning future activities.
Let’s look at each reason individually.
Fine-Tuning Your Efforts
You don’t have to wait until the end of a campaign to track its performance. In fact, it’s a good idea to look at what’s happening while it’s happening, so that you can make any mid-course corrections that might be necessary.
Let’s say, for example, that you’ve launched a series of YouTube videos but discover, after the first few weeks, that viewership is much less than what you anticipated. Why is this? What do you do about it? Can you tweak upcoming videos to make them more attractive to potential viewers? These are all questions you can answer now, without having to wait until the end of the campaign. Track the performance and make necessary changes along the way—this is how you get the most out of any marketing campaign.
Measuring Effectiveness
At the conclusion of the campaign, you need to measure just how effective it was. Did the campaign meet your goals? Did you achieve the viewership you wanted? Was there the expected increase in sales? And if not, why not?
You need to apply the same sort of scrutiny to your YouTube activities as you do to any marketing campaign. This means setting goals beforehand, and then measuring the actual performance against those goals. Just as important, you need to analyze the results to see why your videos under- or over-performed against expectations. Set a goal, measure performance, and then analyze that performance—that’s Marketing 101.
Planning Future Activities
Finally, you need to learn from your YouTube activities. If your first campaign bombed, figure out why and apply that knowledge to your next campaign. If the campaign was a success, determine what contributed to that success so you can replicate it in future efforts. Each activity you engage in should be a learning experience that informs the next activity, and the one after that. Don’t repeat your mistakes—and don’t abandon your successes.
Tracking Views, Ratings, and Comments
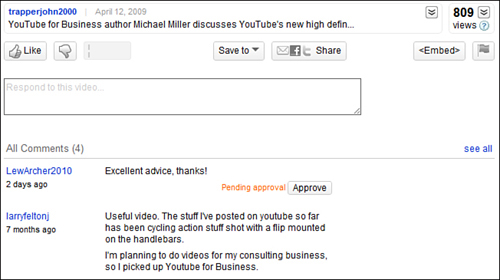
Some of the most important metrics can be found directly under the video player on each video page, as shown in Figure 19.1. Just go to the page for the video you want to track, and look at the key metrics there—views, likes/dislikes, and comments.
Figure 19.1 Viewing views, ratings, and comments.
Measuring Views
The most important metric is the views number—literally, how many times your video was viewed. This number appears directly beneath the video player on the video page.
When it comes to judging this basic performance, how many views is a good number? That’s hard to say. Certainly, if your video gets a million views overnight, you’re doing something right—that’s pure viral status. But, for certain types of videos and businesses, a total of 100 views might be good. (For example, if you’re selling high-priced real estate.) You have to judge performance based on your own parameters, and with realistic expectations.
Tip
![]()
It’s particularly useful to compare views for all the videos in your library. Although raw numbers might not tell you much, comparative numbers tell you which of your videos are performing best and which might need to be replaced.
In my mind, however, raw views is a false measurement. Just because your video has a lot of viewers doesn’t mean that it has accomplished the goals you set out to achieve. A video with 100,000 views is nice, but it means nothing if you wanted to boost your sales and it didn’t do that. Entertaining YouTube viewers is one thing, generating sales (or establishing brand image or whatever) is quite another.
Judging Likes and Dislikes
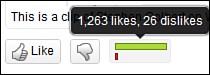
Viewers can rate a video using a thumbs up/thumbs down system—up if they like it, down if they don’t. The likes versus dislikes are graphed on the third button from the left underneath the video; hover over this button to view the graph in color, as shown in Figure 19.2, along with the total number of likes and dislikes. Obviously, the more liked your video is, the better.
Figure 19.2 Viewing likes and dislikes.
Reviewing Comments
Another important metric is represented by those comments left by a video’s viewers. These comments don’t constitute a hard metric, of course, but do represent a source of useful feedback from those who watch your videos. The number of comments indicate the degree to which the video engaged viewers; the content of the comments will tell you what viewers liked or disliked about what they saw.
Tracking Basic Metrics
There’s a lot more you can learn about who has watched your videos. These additional metrics are provided via YouTube’s Insight tracking tool. You use Insight to track viewership of your videos, as well as reveal other important statistics.
To view basic Insight metrics, click the down-arrow next to the Views metric underneath a given video. This displays the Insight panel for that video, shown in Figure 19.3.
Figure 19.3 Tracking basic metrics for a YouTube video.
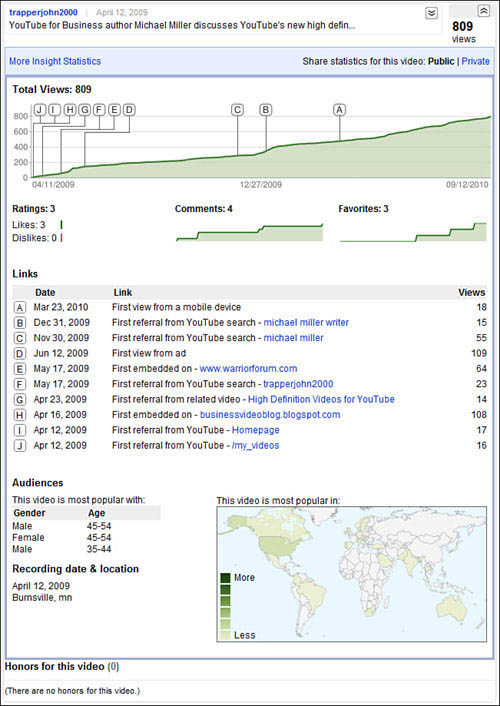
This panel displays a variety of basic performance metrics:
• Total Views. Insight displays the number of views in total, as well as (in graph format) over time. The graph also has several key landmarks noted, as lettered points on the graph. Each letter corresponds to an event in the Links section, further down the panel.
• Ratings. The total number of ratings (both likes and dislikes) your video has received. The number of likes versus dislikes is detailed under the total number.
• Comments. The total number of comment this video has received. The graph beneath this number reflects comments over time.
• Favorites. The number of times this video has been added to a viewer’s favorites list. The graph beneath this number reflects favorites over time.
• Links. These are actually milestones for your video, along the lines of “First view from a mobile device,” “First view from ad,” “First referral from YouTube search,” and so forth.
• Audiences. This section provides a general demographic breakdown of who your video is most popular with—what genders and age groups.
• Recording date & location. This isn’t demographic information per se, but rather the date you uploaded the video and where you uploaded it from.
• This video is most popular in. This is a world map. Countries where your video is most popular are filled in with a darker color.
• Honors for this video. If your video has won any YouTube honors, they’re listed just beneath the Insight panel.
Tracking More Advanced Metrics
If you want more detailed performance metrics, YouTube has them. The best way to access Insight’s advanced metrics for any given video is to click the down arrow next to your name at the top of any YouTube page, then select My Videos. When the next page appears, click the Insight button for the video you want to analyze.
The Insight page features six individual tabs, each focusing on a particular type of data. The tabs for this video are located at the bottom left of the page, as shown in Figure 19.4. We’ll look at each in turn.
Figure 19.4 The tabs on YouTube’s Insight page.
Caution
![]()
Don’t confuse the tabs for the selected video with the tabs in the All Videos section, which display combined metrics for all the videos in your channel.
Views
The Views tab presents a graphical display of the number of views for your video, both over time and by region.
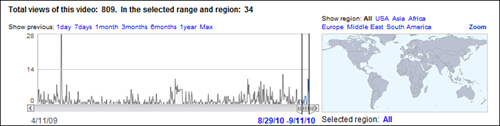
You use the graph and map at the top of the page, shown in Figure 19.5, to designate the time period and region(s) analyzed. Drag the sliders beneath the top left graph to expand or contract the time period; click one or more areas on the map to determine from which regions you wish to include data.
Figure 19.5 Selecting which time period and region(s) to analyze.
Note
![]()
The time and region controls are the same for all insight pages.
Down in the main part of the page, shown in Figure 19.6, the Views graph displays the number of views your video received over the designated period. By default, it shows views per day (Daily Views); however, you can pull down the list above the graph and select Regional Popularity, which alters the graph to show views by region, along with a regional table beneath the graph.
Figure 19.6 Displaying views over time and by region.
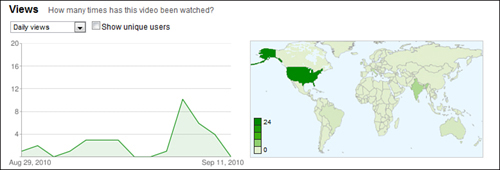
The right graph is a map of the world, with the number of views for your video displayed in different colors for each region. When you click a country or region on the map, the view count for that area appears in Views graph.
Note
![]()
YouTube’s view count data includes views of the video on the YouTube site as well as views from other sites on which the video is embedded.
Discovery
Insight’s Discovery tab, shown in Figure 19.7, tells you how viewers discovered your video. This is a great way to determine where to put your promotional efforts.
Figure 19.7 Using the Discovery tab to determine how viewers are finding your videos.
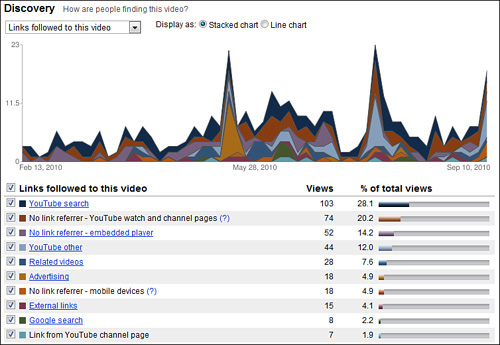
The stacked chart displays views per day, with each color representing a different method of discovery. The table below the chart details the different methods of discovery—that is, the top sources driving viewers to your video. These discovery methods include the following:
• Related videos
• YouTube search
• Google search
• Advertising
• Embedded players (your video embedded on other sites)
• Link from YouTube channel page
• Other links on the YouTube site
• External links
Click a particular discovery method in the table and you’ll see a list of specific items related to that method. For example, if you click the YouTube Search link, you receive a list of the top search queries that found your video; further click a query link to see all the results for that query, and where your video appears on the results list.
Tip
![]()
If you’d prefer to see the location of where the video was viewed—YouTube watch page, YouTube channel page, embedded player, or mobile device—pull down the list above the chart and select Location of Player When Viewed.
Of all these more advanced metrics, I think Discovery might be the most important. It’s key to determine how viewers find your videos; until you know this information, it’s impossible to determine how to promote your YouTube videos.
For example, if you find that the majority of viewers discover a video by searching on Google, you know that you need to optimize future videos for Google search. In this instance, you’re further empowered by Insight’s listing of what keywords your viewers searched for. With this knowledge in hand, you can make sure to include the most popular keywords in the descriptions of subsequent YouTube videos.
Alternatively, you can use the Discovery tool to determine why a particular video performs less well than others. Look at how viewers did (or, more importantly, didn’t) find a less viewed video, and you’ll find out areas where you need to improve. If, for example, a video didn’t pull well via Google search, you know that you need to pay more attention to keywords in future video descriptions.
The key is to determine how viewers find out about your videos—and then exploit that information.
Demographics
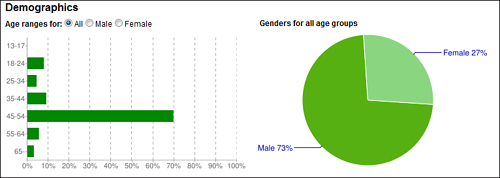
The Demographics tab, shown in Figure 19.8, tells you the age and gender breakdown of the video’s audience. The left hand bar graph displays age ranges; select Male or Female to see age ranges by gender. The pie chart on the right shows the gender breakdown.
Figure 19.8 Using the Demographics tab to look at age and gender data.
Note
![]()
YouTube only knows demographic information for videos viewed on its own site, not for videos embedded on other sites. That’s because it gets its demographic information directly from its own subscribers; the information is only as accurate as what YouTube’s members supply.
Community
The Community tab, shown in Figure 19.9, measures so-called community engagements—ratings, comments, and number of times your video was chosen as a viewer favorite. Pull down the list above the left hand chart to select different engagement metrics.
Figure 19.9 Using the Community tab to evaluate viewer engagement with your video.
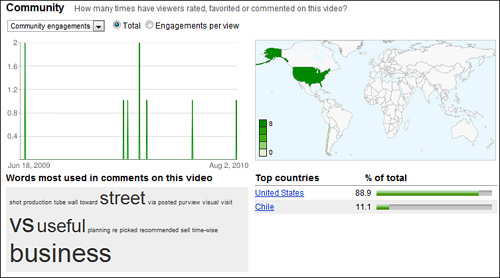
Also of interest is the list of words beneath the graph. This displays, in graphic format, those words most used in the comments about this video. The larger the words, the more often they were used.
Hot Spots
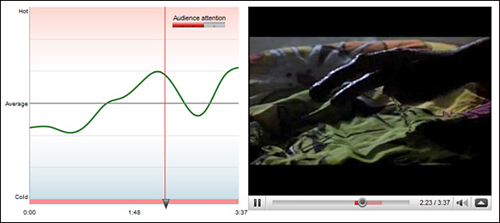
The Hot Spots tab, shown in Figure 19.10, is an interesting one. The graph on the left analyzes how popular your video is over the course of the video—that is, at what point(s) viewers lost interest while watching. You can watch or scroll through the video using the player window on the right, so you can see what exactly it is in the video that people are either liking or not.
Figure 19.10 Using the Hot Spots tab to analyze the most and least popular moments in a video.
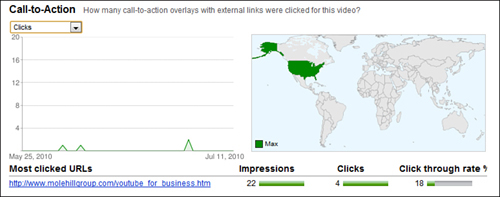
Call-to-Action
This tab is only visible when you’ve promoted a video and added a Call-to-Action Overlay. The graph on the left displays the number of clicks the overlay received during the selected time frame; the table under the graph displays the most clicked URLs in your overlays. You can also pull down the list above the graph to display impressions and click-through-rate—which are also displayed underneath the map on the right.
Figure 19.11 Analyzing the performance of a video’s Call-to-Action Overlay.
Tracking Effectiveness
The number of views a video obtains isn’t necessarily indicative of how effective it is. A video might gain a huge viewership but result in few sales or little brand awareness; conversely, a video with a small number of viewers might result in much higher sales or brand awareness.
Tracking the effectiveness of a video is more difficult than tracking simple viewership. No analytical tools measure this metric; in fact, it’s more of a black art than it is a science. With that caveat, there are ways to get a general handle on how effective a video is.
Tracking Interactivity
One measure of effectiveness is how well the video involves the viewers—that is, how viewers interact with the video. You can deduce the level of interaction from the number of comments and video responses left by viewers. The more that the video draws in viewers, the more viewers leave personal comments and responses.
Think of it this way. If your video is just a light entertainment, viewers will likely not be inspired to leave comments. If, on the other hand, your video proves particularly useful or educational, viewers are more likely to leave comments to that effect. The more comments you get, the better the video is at involving the viewer.
On a meta level, you can track the effectiveness of all your videos in total by noting the number of subscribers you get to your YouTube channel. If your videos connect with viewers, they’re more likely to subscribe to your channel to get notice of future videos. If your videos are less effective, viewers are less likely to subscribe.
Tracking Traffic
If you’re using your YouTube videos to sell products or services directly from your website, the best way to measure the effectiveness of each video is simply to track traffic from each YouTube video back to your site. There are a number of ways to do this.
Note
![]()
Most website-hosting services provide their own traffic analysis tools. You can also use a third-party tool, such as Google Analytics or Webmetrics, to do the tracking.
Just about any website analysis tool will show where your site traffic comes from—that is, the previous sites viewed by your site’s visitors. By using this type of tool, it’s easy enough to track the traffic from the YouTube site (www.youtube.com) to your site. If you see a spike in traffic from YouTube after you post a new video, it’s a good bet that the traffic was driven by that video.
More sophisticated website analysis tools track traffic from specific pages on the originating site. This makes it even easier to determine which videos are driving the most traffic back to your site.
Alternatively, you can include a special code for each video you upload to YouTube. The easiest way to do this is to display a unique URL for your main site in each YouTube video; the URL should lead to a unique landing page on your website. For example, you might create a series of landing pages for each of your videos, with URLs such as www.yourwebsite.com/youtubepromo01/, www.yourwebsite.com/youtubepromo02/, www.yourwebsite.com/youtubepromo03/, and so on. This makes it easy to track hits on each specific landing page, providing a detailed analysis of the effectiveness of each originating video.
Tracking Conversions
Another way to measure video success is to determine what kind of response you want. Is the video designed to generate direct sales, either via your website or 800-number? Is the video designed to drive traffic to your website? Is the video designed to enhance or reinforce your company or brand image? Or is the video designed to reduce customer or technical support costs?
This is key—to measure the success of your YouTube video, you have to first determine what it is you hope to achieve. Then, and only then, can you measure the results:
• If your goal is to generate sales, then measure sales. Include your website URL and 800-number in the video, along with a promotion or order code, and then track sales that include that code.
• If your goal is to drive traffic to your website, then measure your traffic pre- and post-YouTube video. Use web analytics to determine where site traffic originates from; specifically track that traffic that came directly from the YouTube site.
• If your goal is to build your brand image, measurement is more difficult. You’ll need to conduct some sort of market research after your YouTube campaign has had a chance to do its thing, and ask customers what they think of your brand—and where they heard about it.
• If your goal is to reduce customer or technical support costs, measure the number of support requests before and after uploading the YouTube video(s). The more effective the video, the lower the subsequent calls for support.
You get the point. Know what you want to achieve, and then measure that metric. You might find that a video that outperforms its siblings in terms of views doesn’t actually deliver the conversions you were seeking—or vice versa.
Tracking Direct Sales
If you’re in the business of selling stuff online, the ultimate measure of a video’s effectiveness is how many sales directly result from the viewing of that video. Determining which sales result from which videos is a simple tracking issue. Assign each video a special tracking code, and include that code in the video’s text description and onscreen information screen. Encourage customers to enter that tracking code on your product purchase or checkout page, and you’ll know from which video the sale came.
What’s a good conversion rate? That’s entirely within your judgment; for some companies, converting 1 sale per 100 views is good performance, whereas other companies might be satisfied with a 1 in 10,000 conversion rate. It all depends on the type of product you sell.
In any instance, the total number of conversions might be less important than comparing the conversion rates of different videos. If one video has a 0.1% conversion rate and another a 0.5% rate, you know that second video is five times more effective than the first one. Knowing that, you can then analyze the why behind the numbers—what it was about that second video that drove more viewers to become paying customers.
With this knowledge in hand, you can better focus future videos to include the elements that made the second video more effective. And that’s the key: To learn from what you’ve done to become more successful going forward.
The Big Picture
One of the great things about online videos is that it’s easy to track how successful they are. YouTube includes a wealth of tools that tell you how many people view each video, how they found it, and how your videos compare to other videos on the site. You can supplement YouTube’s statistics with data from your own website to judge which YouTube videos are driving the most traffic back to your site.
Ultimately, however, you want your YouTube videos to result in increased sales for your products and services. Tracking direct sales is easy enough (by embedding some sort of unique tracking code in each video), but almost impossible if your products are sold via traditional retail or wholesale channels. That said, you can get a hint of how well your videos work by talking directly with your customers via surveys and the like; you can gain much knowledge by simply asking your customers, “Have you seen our videos on YouTube?”
The point is to do more than just post videos on YouTube; you want to post effective videos. The only way to do that is to track each video’s performance and learn from what you discover. Use all the tools at your disposal (from YouTube and other services) to gather all the data possible, and then determine what makes one video more effective than another. That knowledge is power—and the way to make YouTube an even more effective part of your marketing mix.