
Chapter 13. Advanced LightSwitch with Visual Studio 2010
In This Chapter
• Managing the Application Life Cycle with TFS 2010
• Unit Testing Your Helper Code
• Analyzing the Execution Flow with IntelliTrace
If you installed Visual Studio LightSwitch over Visual Studio 2010 Professional or higher, you can take advantage of some tools that will make your development experience even more productive. Unfortunately, LightSwitch projects do not support the whole range of tools offered by Visual Studio 2010, such as analysis tools. By the way, you can use Visual Studio 2010 and Team Foundation Server 2010 together if you work inside a team, to utilize the entire application management life cycle instrumentation. In addition, with some special techniques, you can use unit tests against the code you write in LightSwitch.
This chapter focuses on tools that are specific to Visual Studio 2010 and that you can also use in the LightSwitch development process.
Managing the Application Life Cycle with TFS 2010
It is not unusual within companies for developers to work in teams. Every team has a coordinator who is responsible for the timeline of the application development process, and developers on the team need to interact with one another in several ways to solve any number of issues. To help teams build high-quality applications, Microsoft released Team Foundation Server (or simply TFS), a product that facilitates collaboration among members of development teams. The latest version of TFS available is 2010. TFS is a specialized tool for managing the entire application life cycle, from the architecture to the deployment, including intermediate steps such as testing and builds. Among the available instruments, the most important in Team Foundation Server are the following:
• Source control enables you to synchronize source code files edited by different people in the development team
• Version control, which acts as a repository of incremental versions of the code
• Work items, a number of “to do” tasks that are assigned to specific members of the team (such as implementations, bugs, issues, and so on) and that make it possible to keep track of the development process according to the requested timeline
• Test automation, a service that enables you to execute unit tests in the project and UI tests
• Build automation, a service that is responsible for creating builds at specified intervals
TFS is available in different configurations, so you should choose the one that best fits your scenario. Starting from version 2010, Microsoft introduced the Basic configuration, which enables you to install TFS onto client operating systems such as Windows Vista with Service Pack 1 and Windows 7. This configuration is optimal for single developers or small teams and is appropriate if you want all the benefits from TFS on your development machine.
The great news is that you can use TFS from Visual Studio LightSwitch. This can dramatically improve your productivity, especially if you work on a team. You might also find TFS useful if you are a single developer because it enables you to manage your projects in a completely different way by taking advantage of all the aforementioned instrumentation. Actually, using TFS 2010 from LightSwitch is not only available in Visual Studio 2010 Professional or higher, but this is considered an advanced topic and is why it is discussed in this chapter.
Of course, this chapter is not intended to be a guide to TFS 2010, so we assume that you have already installed and configured at least the Basic Edition on your development machine or onto a different computer (such as a server). Information about available configurations and about installing and configuring the environment is available in the official MSDN documentation: http://bit.ly/dtjOzF.
In this chapter, you learn how to manage your LightSwitch projects with TFS—everything from creating a new team project to the final build automation. Notice that Visual Studio LightSwitch version 1 is intended for small development teams, often only a programmer, so Microsoft did not prioritize features discussed here. However, what you learn in this chapter will enable you to get the most out of Visual Studio 2010 and related tools.
Using the Invoice Management Project
To explain concepts related to TFS 2010, this chapter uses the first version of the Invoice Management project example as it was created back in Chapter 8, “Aggregating Data from Different Data Sources.” This is for the sake of clarity, but all the concepts that you learn in this chapter can be applied to any kind of projects in Visual Studio 2010.
Connecting to Team Foundation Server
After you have opened your project in Visual Studio LightSwitch, the first step is to connect to an instance of TFS. Notice that you cannot connect to multiple servers concurrently. To connect to TFS, click Team, Connect to Team Foundation Server. This launches the Add/Remove Servers dialog, shown in Figure 13.1.
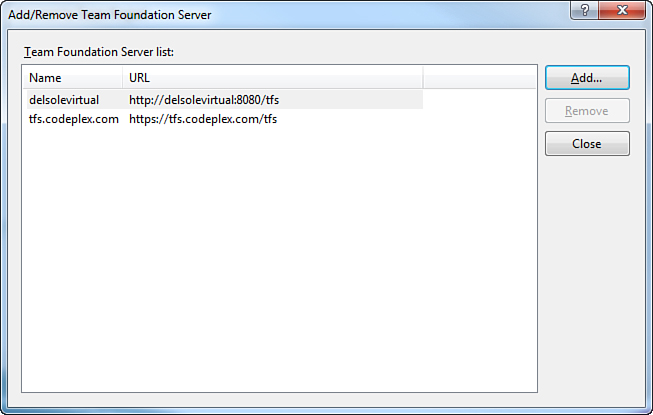
Figure 13.1. Showing the list of available servers.
If it is the first time you are connecting to TFS, the dialog is empty and you must click Add to specify a new server to connect to. You can specify connection parameters in the Add Team Foundation Server dialog, as shown in Figure 13.2.
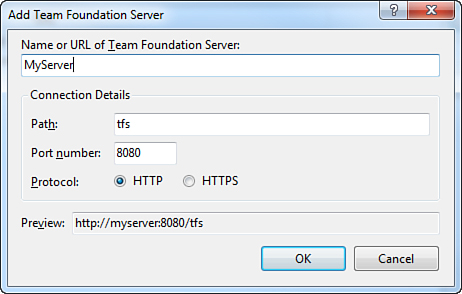
Figure 13.2. Specifying connection parameters for TFS.
The name or the URL of the TFS must be provided by your system administrator. If you installed TFS on your own, the URL was provided during the setup process. You can also recover it by opening the Administration Console from the Windows Start menu. Click OK after you have entered the required parameters. At that point, the newly added server will be listed in the Add/Remove dialog, as shown previously in Figure 13.1. By clicking Close, you can access the Connect to Team Project dialog. A team project must not be confused with a project in Visual Studio; team projects are like containers of multiple Visual Studio solutions and offer all the instruments described at the beginning of this chapter to developers on the team. Team projects are organized within team project collections. As the name implies, a team project collection is a container of team projects and allows better arrangement of team projects. The reason for this complex structure is that TFS was architected for large teams and for scenarios in which each team can work on a number of different projects; in this way, TFS can better organize projects per team.
When you install TFS, the environment creates a default, empty team project collection called DefaultCollection, but you can certainly create additional collections according to your needs. For the current example, select the default collection, as shown in Figure 13.3.
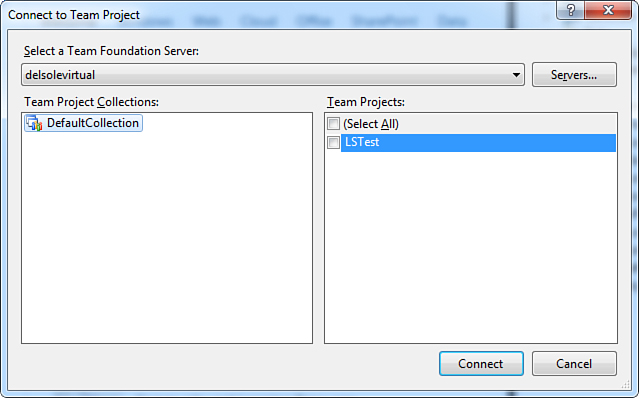
Figure 13.3. Selecting a team project collection.
When you select a project collection, Visual Studio LightSwitch also displays the list of existing team projects in the collection (if any). You do not need to select any of the existing team projects at this point. Just click Connect so that Visual Studio LightSwitch connects to the specified instance of TFS. After a few seconds, a tool window called Team Explorer appears (see Figure 13.4).
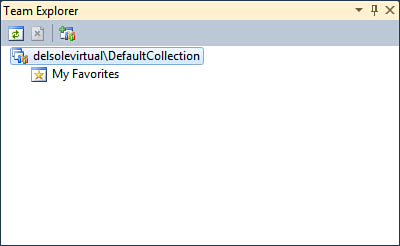
Figure 13.4. The Team Explorer window.
Team Explorer is a special tool window that provides access to the most common features in both team project collections and team projects. At this point, you have successfully connected to the default team project collection in TFS 2010, but you still need a team project that the sample application will be associated with.
Creating New Team Projects
Creating a new team project can be done in the Team Explorer tool window. Here you right-click the root element and select New Team Project. Doing so launches the New Team Project dialog. Just specify the project name and description, as shown in Figure 13.5.
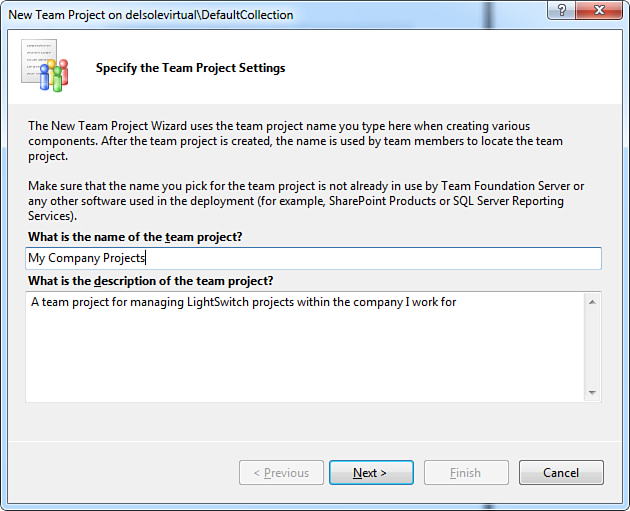
Figure 13.5. Entering summary information for the new team project.
For your convenience, both the name and description should explain what the team project contains. When you click Next, you are asked to specify the process template that will be used to create the team project. Process templates provide the appropriate support to the development methodologies adopted for the project. There are two default templates:
• MSF for Agile Software Development v5.0: This process template is appropriate with small and medium projects and is optimized for the Agile methodology.
• MSF for CMMI Process Improvement v5.0: This process template is appropriate with large projects that require more-complex decisions and therefore a more-complex infrastructure.
If you want to explore additional templates, click the Download Additional Process Templates Online hyperlink at the bottom of the dialog. Leave unchanged the default selection on the Agile template and click Finish.
If you click Next rather than Finish, you can change folders for the source control and for the branching feature in TFS. After that, the very last dialog will show summary information about the new team project. Because configuring source control folders and branching is not required in the current scenario, you can skip this step.
At this point, after a few seconds the new team project will be available in Team Explorer, and you will see the list of items that you can interact with, such as Work Items, Builds, and Source Control (see Figure 13.6).
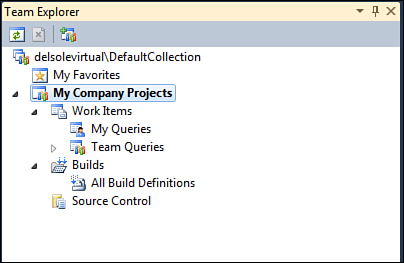
Figure 13.6. The new team project is available.
The great benefit of team projects is that developers (or their manager) can interact with work items and the other tools without having to open the source project. The reason is simply that all the information related to the application life cycle is stored in TFS. Creating a team project is a required step, but it is not the last one. Now you have to associate the current sample project with the team project.
Submitting Projects to Source Control
Submitting your project to the TFS source control is the way you associate the LightSwitch project to the team project.
A source control mechanism is basically a tool that manages changes to source code within an environment in which multiple users can change the same code files. The source control is then able to block concurrent access to code files, to keep track of all changes, and to provide a comparison mechanism to show changes made by different users. In addition, the source control enables you to revert to a different version of the code. Lots of source control tools exist, but the one included in TFS 2010 is very sophisticated and provides deep control over changes to the source code.
You accomplish this by right-clicking the project name in Solution Explorer and then selecting Add Solution to Source Control, as shown in Figure 13.7.
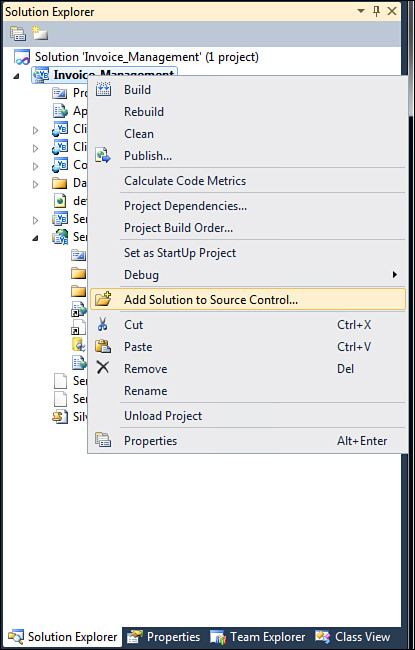
Figure 13.7. Adding the current solution to source control.
This works with both the Logical View or the File View enabled in Solution Explorer. After a few seconds, Visual Studio will ask to specify the folder where the solution will be placed, providing a default name but leaving an option of changing such a name and of creating nested subfolders, as you can see in Figure 13.8.
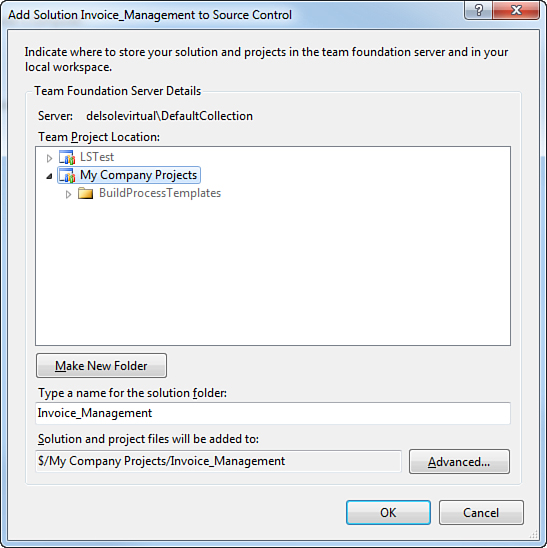
Figure 13.8. Specifying the folder name for the Source Control.
After you click OK, the solution is added to the TFS source control; this is demonstrated by the + yellow symbol appearing near the solution and the project name, if you enabled the Logical View, or near every item in the solution if you enabled the File View. The + symbol indicates that an element in the solution has been added to source control. Other members in the development team now need to open the solution from the server instead of from the local disk. To accomplish this, follow these steps:
1. Select File, Source Control, Open from Source Control.
2. Select the team project in the Open from Source Control dialog (see Figure 13.9), select the folder containing the solution, and select the .sln solution file.
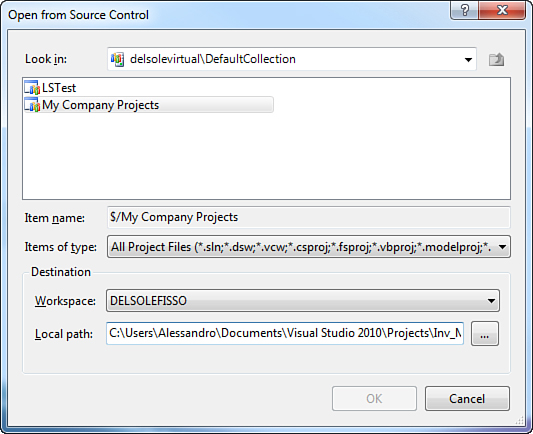
Figure 13.9. Opening a solution from source control.
3. In the same dialog, specify a local path where the solution will be downloaded to and click OK.
Now that the project is under the source control, it is time to understand how this works. You now learn about check-in and check-out; later you learn how the source control handles changes to code files.
Understanding Check-In, Check-Out, and Handling Changes in the Code
When you add a project to source control, you are still working against the local copy of your solution. Therefore, you need to send to the server running TFS the entire solution. This step is called check-in and is basically the action that sends changes on the local copy to the source code repository on the server. You discover later that the check-in also merges changes from different users, other than merely sending files to the server, but the first time that you make a check-in you write to the server all the content of the local copy. To perform check-ins, right-click the solution name in Solution Explorer and click Check-In. This action launches the Check-In - Source Files dialog, which lists all files in the solution but automatically selects files that have been modified during the development experience. Figure 13.10 shows what the dialog looks like at this point.
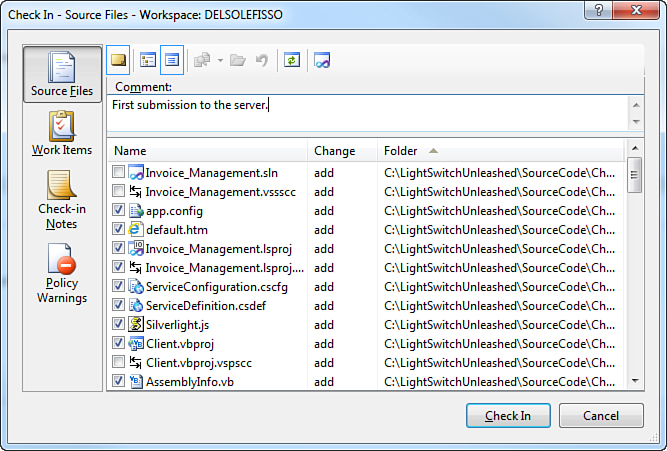
Figure 13.10. Ready for your first check-in.
Because this is your first check-in, ensure that also the solution (.sln) file is selected. Notice that you can add a description of the check-in in the Comment text box. This is very useful, and you should always add a description because it will help other users understand what changes you did to that set of code files and will be also useful when retrieving project versions from Version Control. If you click the Change to Folder View button on the toolbar, you will see files organized by project instead of a simple list of files. Also, you can
• Associate work items to the current check-in by clicking the Work Items button. Work items are described in the next section.
• Specify people responsible of specific tasks, such as the code review, by clicking the Check-In Notes button.
• Ensure that the current set of files does not violate any check-in policies (usually set by the administrator), by clicking the Policy Warnings button.
When ready, click Check In. This action submits all files to the server and merges files edited by the current user with changes submitted by another user. In the end, the solution will be available to other developers from source control. The group of files submitted to the server within the same operation is known as a changeset. The concept of changeset will become more clear when you read about version control later. For now, just keep in mind that each changeset represents the group of files edited between one check-in and another one. When the operation completes, you will notice that in Solution Explorer, the + symbol is replaced with a padlock symbol. Therefore, elements in the solution are no longer available for editing unless you require a check-out. A check-out operation updates the local copy of the project with files available on the server and allows editing the local copy until a new check-in is required. When a new check-in is performed, edits are updated to the server and made available to others. You are not required to perform check-ins every time you make edits to the local copy. For instance, you could submit your changes at the end of your daily work.
All these concepts will be now demonstrated with examples. For instance, suppose you want to edit the source code for the SortedCustomersQuery data source, and then you want to submit changes to the server. The first thing you have to do is unlock code files by performing a check-out. You can do so by just right-clicking the project name in Solution Explorer and selecting Check-Out for Edit. At this point, the Check Out dialog appears, showing the list of files that can be checked out and edited, as shown in Figure 13.11.
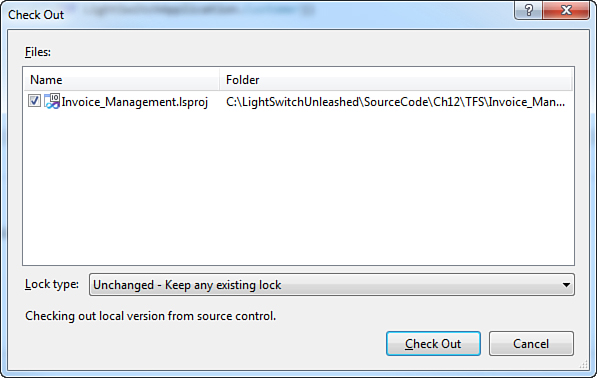
Figure 13.11. Checking out files for edit.
In this particular case, the only file that can be unlocked is the project file (.lsproj) because no other files have been edited previously. This is a behavior specific to LightSwitch. In Visual Studio 2010, you would instead see the complete list of code files, but this makes sense because in LightSwitch you only need to edit the code you write, not the code generated by the IDE. Click Check Out so that you can start making edits to the project. Now it is time to edit SortedCustomersQuery, as decided before.
Actually, there is a simpler way to perform check-outs on single files. When you begin making changes to a file in the project (including both source code and screens), Visual Studio LightSwitch automatically checks out that file for you (in the current example, the ApplicationDataService.vb file). If you instead need to check out multiple files, you need to make it manually.
Start by following these steps:
1. In Solution Explorer, expand the Data SourcesApplication Data element.
2. Expand Customers and double-click SortedCustomersQuery.
3. When the Query Designer appears, click Write Code on the toolbar.
At this point, locate the SortedCustomersQuery_PreProcessQuery method and add an Order By clause, as follows:
Private Sub SortedCustomersQuery_PreprocessQuery(ByRef query _
As System.Linq.
IQueryable(Of _
LightSwitchApplication.
Customer))
query = From cust In query
Select cust
Order By cust.CompanyName
Order By cust.Country
Order By cust.City
End Sub
This is just an example of editing an element in the project and is enough to explain how source control merges changes, but of course, you could edit multiple files. Now you can perform a new check-in. In Visual Studio, you have another opportunity, which is represented by the Pending Changes tool window (View, Other Windows, Pending Changes). As you can see in Figure 13.12, such a tool looks similar to the Check-In dialog, but it also enables you to display conflicts between source files, if any.
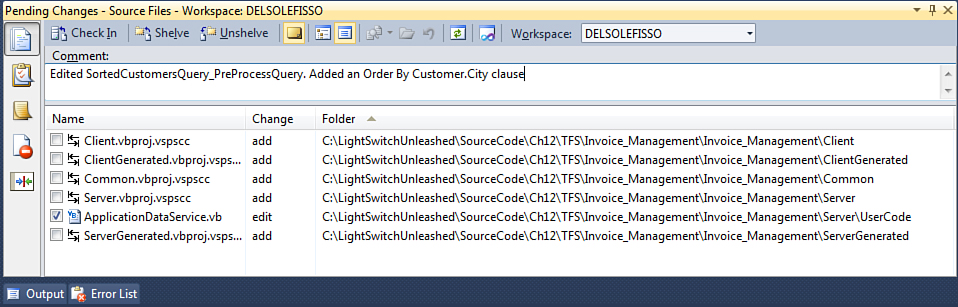
Figure 13.12. Pending changes over the current solution.
Provide your description and click Check-In. Doing so submits the new changeset to the server, making it available to other developers on the team.
Changeset History and File Comparison
You might appreciate using source control only when you discover features of this tool. For example, suppose you want to see the list of submissions you made to the server. In Team Explorer, double-click the Source Control element. This action shows the Source Control Explorer window, as shown in Figure 13.13.
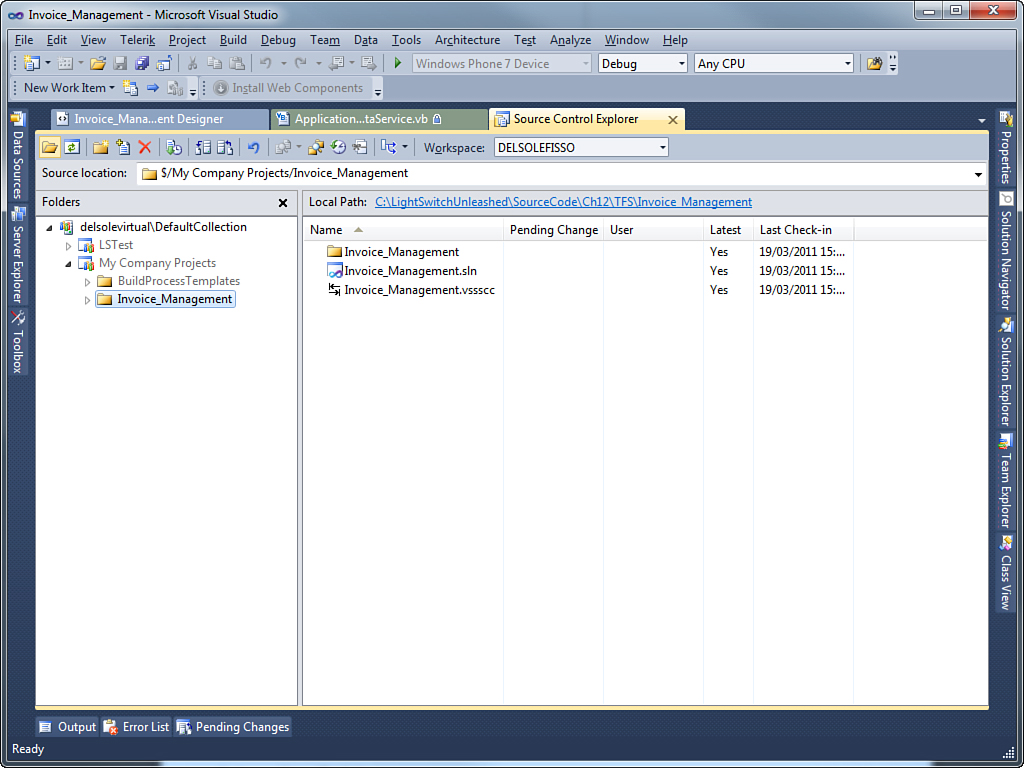
Figure 13.13. The Source Control Explorer window.
This window provides simplified access to most features in the source control mechanism offered by TFS. Each instrument in the window applies at the team project level and at the single-solution level. For example, suppose you want to retrieve the list of check-ins for the current sample application. In the Folders box, expand the My Company Projects node and select Invoice_Management. Then, right-click the project name and select View History. Doing so launches the History window, which displays the full list of changesets available in the current project, as shown in Figure 13.14.
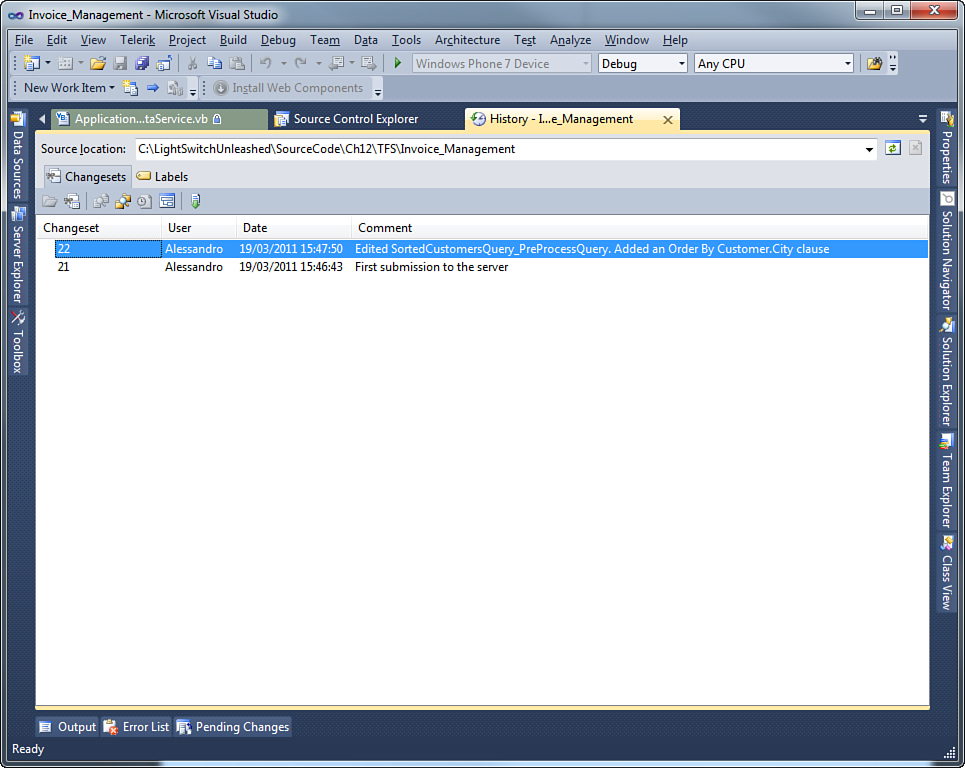
Figure 13.14. The history of changesets.
By taking a look at this window, you realize why providing a description when checking in is so important. In fact, this allows you to immediately understand what a changeset refers to and becomes even more important when changesets become hundreds. You can get detailed information for each changeset by selecting one and clicking the Changeset Details button on the window’s toolbar. Figure 13.15 shows the result of this action against the latest changeset.
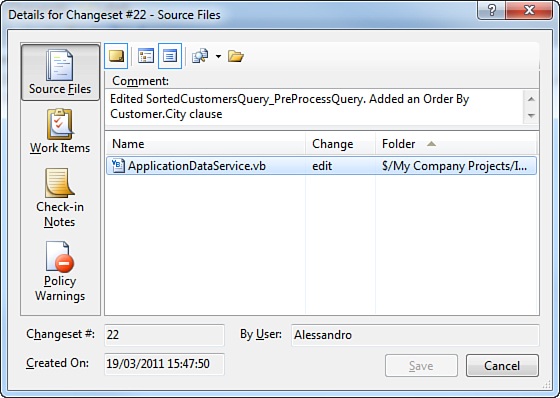
Figure 13.15. Showing changeset details.
As you can see, the dialog shows the list of files that were edited in that changeset and other information such as the creation date and author. Now suppose you want to compare a file to a previous version. In our example, you might want to compare the source code for the ApplicationDataService.vb file for the selected changeset with its previous version. To do so, follow these steps:
1. Right-click the ApplicationDataService.vb code file in the list.
2. Select Compare, With Previous Version.
At this point, the IDE shows a window organized into two columns. In the left column, you can see the older version. In the right column, you can see the current version (see Figure 13.16). Notice how the IDE highlights in green the new line of code that was added to the latest changeset. Other supported highlights are for text deletion (in red) and for text replacements (blue).
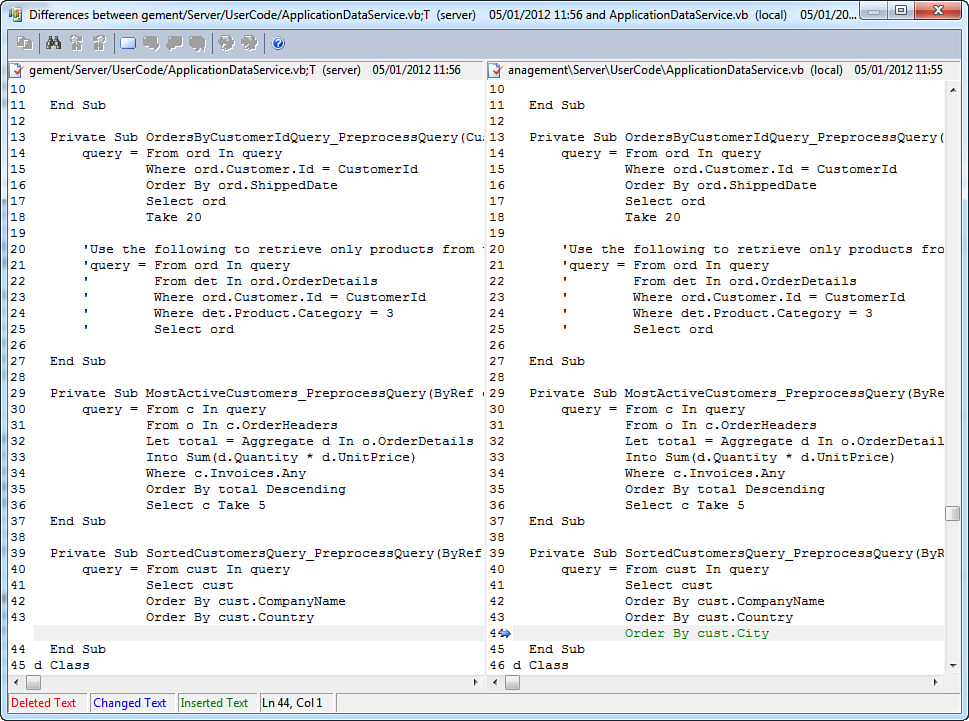
Figure 13.16. Comparing source code from different changesets.
This instrumentation can be particularly useful to examine changes made by other developers. Now that you know how to examine the source control history and to get changeset details, including comparisons, it is time to learn how to improve the productivity process with work items.
Check-In Unleashed
Performing a check-in action over a LightSwitch solution does not usually require manual actions because the majority of changes impact the application’s definition file (.lsml). The reason is that everything else is generated in code. However, changes sometimes affect part of the application that requires additional, manual actions and check-ins. Such situations can be summarized as follows:
• Modifying an intrinsic entity’s schema causes the development database to be modified. This includes adding or removing properties or changing data types.
• Adding code through the designers to a screen, query, or entity requires the code in the UserCode folder of either the client/server to be checked out.
• Adding a custom control may require that the Client and ClientGenerated projects are checked out. This is why you might need to add a reference to the custom control library to the projects.
• Adding extensions potentially requires some of the project files to be checked out.
• Adding custom code files requires the code file and the project file to be checked out.
If one of these situations occurs, checking in from the Logical View is not enough. Although the Check-In Source Files dialog shows you the physical files that need to be checked in (see Figure 13.10), it is a good idea to switch from the Logical View to the File View in Solution Explorer so that you have a better representation of what it is going to TFS. Table 13.1 summarizes which files must be checked in manually. (If no project is specified, we are assuming that the file belongs to the previously mentioned project name.)
Table 13.1. Files to Check In Manually
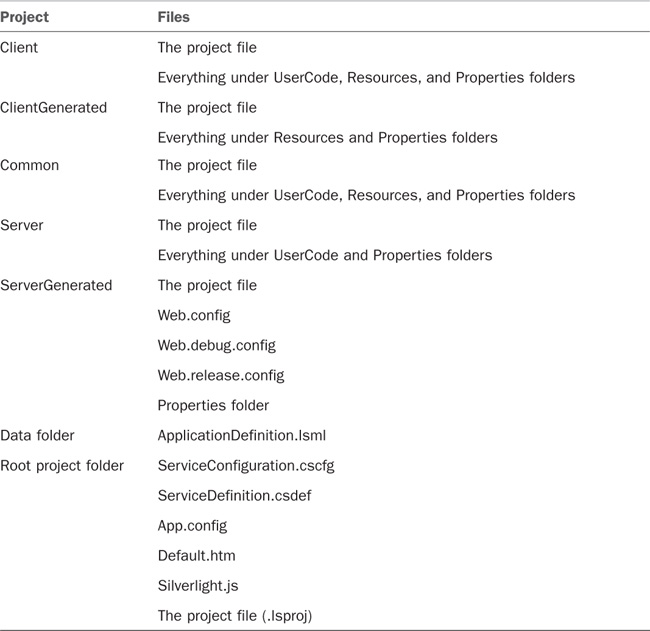
This will ensure that all the appropriate files are checked in to the server correctly.
Creating and Assigning Work Items
A work item represents a unit of work within the development process. Basically, a work item can be compared to a task to perform or to a single problem to solve, and can be of the types described in Table 13.2.
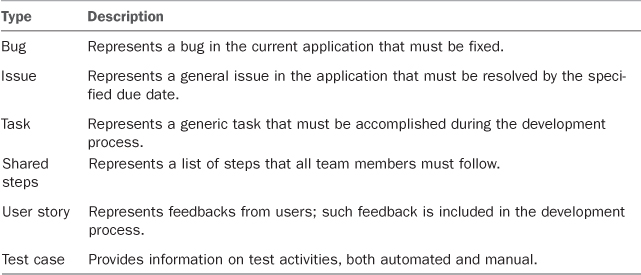
All work items enable you to keep track of specific features in the development process and have commonalities, so this chapter describes how to create, assign, and query bugs. Most of the concepts explained about bugs apply to other work items, as well. To track a new bug, select Team, New Work Item, Bug. At this point, the designer for the new work item appears in Visual Studio. You have only one mandatory field to fill in: Title. Here you write the description of the bug. Figure 13.17 shows an example in which the title describes how the application has the default icon, which is not appropriate.
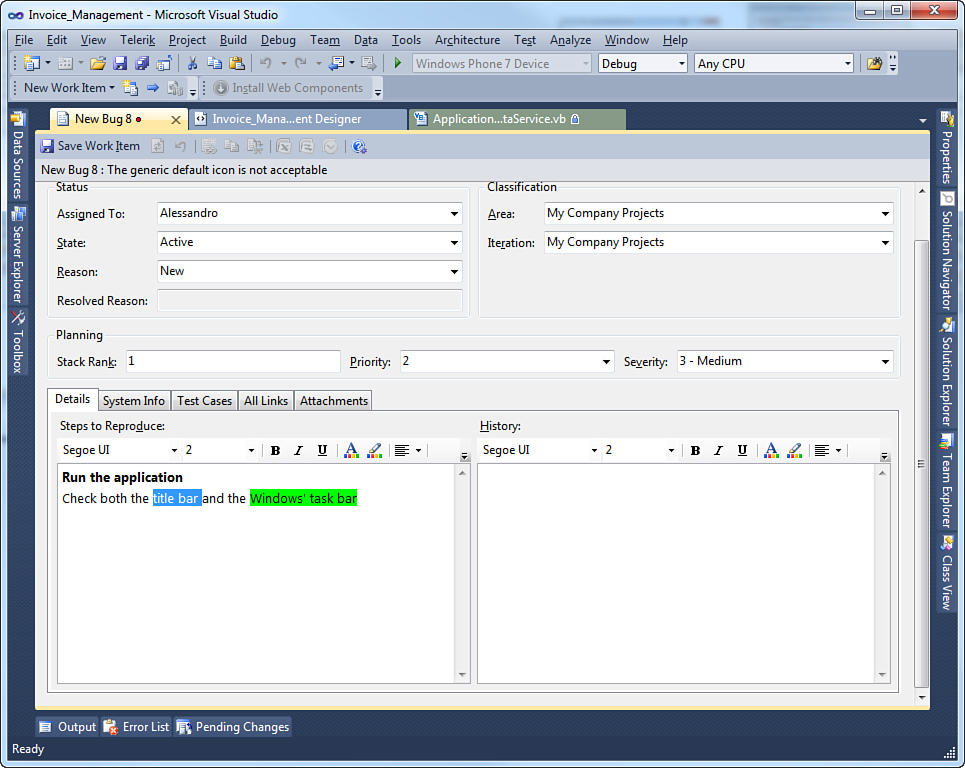
Figure 13.17. Creating a new bug work item.
The Status group contains information about the status of the work item. You can specify the author (from a list of users connected to the server), the state, and the reason. The state information is fixed to Active until you save the work item. From that moment on, you can change it to Resolved when the bug is fixed. Reason requires instead that you specify whether the bug applies to the application development (New) or to a build failure. You can specify classification information within the Classification group, such as the team project area or the iteration. The Planning group is about the bug severity according to different point of views. Stack Rank is a value set in triage and is a reference for the development team. Priority is a value measured in business importance and is between 1 (must fix) and 4 (unimportant). Severity is a value representing how the bug is affecting the development process and is between 1 (critical) and 4 (low).
At the bottom of the designer, you can find a tabbed control. The first tab is called Details, and on it you can specify additional information so that other team members will understand easier what the bug is about and how they can reproduce it. Notice that you can take advantage of a rich text editor that lets you format text. Another interesting tab is Attachments, on which you can add attachments to the work item. Remaining tabs are related to testing environments and are not discussed here. When you save the work item, the History box is populated with details of this version. Therefore, each time you edit the work item and then save it, the History box is updated with edits, and so you (or the team manager) have complete information about how the work item has been treated. Figure 13.18 shows how the designer changes when you save the work item.
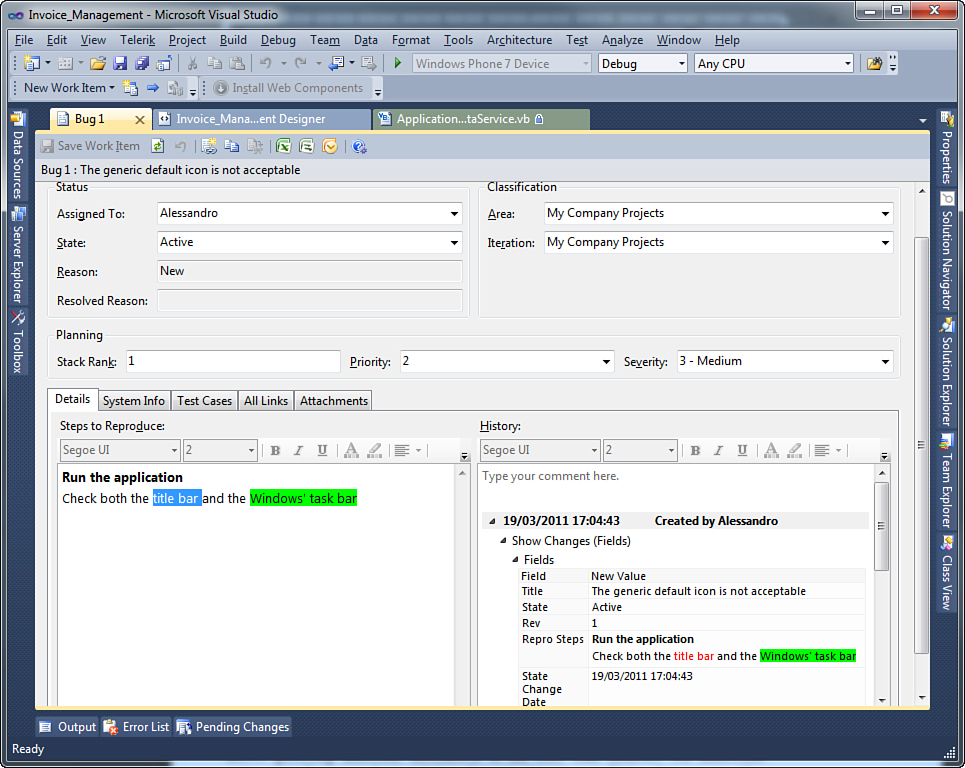
Figure 13.18. Saving changes to the work item.
After the work item has been saved, some buttons in the designer’s toolbar become available. Such buttons allow deep interaction with the Microsoft Office suite. Specifically, you can
• Send the bug summary via email to another person.
• Export the work item to Microsoft Excel.
• Manage the work item within Microsoft Project.
The approach to tracking bugs is very close to tracking other work item types. Now you learn how to query existing work items and close them after you have fixed what the work item requests.
Improving the Development Process
Even if you are a single developer, it should be clear that using team tools from Visual Studio LightSwitch dramatically improves the development experience. Think of bugs: You might have your own way of keeping track of things to do and problems to solve, but with TFS all the information you need is stored in a centralized archive that you can query at any time (as you learn momentarily), also taking advantage of Office integration and, most of all, within the integrated development environment of Visual Studio, without the need of purchasing additional management software.
Querying Work Items
Sometimes you or your colleagues will need to understand the progress of work items. To understand how many work items are active in the TFS workspace, you can request a query. In Team Explorer, expand the Work Items element and right-click My Queries, and then select New Query. At this point, the query editor appears in Visual Studio. The default query lists all the existing work items, but you can restrict the query result by filtering the Value column with one of the available values or changing the query operator in the Operator column. For example, you might want to query only active tasks or just resolved bugs, and so on. Leave unchanged the default query and click Run. As you can see in Figure 13.19, the IDE displays the list of the existing work items, which is just one in the current example.
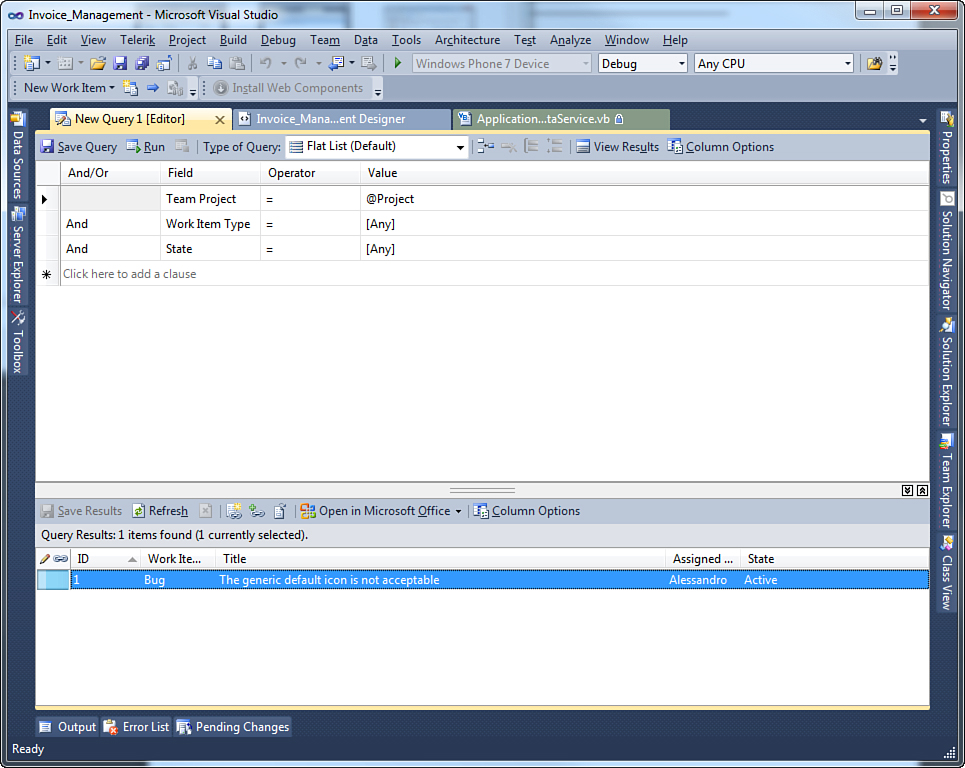
Figure 13.19. Querying work items.
Now, just for the sake of simplicity, suppose that you solved the bug that was assigned to you (changing the application icon is actually explained in Chapter 15, “Customizing the IDE”) and now want to mark the work item as resolved. In the query result, double-click the desired work item. This action opens the work item editor. Change the state from Active to Resolved and specify one of the available reasons. When you save the work item, notice two things. The first thing is that the History group is updated with the new information, as shown in Figure 13.20.
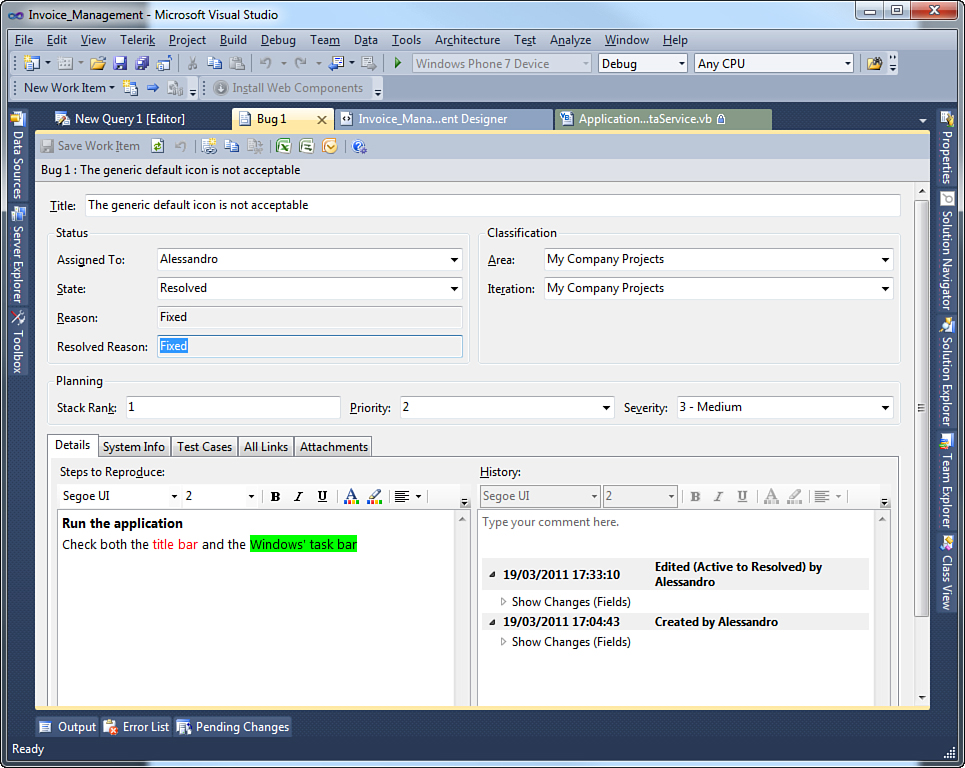
Figure 13.20. Closing the bug and updating the work item.
The second thing is that if you go back to the query editor by clicking the appropriate document tab, you can see how the query result has been automatically updated with the new work item status, from Active to Resolved. Work items provide an effective way to plan, organize, and assign tasks among the development team. They also make it easy for the single developer to keep track of the direction that the project is going.
Retrieving Specific Project Versions with Version Control
TFS 2010 (and earlier versions) offers version control instrumentation, which is part of the source control area. A version control mechanism provides, among other things, tools for working with different versions of your project. This means that
• Each time you check-in your project, TFS uploads a new version of the source code. Project versions do not have a number; instead, they are recognizable via the changeset number. It is as if TFS made incremental backup copies of your projects in one place.
• As a consequence of the previous point, version control has several benefits. For example, you can open a previous version of your project anytime from TFS (if, for example, the current version has too many failures or simply to check the progress of work made by other developers on the team).
In Visual Studio LightSwitch, you can access previous versions of your project in several ways, but the easiest way is to use the History window, which you saw back in Figure 13.14. When you open such a window, you can see a list of all available changesets on the server. All you need to do at this point is select the desired changeset and click the Get This Version button on the toolbar. For example, select the first changeset and click Get This Version. In a few seconds, Visual Studio LightSwitch downloads from the instance of TFS the specified version and replaces the current project with the selected changeset. You can easily verify this by opening the code for the SortedCustomersQuery query. Note that the code file now no longer contains the edits made in the latest check-in. You can easily switch between versions by using the techniques described earlier.
Another convenient way to retrieve the list of available changesets is to right-click the project name in Solution Explorer and select Get Specific Version. The Get dialog appearing at that point enables you to filter changesets by user or by date, after you select ChangeSets as the version type.
Automating Builds
In general software terminology, build automation means automating a variety of tasks in the development process. In TFS terminology, this specifically means automating the compilation of source code into a fully functional application only when specified conditions are met. Actually, in TFS, the build automation process also allows automating unit tests, but this is not covered here. The reason for automating builds is that the development team can access a specific version of the executable application, built according to the specified requirements. Common requirements are scheduled intervals of time or check-ins. Technically speaking, a build automation produces the same result that you get by selecting Build, Build in Visual Studio LightSwitch, but the difference is that in TFS you have an incremental history of builds, accessible by all (or just some of) the team members. TFS configures a build service on the server that runs in the background and that can run the specified tasks independently from Visual Studio; this means that the IDE does not need to be running when the build process is scheduled.
The server (or the machine) where the build service is running has to have Visual Studio LightSwitch installed, too. This is a requirement in version 1; otherwise, the build service (powered by the MSBuild tool) will not work alone.
Creating Build Definitions
To enable build automations for your projects, you need to create a build definition. A build definition tells TFS how to automate the build process for the selected project. To create a build definition, right-click the Builds element in Team Explorer. Visual Studio LightSwitch will then open the Build Definition window shown in Figure 13.21.
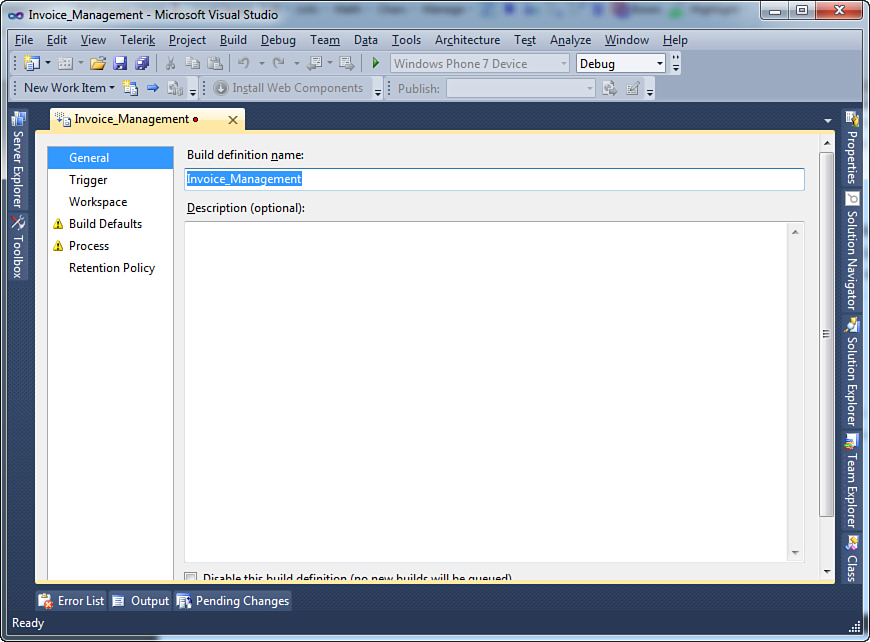
Figure 13.21. The Build Definition window.
By default, the General tab provides an identifier for the build definition, but you can replace it with a custom one (and provide an optional description). The Trigger tab is probably the most important; on it, you can specify when the build service on the server will trigger a new build. Available options are self-explanatory. For instance, you could decide to trigger new builds only during the weekend at 3 a.m. Figure 13.22 shows this.

Figure 13.22. Deciding when a new build should be triggered.
Another common option is to select the Continuous Integration option, which triggers a new build every time a check-in is performed. The Workspace tab indicates the working directory on the server and should not be changed manually. The Build Defaults tab has several options, but the most important is related to the folder into which new builds are created. This must be a shared network path (UNC), generally on the server, but it could be also on your development machine (for example, if you are a single developer working with TFS Basic). So, you must create a folder on disk and share it with the other members of the development team. You do so by using the usual security and sharing tools over folders in Windows Explorer. (This typically is done by the server administrator if the shared network path is on the server.) The shared folder must be reached in the form of \ServerSharedFolderName. Figure 13.23 shows an example.
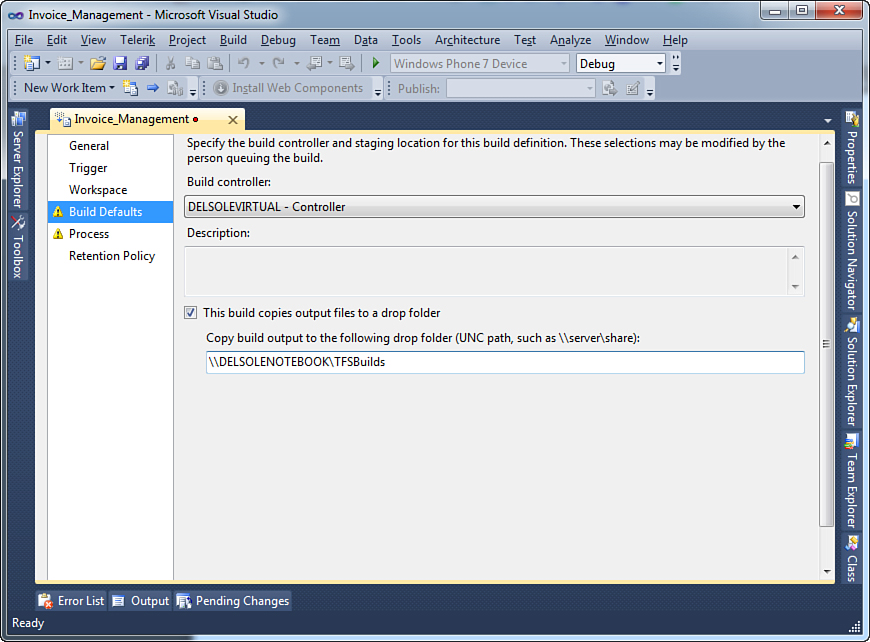
Figure 13.23. Specifying the target shared folder for builds.
The build process relies, behind the scenes, on the Windows Workflow Foundation technology. This allows automating business tasks in a sophisticated way but requires the developer to specify explicitly all the steps that will be involved in the workflow. On the Process tab, you can specify a template that indicates to Windows Workflow Foundation how to handle the build automation process. By default, you should see a default, built-in template selected for you. If no template is available in the list (which could happen in some scenarios), you can just take advantage of one of the built-in templates. If this is your case, click New, and then in the New Build Process Template dialog, click Browse (see Figure 13.24).
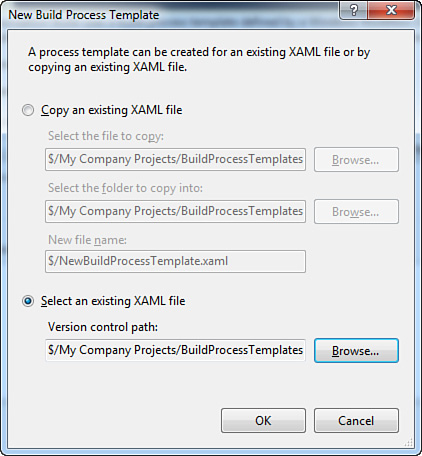
Figure 13.24. Selecting an existing template.
Browse your team project’s folder and enter the BuildProcessTemplates subfolder. There you can find a number of built-in templates. Select Default.xaml. When you click OK, Visual Studio LightSwitch shows summary information that you can skip at this point (see Figure 13.25).
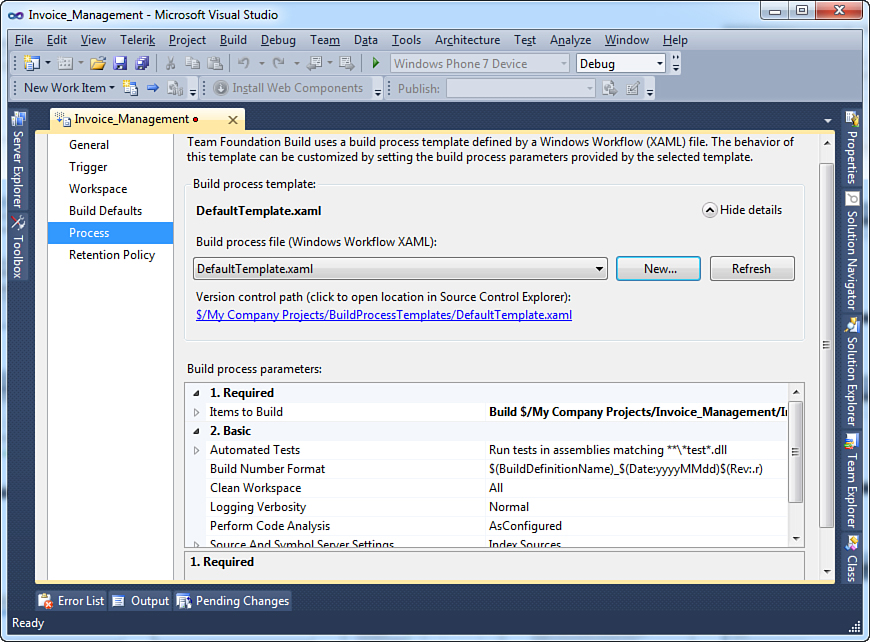
Figure 13.25. Summary information for the current process template.
On the Retention Policy tab, you can specify how builds should be retained. You do not need deep control over the retention policy at this point, so you can leave unchanged the default selection (see Figure 13.26). The MSDN documentation for TFS provides additional information about this.
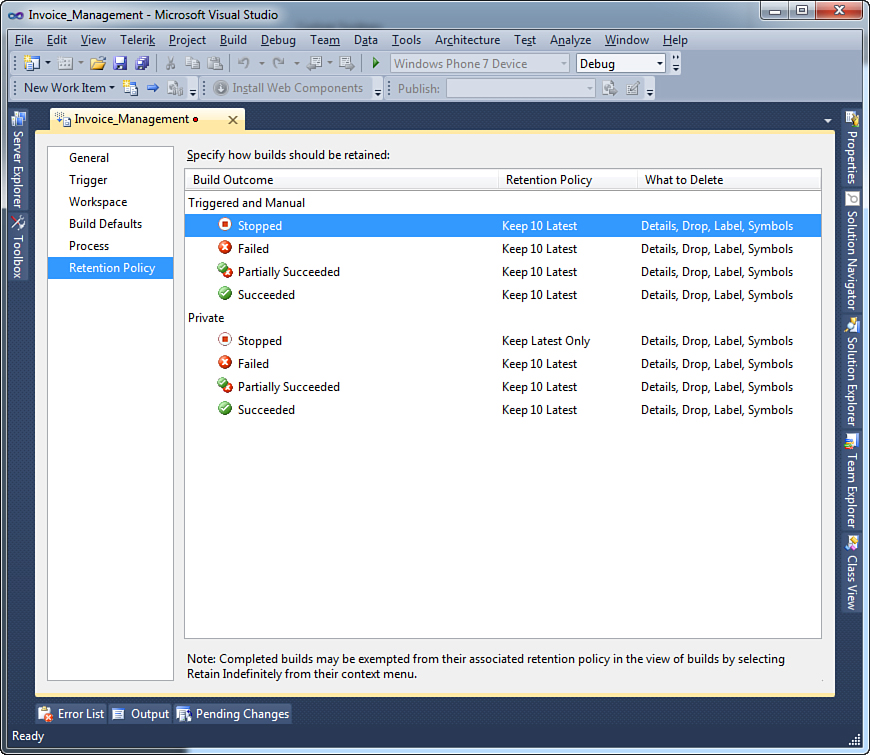
Figure 13.26. Setting build retention policies.
Now click Save on the standard toolbar so that the new build definition is updated in TFS. It is now time to understand how builds work.
Triggering Builds
When a build is triggered and you have Visual Studio LightSwitch running, you can check the build progress within the Build Explorer window. This window has two tabs: the tab on the left shows the list of queued and in-progress builds; the other tab shows the list of completed builds (see Figure 13.27).
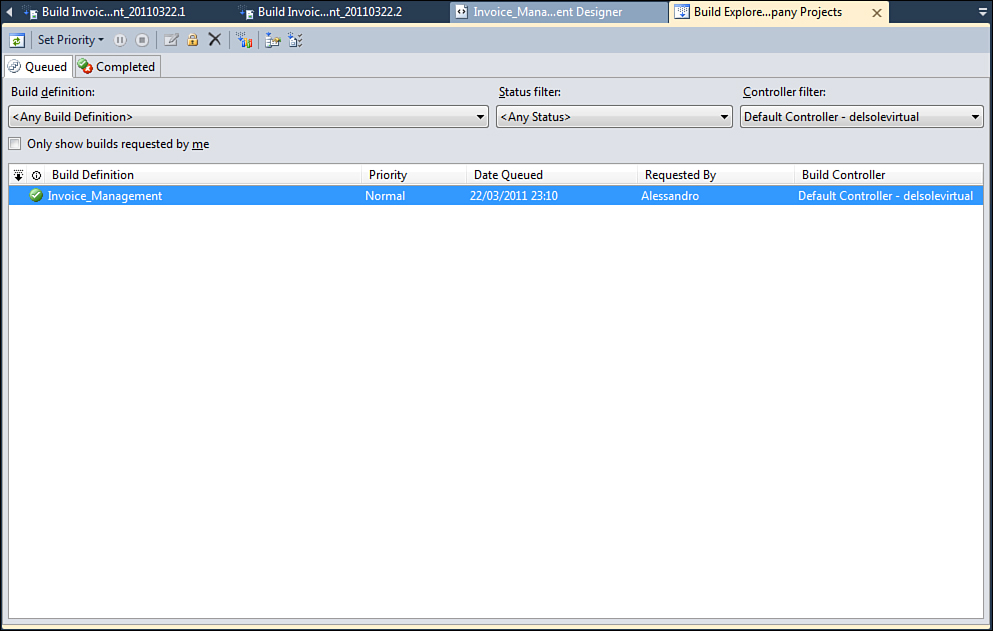
Figure 13.27. The Build Explorer window.
As you can see, you can also filter builds requested only by the user who is currently logged in to the operating system. When the build completes, you can view the result details by double-clicking its name in the list. This is useful if the build fails or if it succeeds. In both cases, Visual Studio provides detailed information about the build process and, with particular regard to errors, detailed error messages that point you in the right direction to solve them. Figure 13.28 shows the result of a successful build.
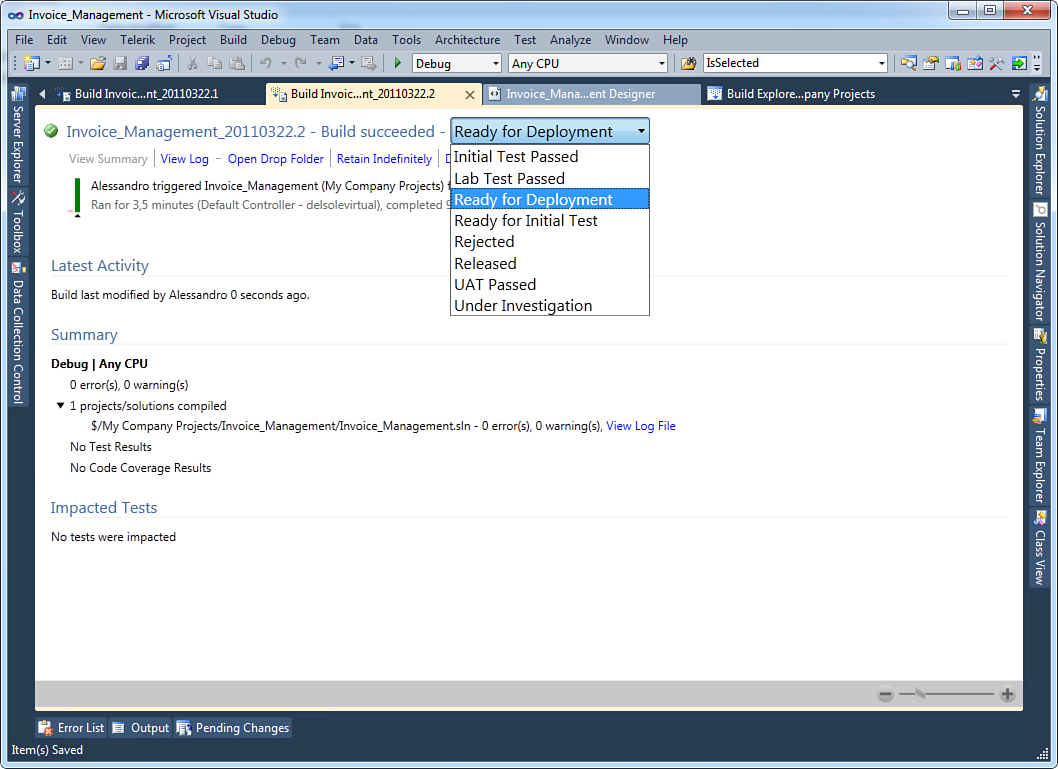
Figure 13.28. The summary of a successful build.
You can also assign to the build the so-called build quality, which basically enables you to associate the current build with a particular moment in the development cycle. Assigning a build quality is not mandatory, but it can prove useful for later analysis. Now you can go to see the physical result of the build process. To do so, you must open the shared network path that you supplied during the build configuration. Note in Windows Explorer how such a path contains a first subfolder related to the current project and how this contains incremental versions of builds, as shown in Figure 13.29.
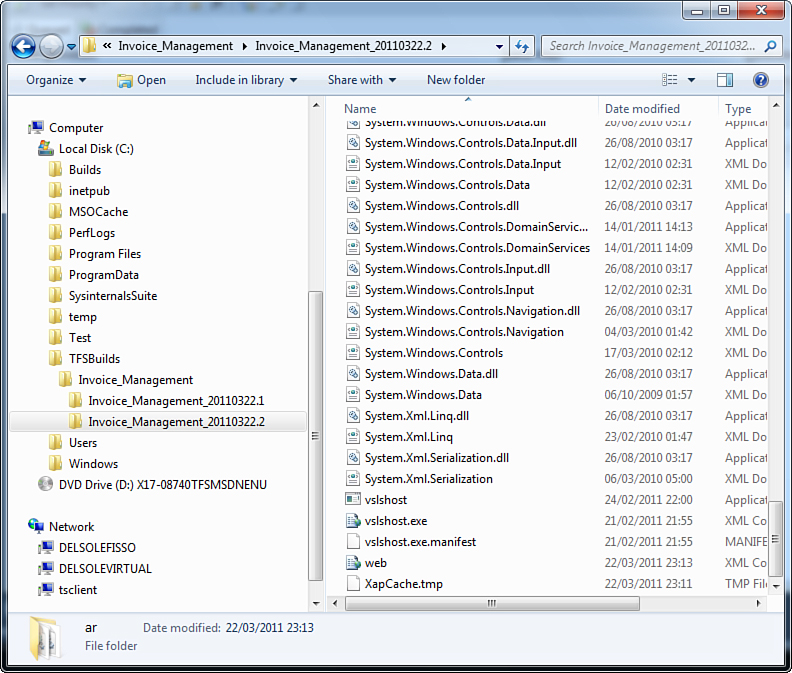
Figure 13.29. Analyzing the structure of the build’s output folder.
It is easy to understand when a build was produced because each subfolder’s name contains the data in which the build was triggered. If you open any of the folders, you can see the actual result of the build process. So by automating builds, you can have a centralized history of the application development (including its ultimate result). This scenario proves particularly useful with large teams, but single developers may also find it helpful (because you can, at a minimum, go back in time if you encounter problems with new versions of the application).
Code Metrics
Code Metrics is an interesting tool that analyzes a project and provides information about the ease of maintainability according to specific indexes. You can invoke the tool from the Analyze menu by selecting Calculate Code Metrics or by right-clicking a project name in Solution Explorer and selecting the same-named command. The tool calculates code metrics according to the indexes described in Table 13.3.
Table 13.3. Code Metrics Indexes
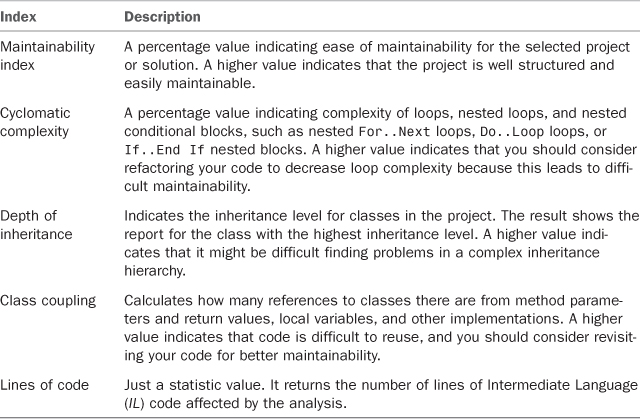
Whereas in Visual Studio 2010, this tool is really useful to analyze maintainability of your entire solution against your whole code, in Visual Studio LightSwitch it makes sense only against your own code, thus excluding the autogenerated code that typically serves as the infrastructure for the application. In addition, this tool in the LightSwitch-based development is useful when writing custom WCF RIA Services. Following this consideration, the Code Metrics tool can be useful only against two projects in a LightSwitch solution: Client and Server. Both contain autogenerated code, but they also contain the code you write. Just as examples, the Client project contains code that checks whether the currently logged-in user has permission to execute some actions on the client side, and Server contains the code that performs data validation on the server side (the ApplicationDataService class). To understand how the tool works in a LightSwitch project, in Solution Explorer enable the File View option, and then right-click the Server project name. At this point, select Calculate Code Metrics. After a few seconds, you get the report shown in Figure 13.30.
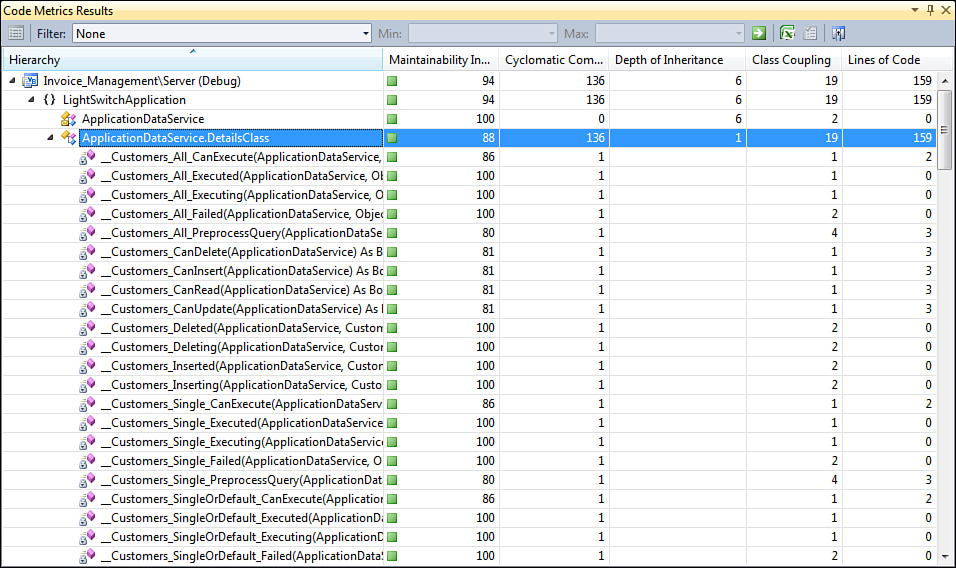
Figure 13.30. Calculating Code Metrics for the Server project.
As you can see from the report, the project has a maintainability index of 91, which is good. Generally, values from 80 to 100 represent the best range for maintainability. Visual Studio shows a green symbol if the index is good or a red one if the maintainability index is too poor. You can expand the project name to see how the global result is subdivided for each class and for each class member. The global Cyclomatic Complexity index is 334, which is a large number (but it is due to methods that execute queries, and so it is normal). The Depth of Inheritance index is 6, which is a small value, meaning that the class inheritance hierarchy is made of five derived classes (the sixth one is System.Object). This is an absolutely acceptable value in this particular scenario. The Class Coupling index is medium-high. It is determined by methods that have references to other classes. Particularly, if you expand the ApplicationDataService class, you can notice that the index’s value is influenced by the MostActiveCustomers_PreProcessQuery and OrdersByCustomerIDQuery_PreProcessQuery methods that make calls to a lot of objects. The same ApplicationDataService class has an elevated number of references. Obviously, a high index does not necessarily indicate a problem. In this code example, a high value is acceptable because all invocations are required to make the application work according to its infrastructure; but in a reusable class library (such as a RIA Service), a high value should need attention and code refactoring.
Unit Testing Your Helper Code
Unit tests enable you to test code portions outside the application context to check whether they work correctly, which means that testing is basically abstracted from the application. Unit tests can save a lot of time because when you move code from the test context to the application context you already know that such code works; you already tested it and you do not need to debug it again.
You usually create a test project, where there are classes and methods that encapsulate and isolate the original code so that you can test it in a kind of isolated sandbox without editing the source project. Visual Studio 2010 is the ideal environment for performing unit tests, but in LightSwitch, you do not have the full instrumentation for unit tests available. For example, in a non-LightSwitch application, you can just right-click a method in the code editor to immediately access the unit testing instrumentation. In version 1, not only is this not available, but you also cannot create unit tests for your business logic code directly, meaning that you cannot access entities and entity-related code when creating unit tests. This excludes the code you write for data validation, computed properties, and so on. However, you still have a small chance of unit testing your code by using different (but absolutely valid) techniques. For example, you could write a method that validates a string against a valid web address. You can isolate the method, passing a string that is not an entity property value and test it. Then, when the test passes, you move the code to the appropriate place in your business logic. We are referring here to code that you use in your logic without requiring an entity reference as to the helper code. Technically speaking, you use test projects and perform steps that usually are part of a programming approach known as test-driven development (TDD). Using TDD, developers create applications by first writing unit tests and then writing the actual code after the unit test passes. This particular approach helps developers write better code because it ensures that the code works via unit tests. This chapter does not really cover TDD; instead, it explains how you can still unit test helper code in LightSwitch.
Why and Where Unit Testing in Lightswitch?
Of course, one of the most important benefits that LightSwitch offers is that you focus on writing code related to the business logic. So, you might wonder why we are talking about unit tests if they are not fully available. In some specific scenarios, you might want to write unit tests in LightSwitch (for example, when creating WCF RIA Services, in which you write custom code, or when writing extension methods or class libraries that you add to your projects). Outside these particular contexts, you might never need to write unit tests.
Before going on, it is important to activate test options that enable double-clicking a test result failure in the Test Results dialog to be redirected to the code that threw errors. To do so, follow these steps:
1. Go to Tools, Options and select the Test Tools, Test Execution.
2. Check the Double-Clicking a Failed or Inconclusive Unit Test Result Displays the Point of Failure in the Test check box (see Figure 13.31).
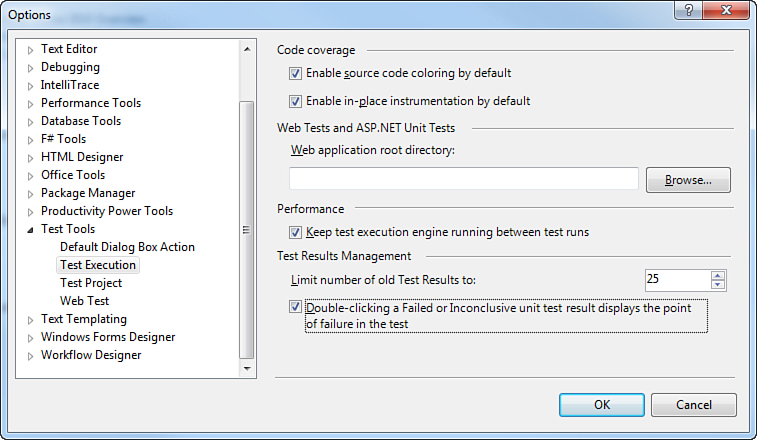
Figure 13.31. Setting test execution options.
3. Click OK to close the dialog.
At this point, you can create a test project where you can launch your unit tests. This section explains how you can create a unit test for the IsValidUri method (introduced back in Chapter 4, “Building More-Complex Applications with Relationships and Details Screens”) so that you can test whether the method correctly checks for well-formed web addresses before you use it in an application. So, access the Customer.vb code file and remove the IsValidUri extension method. You will place it there again after you complete the unit test.
Creating a Test Project
To set up the unit testing environment, first create a test project related to the actual application project. Add a new test project to the solution. To do so, select File, Add, New Project, and then in the Test Projects folder, select the Test Documents subnode, and then select the Test Project template. Figure 13.32 shows how to find and select the template in the Add New Project dialog.
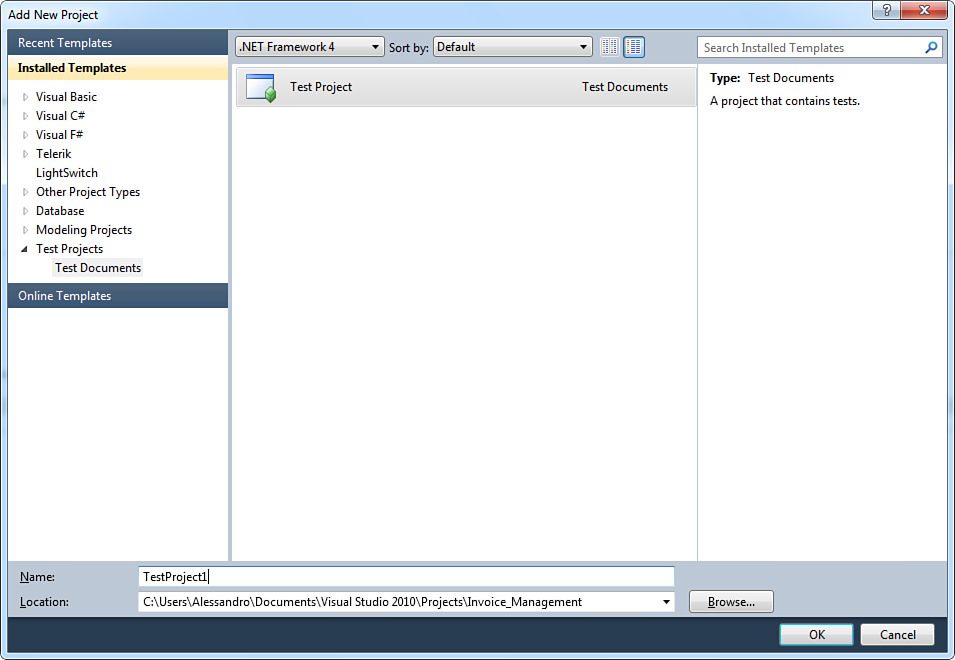
Figure 13.32. Creating a new test project.
At this point, Visual Studio generates a new test project that contains one default class called UnitTest1 and one default method called TestMethod1. The code file contains some additional code, such as the TestContext property, which represents a managed handler for unit tests. The UnitTest1 class is marked with the Microsoft.VisualStudio.TestTools.UnitTesting.TestClass attribute, which tells the compiler that such a class is a container of unit tests, and the TestMethod1 is marked with the Microsoft.VisualStudio.TestTools.UnitTesting.TestMethod attribute, which tells the IDE that such a method is a unit test and therefore can be executed outside the application context via specific tools that are described momentarily. Notice that the IDE does not generate a function returning a value. Instead, it generates a procedure (Sub) that contains all the code within its body and that will be refactored later. At this point, the testing environment is ready, and you can begin writing your unit tests.
Creating Unit Tests
Rename the TestMethod1 method to TestWebSite and write it as follows:
<TestMethod()>
Public Sub TestWebSite()
' TODO: Add test logic here
Dim site As String = "Http:/msdn.com/lightswitch"
Assert.IsTrue(Uri.IsWellFormedUriString(site, UriKind.Absolute))
End Sub
When you write unit tests, you generally test real values. After the code has been moved to production, the code is abstracted from real values and is refactored in a way that it can receive values from variables. In the preceding example, the site variable contains a badly formed web address that the method needs to check. Basically, the actual test is performed by invoking one of the methods exposed by the Assert class. This class exposes several methods that can test a huge number of conditions, and you can explore them by using IntelliSense in the code editor (such as values equality, inequality, reference type’s comparisons). In this case, we are using IsTrue, which makes a unit test pass if the condition returns True; it makes the unit test fail if the condition returns False. Now, right-click the method’s name in the code editor. The pop-up menu now shows a command called Run Tests, which will start all the test methods in the current code file. After a few seconds, you will see the test results in the Test Results window, shown in Figure 13.33.
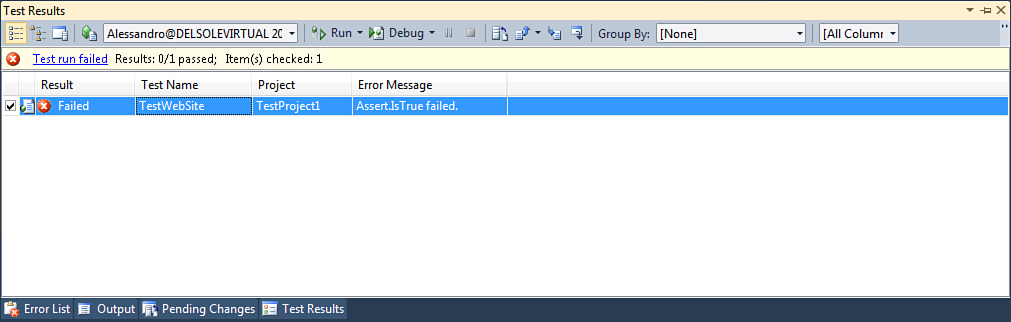
Figure 13.33. Unit test failed.
The unit test execution failed, and this makes sense because the web address contained in the site variable is not well formed. You can get detailed information about the test execution by double-clicking the result. So, now you have reached the first objective: ensuring that the method can determine whether a web address is not well formed, but now you have to reach the opposite goal. So, replace the site variable as follows:
Dim site As String = "Http://msdn.com/lightswitch"
The variable now contains a well-formed address. Run the unit test again (by either using the same technique as before or by clicking the Run Tests button in the Test Results window). At this point, the unit test passes (as shown in Figure 13.34), and this makes sense again, because the method ensured that a valid web address was accepted.
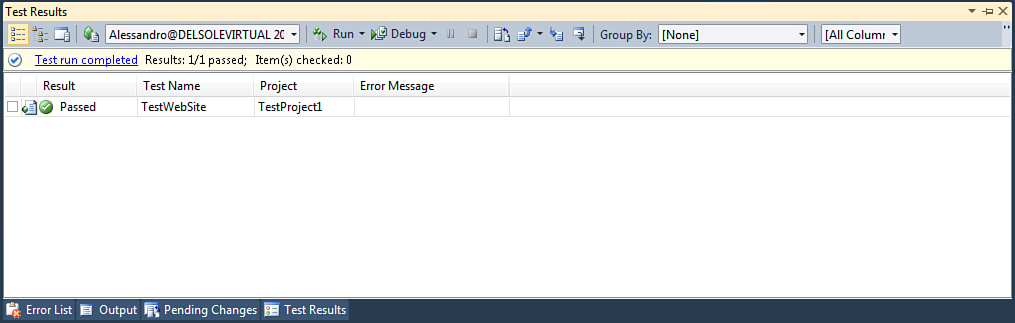
Figure 13.34. The unit test passed.
Now that you are sure that your code correctly validates web addresses, it is time to refactor such code and move it to the real project. First you need to move the procedure to a function returning a Boolean value, and then you need to check values received at runtime instead of the hard-coded values. This is how you can refactor the method:
Public Function IsValidUri(ByVal address As String) As Boolean
Return Uri.IsWellFormedUriString(address, UriKind.Absolute)
End Function
But because this method is intended to extend the String class, as it was previously, it can be rewritten as follows:
Module Extensions
<System.Runtime.CompilerServices.Extension()>
Function IsValidUri(ByVal address As String) As Boolean
Return Uri.IsWellFormedUriString(address, UriKind.Absolute)
End Function
End Module
Of course, you need to move the code to the appropriate place in the application, such as in the Customer.vb code file in the LightSwitch project. The lesson learned here should be clear now: If you write the extension method directly, you must then run the application, create a new customer, enter a web address, and wait for validation. By writing a unit test, however, you can determine whether the method works correctly without having to perform all those steps (and thus save time and effort).
Analyzing the Execution Flow with IntelliTrace
The IntelliTrace tool is available only in Visual Studio 2010 Ultimate. When using this tool, you might notice some performance decrease because the IntelliTrace process records a lot of information and therefore requires significant system resources.
Visual Studio 2010 introduced a new analysis tool called IntelliTrace, formerly known as the Historical Debugger. This tool can improve your debugging experience because it can record and navigate every event occurring during the application lifetime, such as events and failures, including information about specific threads. As its name implies, IntelliTrace is a debugging tool, but it is not discussed in Chapter 14, “Debugging LightSwitch Applications,” because
• It is specific to Visual Studio 2010 Ultimate.
• It is not only a debugging tool but also a specialized analysis tool that walks through the entire application lifetime.
In Visual Studio 2010, but not in the LightSwitch context, IntelliTrace is fully integrated with the code editor and with the rest of the IDE functionalities, such as Call Stack and Locals tool windows, and so it provides a complete debugging environment. In a non-LightSwitch project, the tool can record (to a file, too) and debug the following:
• Application events, such as user interface events or application exceptions
• Playback debugging, which allows deep analysis of specific events that occur before and after a particular code block (including autogenerated code)
• Unit test failures
• Load test failures and build acceptances test
• Manual tests
Unfortunately, in Visual Studio LightSwitch you cannot take advantage of all the features of IntelliTrace, such as the historical debugging (which is probably the most important feature). However, you can use IntelliTrace in a limited way; for example, you can analyze the execution flow of your applications and see what happens behind the scenes. So in this chapter, you do not learn every feature available in IntelliTrace. Instead, you learn about IntelliTrace features that apply to the LightSwitch development context.
IntelliTrace Options
You can customize the behavior of IntelliTrace in a number of ways. You set its options via Tools, Options, IntelliTrace (see Figure 13.35).
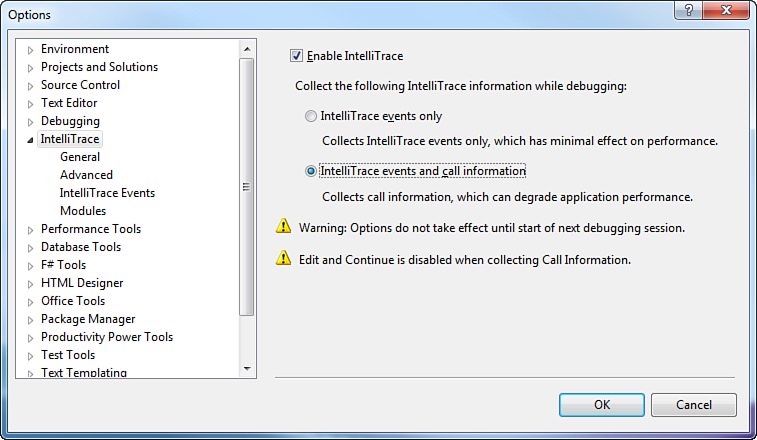
Figure 13.35. Setting general options for IntelliTrace.
IntelliTrace is enabled by default. The default behavior is that IntelliTrace collects events only, which is the appropriate option in LightSwitch. If you want to use IntelliTrace with a different project type (including RIA Services), select IntelliTrace Events and Call Information to get complete information about the code calls, too. This kind of monitoring is the most expensive in terms of system resources and should be used only when necessary (but it does offer a high-level view of what happens during the application’s lifetime).
IntelliTrace in Action with LightSwitch
Every time you run a LightSwitch application from the IDE, IntelliTrace information becomes available via the IntelliTrace window. Note that to get information on the application execution, the application must break (the result of an exception or by your clicking the Break All hyperlink in the window). When the execution breaks, the IntelliTrace window shows detailed information (about from when the application started until it broke), as shown in Figure 13.36.
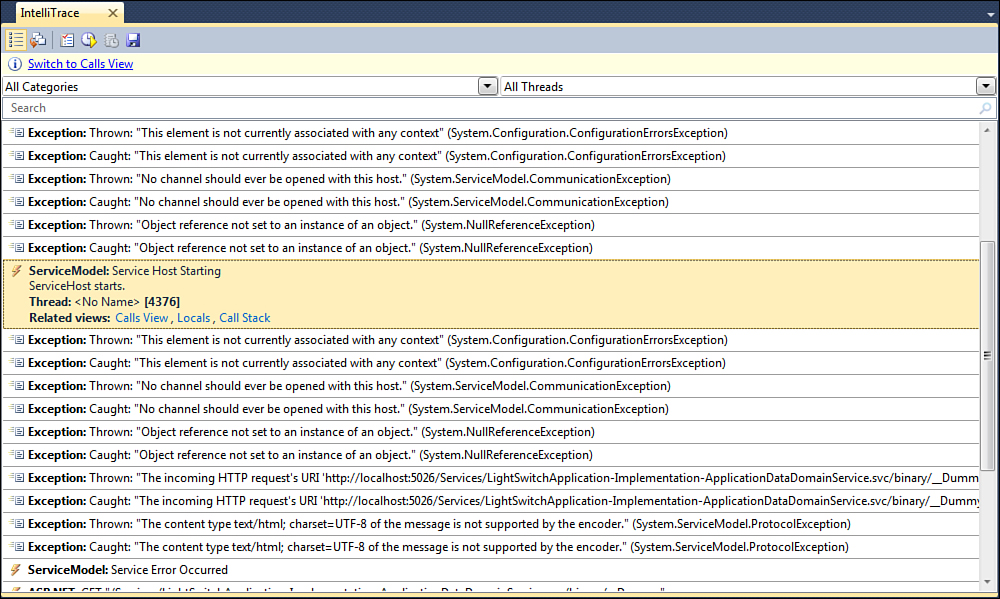
Figure 13.36. IntelliTrace in action, showing details on the application execution.
You can filter information by category and by thread. Use the upper combo box to select which kind of events category you want to check out (for example, Console, ASP.NET, ADO.NET, and so on) and which specific thread you want to get tracking information for.
As you can see, IntelliTrace is a powerful tool capable of tracking every single event that occurs during the entire application lifetime—meaning that you can even use IntelliTrace to just keep track of events without errors. If you want to get further information about everything that has happened, you can just click something in the list. If the event has relationships with variables, you can click Locals or Call Stack to see variables involved in the event. Just press F5 when you want to resume the application execution.
IntelliTrace Log Files
When the application is running with the debugger attached, IntelliTrace records everything happening. (This is why you might notice a small performances decrease when you select the Events and Call Recording option.) Such recordings are saved to log files available in the C:ProgramDataMicrosoft Visual Studio10.0TraceDebugging folder and can be analyzed directly from within Visual Studio. To accomplish this, follow these steps:
1. In Windows Explorer, open the C:ProgramDataMicrosoft Visual Studio10.0 TraceDebugging folder.
2. Double-click the last log file related to your application. Notice that log file names all begin with the application name, but you can open the most recent according to the date-modified value.
Visual Studio opens the log file, showing a result similar to what you see in Figure 13.37.
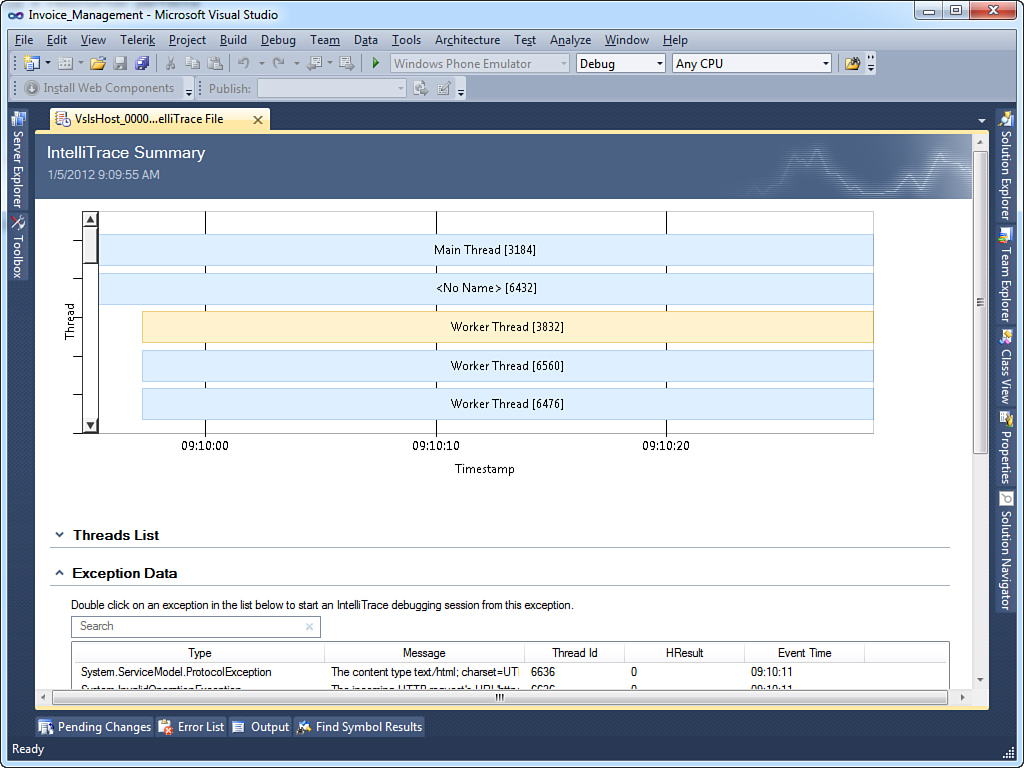
Figure 13.37. Analyzing IntelliTrace logs.
Logs contain lots of information. For example, you can select a particular thread in the upper graph and check for the related threads list below it. This is useful for understanding at what time a specific thread was tracked. You can also check system information and modules involved in the tracking process. (Such information displays at the bottom of the page.)
Summary
In Visual Studio LightSwitch, you can take advantage of professional tools from Visual Studio 2010 that make your development experience even better. With Team Foundation Server 2010 and Visual Studio, you have a full-feature platform for managing the entire application life cycle, starting from source and version control all the way to producing builds. With Code Metrics, you have an opportunity to measure your code so that you can understand how maintainable it is, according to principles of the .NET Framework.
Generally, the code you write in Visual Studio LightSwitch focuses on the business logic, and in some cases, it can be useful to test its behavior outside of the application context. With unit testing, you test custom methods outside the application and then, once you are sure that they pass the test, you can move the code to the actual project.
IntelliTrace is a special historical debugger available in Visual Studio 2010 Ultimate only. This tool enables you to reconstruct everything that has happened during the application’s lifetime. In LightSwitch, however, it has several limitations, which means that you can use it only to analyze the application’s execution flow.