Chapter 1. What Are Gaps?
Gaps have attracted the attention of market technicians since the earliest days of stock charting. A gap occurs when a security’s price jumps between two trading periods, skipping over certain prices. A gap creates a hole, or a void, on a price chart.
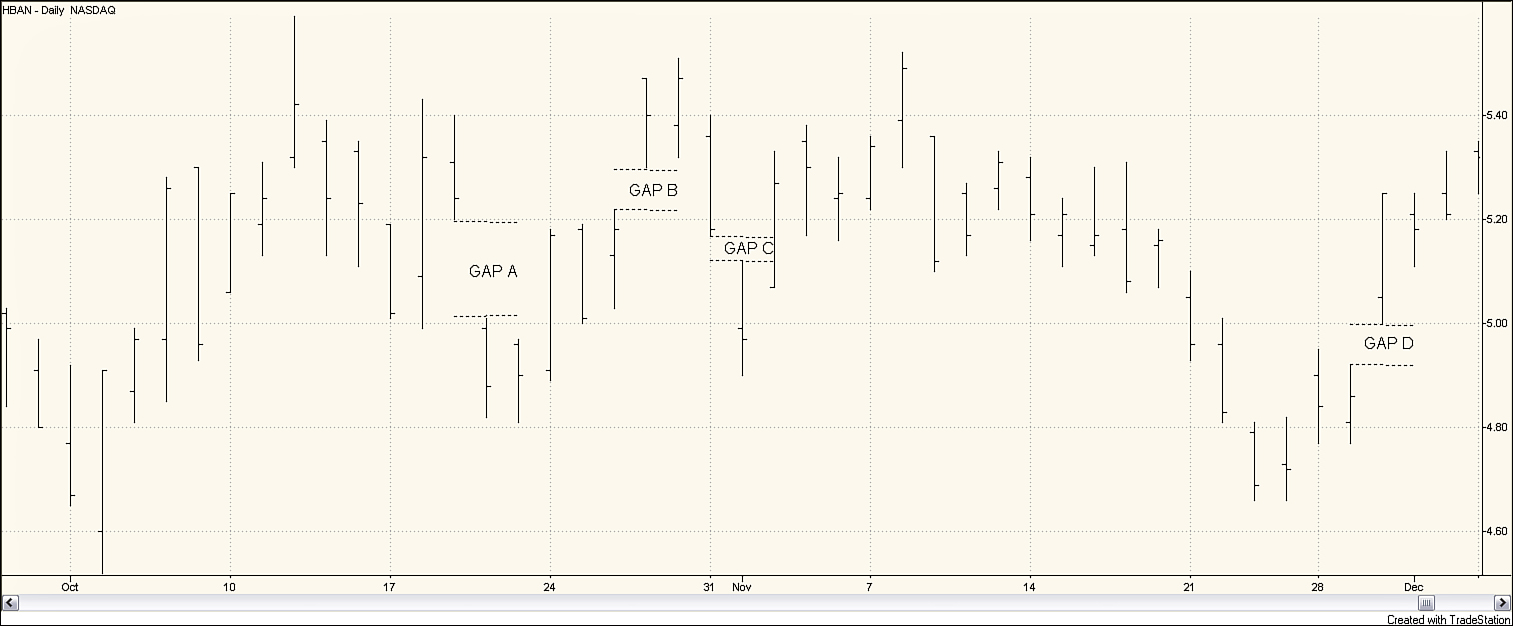
Because technical analysis has traditionally been an extremely visual practice, it is easy to understand why early technicians noticed gaps. Gaps are visually conspicuous on a price chart. Consider, for example, the stock chart for Huntington Bancshares (HBAN) in Figure 1.1. A quick glance at the price activity reveals four gaps.
Created with TradeStation
Figure 1.1. Gaps on stock chart for HBAN September 29–December 2, 2011
In Figure 1.1, Gap A and Gap C are known as a gap down. A gap down occurs when one day’s high is lower than the previous day’s low. In the figure you can see that the lowest price for HBAN on September 19 was $5.20. On September 20, the highest price at which HBAN traded was $5.01. Thus, a gap of 19 cents was formed. From September 19 through September 20, HBAN traded for $5.20 and higher and for $5.01 and lower; however, no shares traded hands at a price between $5.01 and $5.20. Thus, a void or gap in price was formed.
Just as a security’s price can gap down, it can gap up. A gap up occurs when one day’s low is greater than the previous day’s high. Both Gaps B and D in Figure 1.1 represent gap ups.
Early technicians did not pay attention to gaps simply because they were conspicuous and easy to spot on a stock chart. Because gaps show that a price has jumped, they may represent some significant change in what is happening with the stock and present a trading opportunity.
A technical analyst watches stock price behavior, searching for signs of any change in behavior. If a stock is in a strong uptrend, the analyst watches for any sign that the trend has ended. When a stock is in a consolidation period, the analyst watches for any sign of a change in behavior that would indicate a breakout either to the upside or to the downside. Spotting these changes leads to profitable trading, allowing the trader to jump on a trend, ride the trend, and exit once the trend has ended. Gaps can be one indication of an impending change in trend.
Given the persistence of superstitions, such as “a gap must be closed,” surprisingly little study has been undertaken to analyze the effectiveness of using gaps in trading. This book provides a comprehensive study of gaps in an attempt to isolate gaps which present profitable trading strategies.
Types of Gaps
Gap types differ based on the context in which they occur. Some price gaps are meaningful, and others can be disregarded.
Breakaway (or Breakout) Gaps
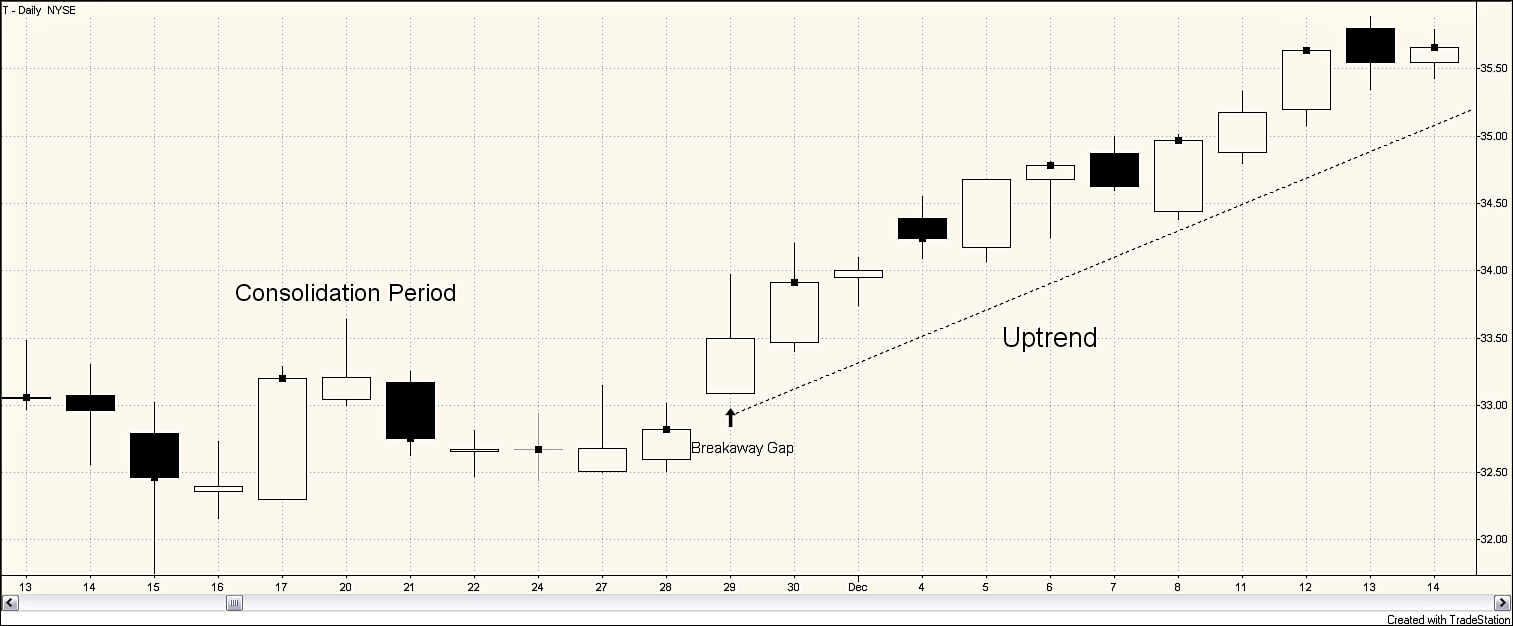
A breakaway gap is one that occurs at the beginning of a trend (see Figure 1.2). In November 2006, AT&T (T) was in a trading range. On November 29, the stock gapped up and an uptrend began. Because profits are made by jumping on and riding a trend, breakaway gaps are considered the most profitable gaps for trading purposes.
Created with TradeStation
Figure 1.2. Breakaway gap on stock chart for T, November 13–December 14, 2006
Runaway (or Measuring) Gaps
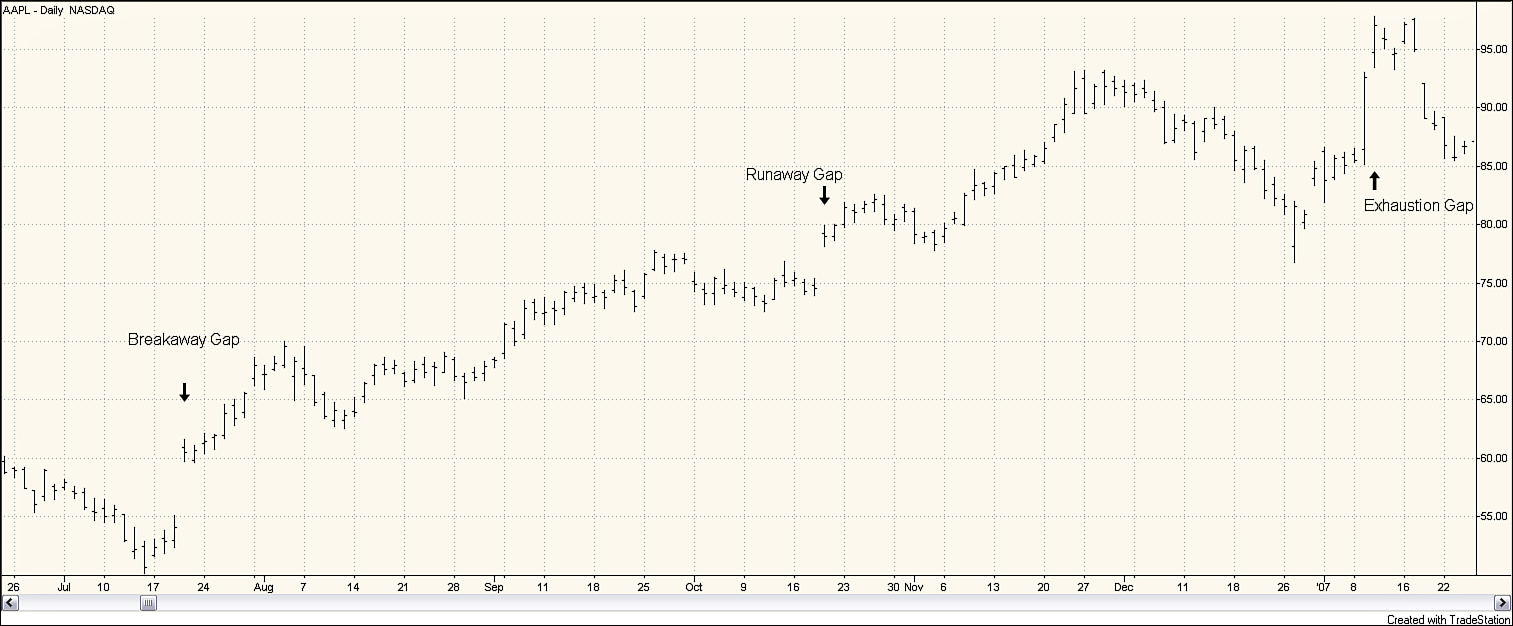
A gap that occurs along a trend line is called a runaway gap or a measuring gap. Often, a runaway gap appears in a strong trend that has few minor corrections. The contrast between a breakaway gap and a runaway gap is highlighted in Figure 1.3. In July 2006, Apple (AAPL) experienced a breakaway gap, with price jumping from $55 to $60 a share, and an uptrend began. The stock price headed higher over the next 3 months. Then, on October 19, the stock gapped up again by several dollars; the uptrend continued.
Created with TradeStation
Figure 1.3. Runaway gap on stock chart for AAPL, June 23, 2006–January 24, 2007
Runaway gaps are often referred to as measuring gaps because of their tendency to occur at about the middle of a price run. Indeed, this is what AAPL did in Figure 1.3. Thus, the distance from the beginning of the trend to the runaway gap can be projected above the gap to obtain a target price. Bulkowski (2010) finds that an upward runaway gap occurs, on average, 43% of the distance from the beginning of the trend to the eventual peak, and a downward gap occurs, on average, at 57% of the distance.
Exhaustion Gaps
As its name sounds, an exhaustion gap occurs at the end of a trend. In the case of an uptrend, price makes one last attempt to move higher on a last gasp of breath; however, the trend is exhausted, and the higher price cannot be sustained. For example, the gap up on January 9, 2007 (refer to Figure 1.3) occurs as AAPL’s powerful uptrend is coming to an end. It is easy to detect an exhaustion gap in hindsight; however, distinguishing an exhaustion gap from a runaway gap at the time of the gap can be difficult because the two share many characteristics.
Popular wisdom suggests that trading exhaustion gaps can be dangerous. An exhaustion gap signals the end of a trend. However, one of two things can happen; the trend may reverse immediately, or price may remain in a congestion area for some time. An exhaustion gap signals a trader to exit a position but does not necessarily signal the beginning of a new trend in the opposite position.
Other Gaps
In addition to breakaway, runaway, and exhaustion gaps, technical analysts identify a few types of gaps that are generally of no consequence for a trader. Common gaps occur in illiquid trading vehicles, are small in relation to the price of the vehicle, or appear in short-term trading data. An ex-dividend gap may occur in a stock price when a dividend is paid and the stock price is adjusted the following day. Ex-dividend gaps are insignificant, and the trader must be careful not to misinterpret them. Suspension gaps can occur in 24-hour futures trading when one market closes and another opens, especially if one market is electronic and the other is open outcry; these are also insignificant.
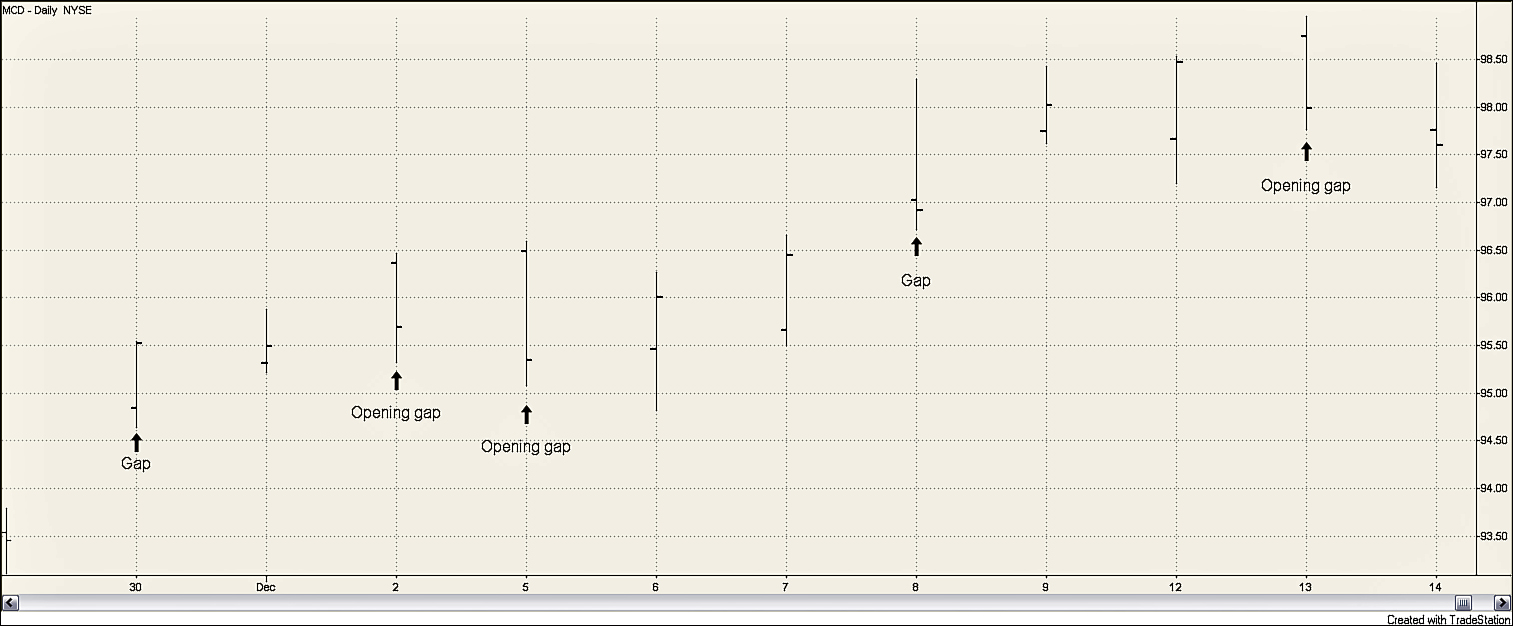
An opening gap occurs when the opening price for the day is outside the previous day’s range. After the opening, price might continue to move in the direction of the gap, forming a gap for the day. Or the price might retrace, closing the gap. Figure 1.4 shows three opening gaps for McDonald’s (MCD). See how, on December 2, MCD opened at a price higher than the December 1 price range. However, the price moved lower during the day, filling the gap, resulting in an overlap for the December 1 and December 2 bars.
Created with TradeStation
Figure 1.4. Opening gap on stock chart for MCD, November 29–December 14, 2011
Of course, any gap begins as an opening gap. On November 30 and December 8, MCD had an opening gap to the upside, and the price never retraced enough on those days to fill the gap. Throughout this book, when we use the term “gap” we are referring to instances in which the gap is not filled within the trading session unless we directly specify that we are discussing opening gaps.
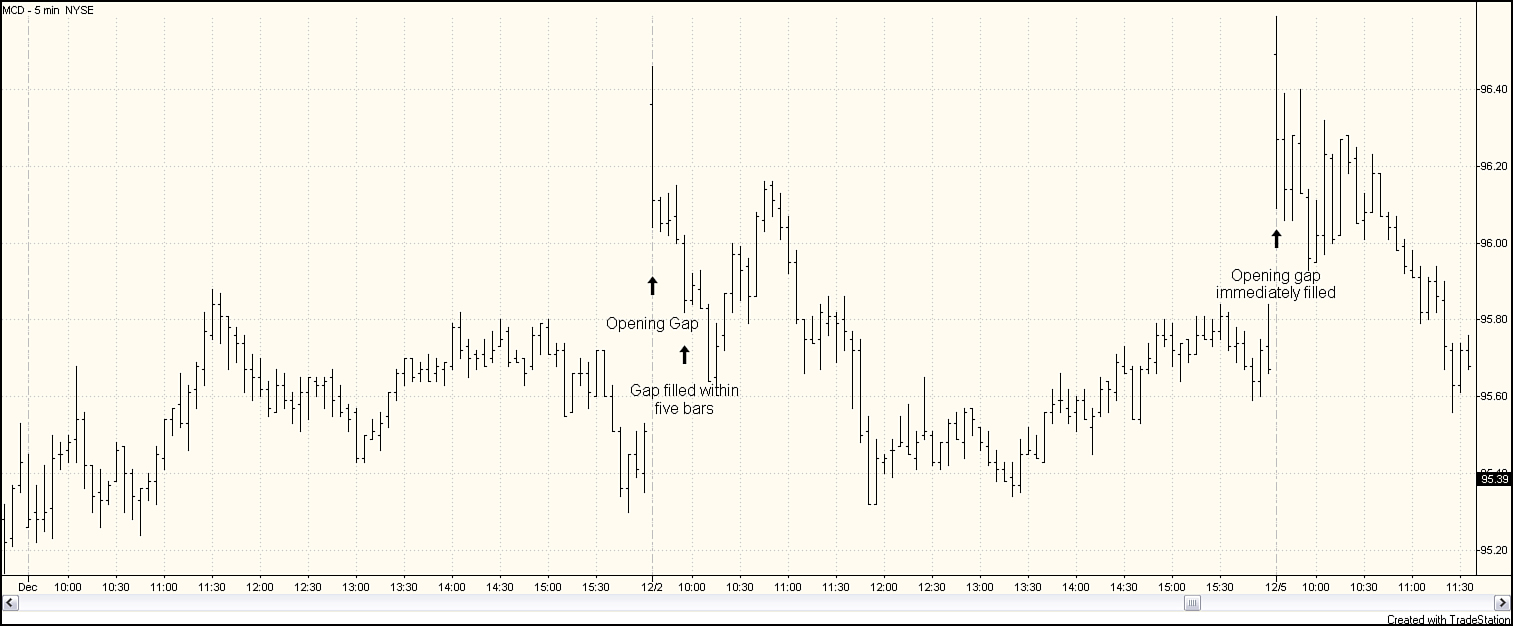
Some traders watch for trading opportunities with opening gaps. General wisdom suggests that if a gap is not filled within the first half hour, the odds of the trend continuing in the direction of the gap increase. Figure 1.4 showed an opening gap on December 2 and on December 5 for MCD. Figure 1.5 shows how quickly these opening gaps were closed by considering intraday data and using 5-minute bars. On December 2, for example, the opening was filled on the fifth 5-minute bar, or within 25 minutes of the open. On December 5, the opening gap was filled within the first 5 minutes of trading.
Created with TradeStation
Figure 1.5. Open gaps filled on intraday stock chart for MCD, December 1–5, 2011
A Note on Terminology
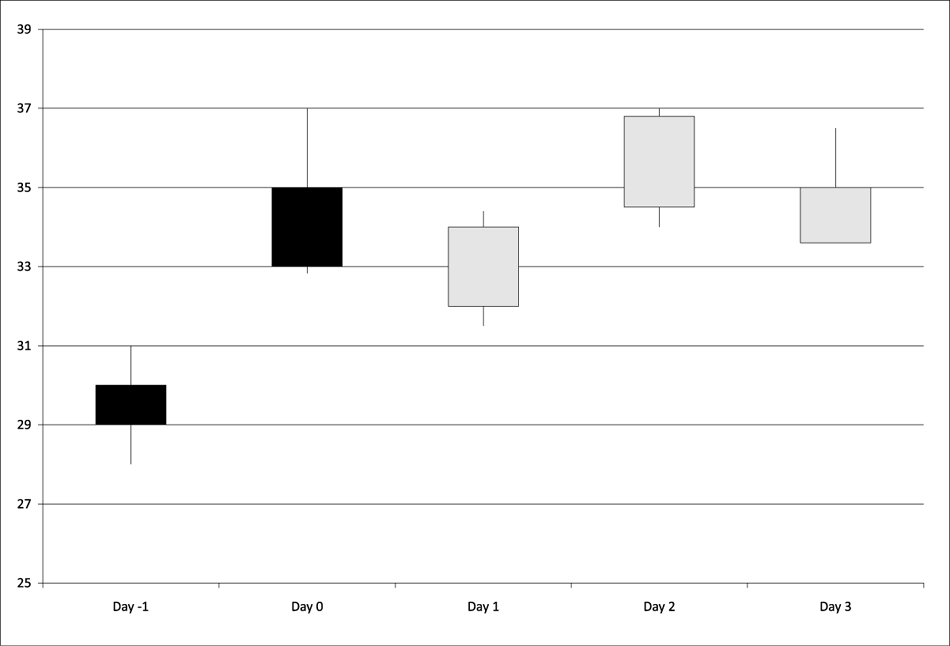
This book focuses on daily charts and trading. To clarify, we use Day 0 to represent the day a gap occurs (see Figure 1.6). The day before the gap is Day –1 and the stock’s high on Day –1 is the beginning of the gap. On the next day (Day 0), the stock’s low exceeds the high on Day –1, forming the gap. We refer to the day of the gap as Day 0 because we do not know until the close of trading that day whether we simply have an opening gap or if we have a gap that remains unfilled.
Figure 1.6. Gap occurs on Day 0
If we are to make trading decisions based upon the occurrence of a gap, the soonest we would be able to enter a position is the open on Day 1. Thus, when we report a 1-day return, we base the return calculation from the open on Day 1 to the close on Day 1. To calculate longer returns, the return is calculated from the open at Day 1 to the close on the day of the return length; therefore, a 3-day return is calculated as buying at the open of Day 1 and selling at the close of Day 3.
How to Use Gaps in Trading
How might a trader, seeing a gap, react to the information? If the trader thinks that the gap is a breakaway gap, he would want to trade in the direction of the gap. In other words, if a breakaway up gap occurred, he would assume an uptrend is beginning and take a long position. If a breakaway down gap occurred, he would assume a downtrend is beginning and take a short position. He would also want to trade in the direction of the gap, if the stock were trending and a gap occurred that he thought was a measuring gap. Throughout this book we refer to trading in the direction of the gap as a continuation strategy in that the trader is expecting the price to continue in the direction of the gap.
If a trader sees a gap she thinks drives the price up so much that there is little room for the price to push higher, she would want to trade opposite of the gap. Suppose, for example, a pharmaceutical company announces that it has received FDA approval for a new drug. Upon the release of this good news, the stock gaps up. If the trader thinks that the market is over-reacting to this good news, she would want to short the stock. Likewise, if she thinks that market players have driven the price down too low on a gap, she would want to take a long position. Remember the old adage that a gap must be filled. The notion that a gap is always filled is based on the idea that the market players do not like to see a hole or a void in a price movement and will work to fill that gap. We refer to trading in the opposite direction of a gap as a reversal strategy.
Traditional technical analysis theory would tell you to trade breakaway and measuring gaps using a continuation strategy. You might want to trade an exhaustion gap with a reversal strategy; however, a major problem is that traditional theory has not provided a sound way to classify a gap as it occurs. It is only in hindsight that you can tell if a gap was a breakaway, measuring, or exhaustion gap.
The main task in this book is to help you pick up on clues as to what type of gap may be occurring so that you can enter successful trades. Chapter 2, “Windows on Candlestick Charts,” discusses traditional Japanese candlestick patterns that contain gaps. Chapter 3, “The Occurrence of Gaps,” looks at the occurrence of gaps and considers the frequency of gaps, the distribution of gaps across stocks, and the distribution of gaps over time. Chapter 4, “How to Measure Returns,” discusses our methodology for determining profitable gap trading strategies. Chapter 5, “Gaps and Previous Price Movement,” considers what clues the price movement leading up to the gap gives you to form profitable trading strategies. Because volume is an indication of how important a particular day’s price movement is, Chapter 6, “Gaps and Volume,” considers the relationship between volume and gap profitability. To determine whether gaps that occur at relatively high prices have a different significance than those occurring at average or relatively low prices, Chapter 7, “Gaps and Moving Averages,” considers the location of gaps relative to the price moving average. Although most of this book focuses on individual securities, you can look at the relationship between gap significance and underlying stock market activity in Chapter 8, “Gaps and the Market.” Chapter 9, “Closing the Gap,” covers the often-heard phrase, “A gap must be closed.” Last, Chapter 10, “Putting It All Together,” provides an overall summary of how gaps can be used as part of an effective trading and investment strategy.
Endnotes
Bulkowski, Thomas N. “Bulkowski’s Free Pattern Research,” http://www.thepatternsite.com, 2010.

