Hour 24. Application Tracing, Monitoring, and Debugging
,What You’ll Learn in This Hour:
![]() Using the
Using the NSLog function
![]() Navigating the Xcode debugger
Navigating the Xcode debugger
![]() Setting breakpoints and watchpoints
Setting breakpoints and watchpoints
![]() Modifying variable values on-the-fly
Modifying variable values on-the-fly
![]() Tracing iOS app execution
Tracing iOS app execution
![]() Monitoring memory and CPU usage
Monitoring memory and CPU usage
Despite our best efforts, no application is ever bug-free. As we end our 24-hour exploration of iOS development, we look at techniques for finding and fixing issues in our applications. The ability to find and eliminate bugs quickly is an essential skill.
Xcode brings together the five basic tools of the software developer’s trade into a single application: the text editor, interface builder, compiler, debugger, and reference documentation. Xcode has debugging tools integrated within it, so all your debugging activities can take place from within the now-familiar interface of Xcode.
This hour covers the debugging and tracing tools included in Xcode. You learn how to use the NSLog function to output debugging information to the Xcode console. You also use Xcode’s debugger to find and correct errors. This will give you a good start toward finding and solving problems that might otherwise lead to hours of head scratching, tears, and extreme frustration.
With the term debugging, it is assumed your project builds with no errors but then encounters an error or otherwise fails to work as designed when it’s executed. If there is an error in your code that prevents it from building, you are still coding, not debugging. The tools in this hour are for improving applications that build but then have logic errors during execution.
Instant Feedback with NSLog
As you’ve developed applications throughout this book, one that has likely become clear is that producing output in an iOS application is more than just saying “print ‘Hello World.’” We must deal with view controllers, scenes, storyboards, labels, outlets, connections, and so on, just to get a bit of text on the screen. This makes the traditional approach of debugging (outputting internal values and messages as a program executes) quite cumbersome. Even if we want to jump through all the hoops of building code and connections to output debugging information, we still have to make sure that none of it appears or interferes with our final production-ready app.
Thankfully, we can quickly generate output from a running application that doesn’t interfere with our interface or application logic. To do so, just enter the humble NSLog function, which you briefly saw in Hour 1, “Preparing Your System and iDevice for Development.” Many a gnarly bug has been slain with just this function alone. At any point in your application, you can use a call to NSLog to confirm the flow of your application into and out of methods or to check the current value of a variable. Any statement you log with NSLog is echoed to Xcode’s debug console.
Using NSLog
The NSLog function takes an NSString argument that can optionally contain string format specifiers. You’ve used these throughout the book to create formatted NSString objects and can get the full list of string format specifiers from the “String Format Specifier” section of the String Programming Guide in Xcode’s Help.
The three string format specifiers you’ll likely need while debugging are %d for integers (often used to debug loop counters and array indices), %f for floating-point numbers, and %@ for any Objective-C object, including NSString objects.
Consider the code fragment in Listing 24.1.
LISTING 24.1 Calling the NSLog Function
NSLog(@"Entering method");
int foo = 42;
float bar = 99.9;
NSLog(@"Value of foo: %d, Value of bar: %f", foo, bar);
NSString *name = @"Klaus";
NSDate *date = [NSDate distantPast];
NSLog(@"Value of name: %@, Value of date: %@", name, date);
In this example, the NSLog function is used to output a string, integer, floating-point value, and two objects (a string and a date). The output looks like this:
2013-12-15 17:12:22.329 Sample[4160:f803] Entering method
2013-12-15 17:12:22.331 Sample[4160:f803] Value of foo: 42, Value of bar: 99.9
2013-12-15 17:12:22.333 Sample[4160:f803] Value of name: Klaus, Value of date:
0001-12-30 00:00:00 +0000
So, where does this output appear? If it isn’t on the iOS device screen, where can you see the results of using NSLog? The answer is the Xcode debugger console, but rather than just telling you where, let’s see this in action.
Note
When the %@ string format specifier is used with an Objective-C object, the object’s description method is called; this can provide additional information about the object within the debugging output. Many of Apple’s classes include an implementation of description that is useful for debugging. If you need to debug your own objects with NSLog, you can implement description, which returns an NSString value.
Viewing the Output
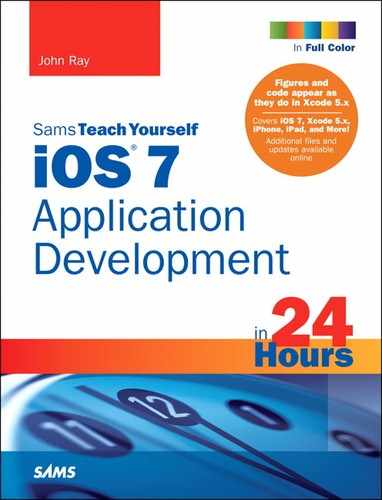
Open the project Counting in this hour’s projects folder. Click Run to start running the application in the iOS Simulator. You’ll see... nothing... just a blank screen with some static text (nothing at all changing on the screen). Behind the scenes, however, the application ran a counter in the view controller’s viewDidLoad method and output the count using NSLog.
If you shift your attention to Xcode, you should be able to see the output in the debug area, as shown in Figure 24.1. If it wasn’t shown automatically, choose View, Debug Area, Activate Console (or press Shift-Command-C). The debug area is usually divided in half—one side for viewing variables, the other (the right side) for showing output. This portion is called the console. You can drag the middle divider to create more room for the console, or you can use the buttons in the lower-right of the debug area to hide or show the left and right columns.
Tip
To quickly access the console area, use the middle button in the Xcode toolbar’s view controls, choose an option from the View, Debug Area menu, or click the hide/show icon (an arrow in a box) at the left side of the debug area.
As you build more projects, NSLog will become a powerful tool in determining that your applications are executing as you expect. It isn’t, however, the most powerful method of debugging an app. For instances where the size or complexity of the application doesn’t lend itself to using NSLog, you’ll want to turn to the Xcode debugging tools, which enable you to view your application as it executes without having to change your code.
Tip
Overwhelmed by output in the debugger console? Click the trash can icon in the lower-right corner to discard any output currently in the debugger console.
Caution: Don’t Go NSLog Crazy
As its name implies, the NSLog function is actually intended for logging, not debugging. In addition to printing the statements to Xcode’s console, the statements are written out to a file on the file system. Logging to the file system is not what you’re intending; it’s just a side effect of using NSLog for debugging. It’s easy to accidentally leave old NSLog statements in your code after you’ve finished debugging, which means your application is taking time to write out statements to the file system and is wasting space on the user’s device. Search through your project and remove or comment old NSLog statements in your application before you build a release to distribute.
Using the Xcode Debugger
NSLog is a good quick-and-dirty approach to debugging, but it is not the best tool for debugging more complex issues. It’s often more productive to use a debugger, which is a tool that lets you examine a running program and inspect its state. It’s been said that what separates true software development professionals from weekend hackers is the ability to proficiently use a debugger. If this statement is true, you are in luck, because using Xcode’s debugger is not hard.
Normally an application executes at computer speeds, which on an iDevice is millions of instructions per second. A debugger acts like the developer’s brake, slowing down the progress of the application to human speeds and letting the developer control the progress of the program from one instruction to the next. At each step in the program, the developer can use the debugger to examine the values of the variables in the program to help determine what’s gone wrong.
Debuggers work on the machine instructions that are compiled from an application’s source code. With a source-level debugger, however, the compiler provides data to the debugger about which lines of source code generated which instructions. Using this data, the source-level debugger insulates the developer from the machine instructions generated by the compiler and lets the developer work with the source code he has written.
Xcode’s iOS debugger, called lldb, is a source-level debugger. The compiler doesn’t always generate the data needed for source-level debugging. It can amount to a lot of data, and it provides no benefit to an application’s users, so the data is not generated in a release build configuration. Before you can benefit from source-level debugging, you need to build your application in a debug build configuration that will generate the debug symbols.
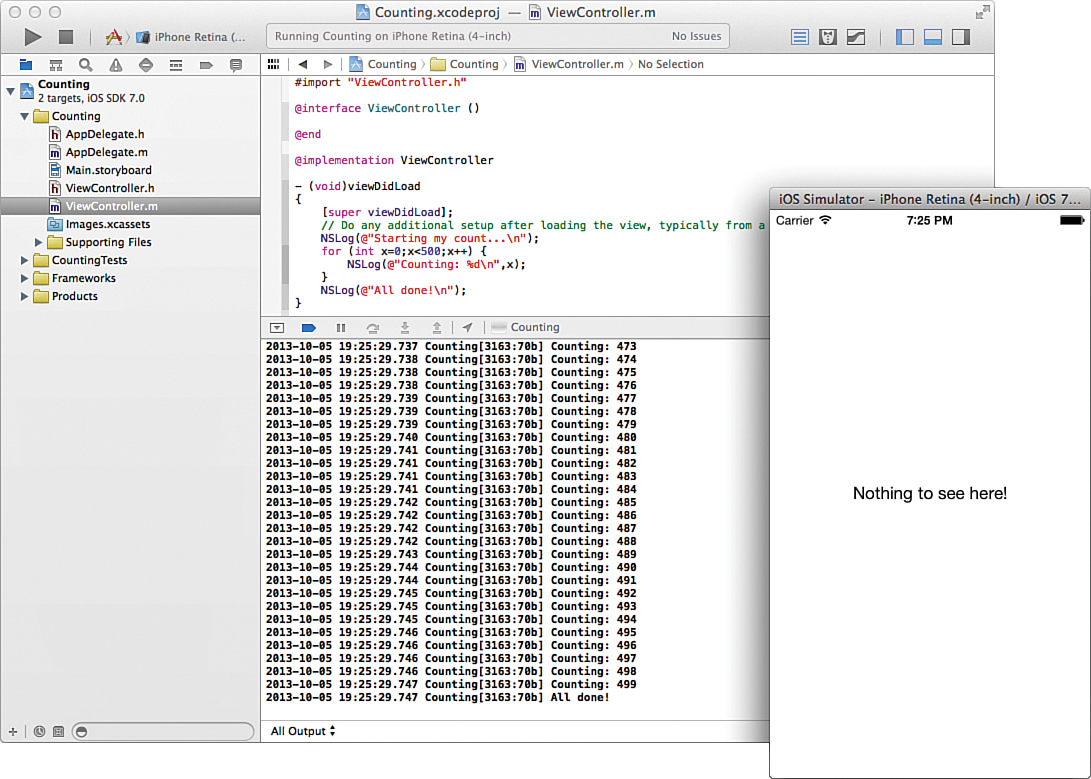
By default, a new Xcode project comes with two build configurations: Debug and Release. The Debug build configuration includes debug symbols, whereas the Release build configuration does not. Whenever you are working on developing your application, you use the Debug configuration so that you can drop into the debugger whenever you need to. Because Debug is usually the build configuration you want to work with, it’s the default configuration, too. To switch to a release configuration, you must build for an iOS device instead of the Simulator, and you must use the Product, Scheme, Edit Scheme menu to switch to a Release configuration. In Figure 24.2, for example, I’ve set my Scheme so that when I run my app I will be running it on an iOS device in a Release configuration.
Note
Make sure that you remember to use the Release build configuration when you create a version of your application for distribution.
Setting Breakpoints and Stepping Through Code
To use the debugger, you must have something to debug. For the rest of this hour, we work through building and debugging a simple application.
Create a new Xcode project with the Single View iOS Application template and call it DebuggerPractice. There is no user interface (UI); therefore, no outlets and actions are required in this exercise.
Tip
The debugger often references source code line numbers, and it is helpful to have these displayed in the gutter. Turn on line numbers by opening the Xcode preferences and activating the Line Numbers option under the Text Editing settings.
Open the ViewController.m file and begin by adding a new method near the top of the implementation file. This method, describeInteger, returns a string with the word even if an integer passed to it is divisible by 2 or the word odd if it isn’t. Listing 24.2 contains my implementation of this method.
LISTING 24.2 Implementing the describeInteger Method
-(NSString *)describeInteger:(int)i {
if (i % 2 == 0) {
return @"even";
} else {
return @"odd";
}
}
Next, edit the viewDidLoad method. Add a for loop that uses NSLog to display the numbers between 1 and 10 in Xcode’s debugger console. For each iteration of the loop, the method should call describeInteger with the loop’s counter. This provides activity that we can monitor in the debugger. Your method should resemble Listing 24.3.
LISTING 24.3 Editing the viewDidLoad Method
- (void)viewDidLoad
{
[super viewDidLoad];
// Do any additional setup after loading the view, typically from a nib.
NSString *description;
NSLog(@"Start");
for (int i = 1;i <=10;i++) {
description = [self describeInteger:i];
NSLog(@"Variables: i - %d and description - %@", i, description);
NSLog(@"----");
}
NSLog(@"Done");
}
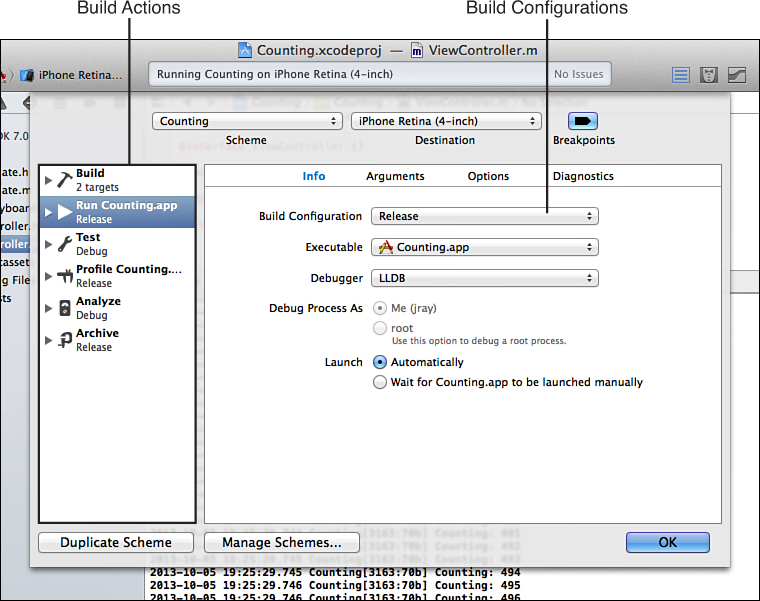
After entering the code, take a moment to look at the editor. Notice the light-gray area (essentially a margin) located to the left of your code. This is called the gutter and is where you configure many of Xcode’s debugging features. Figure 24.3 shows the gutter.
Show the debug area, and click the Breakpoints button on the toolbar above the debug area; this enables debugging. Alternatively, you can choose Debug, Activate Breakpoints (Command-Y) from the menu bar. Now start your app. The program starts up and brings us to our application’s empty view.
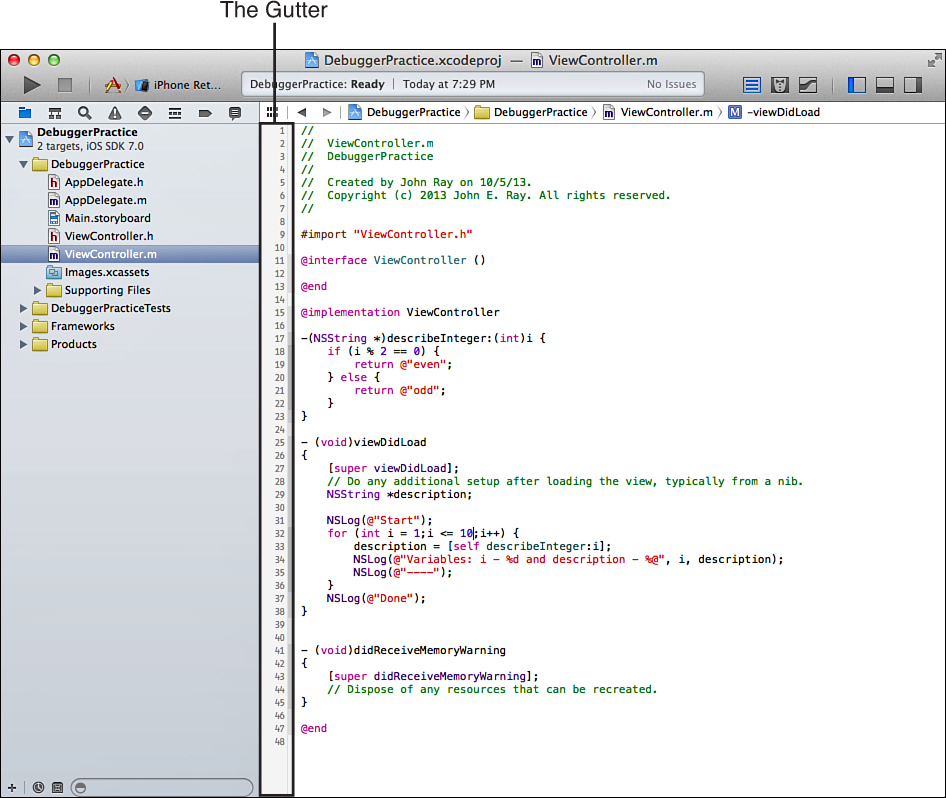
The output from our NSLog statements are in the debugger console, but nothing else, as demonstrated in Figure 24.4.
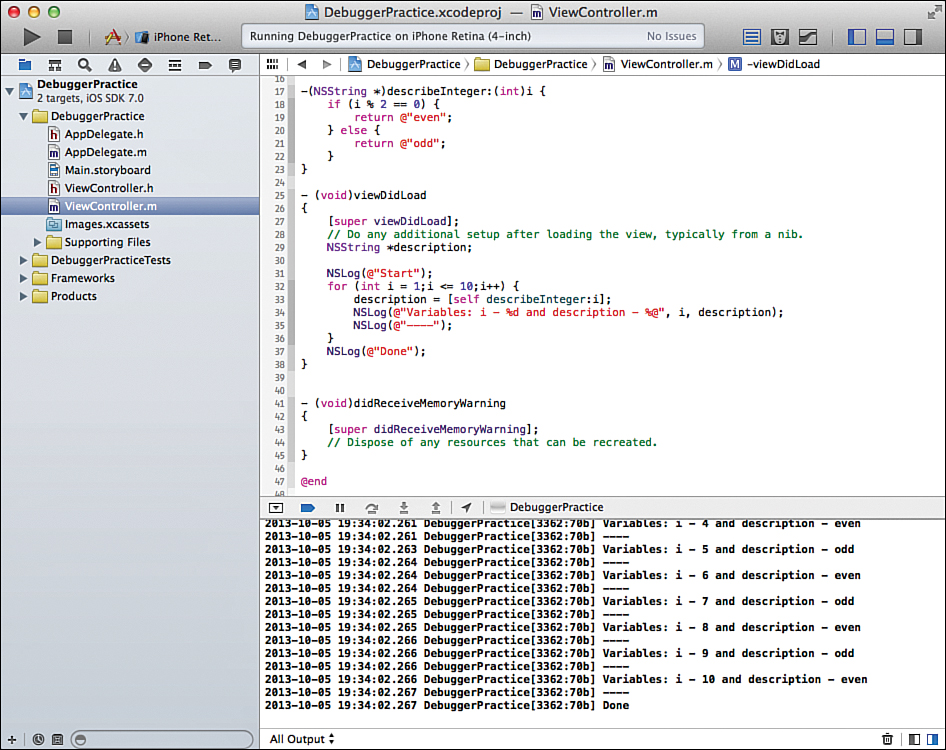
The lldb debugger is running; we just haven’t told it that we want it to do anything. The most common way to start interacting with the debugger is to set a breakpoint in your application’s source code.
Setting a Breakpoint
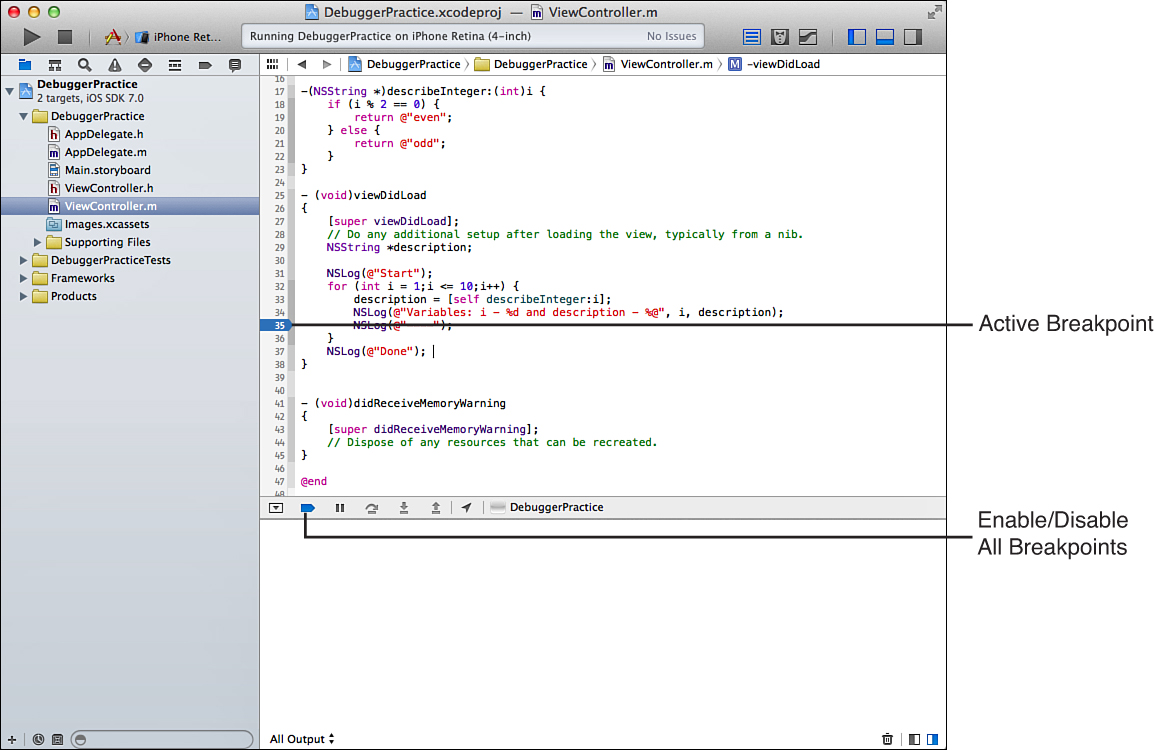
A breakpoint is an instruction to the debugger letting it know you want the program execution to pause at that point. To set a breakpoint, click once in the gutter next to the line where you want the application to pause. A breakpoint will appear as a blue arrow, as demonstrated in Figure 24.5. Click the arrow to toggle the breakpoint off and on. When the breakpoint is on, it is displayed as a solid blue color. When it is off, it is light transparent blue, and the debugger ignores it. To remove a breakpoint, simply drag it out of the Xcode gutter and it will disappear. While a program is executing, a green arrow in the gutter indicates the current line of source that is active.
Let’s create and use a breakpoint. Quit the execution of the application by clicking the Xcode Stop button, and then click the gutter to set a breakpoint next to this line in the viewDidLoad method of ViewController.m:
NSLog(@"----");
Make sure the breakpoints icon is highlighted in the toolbar (this enables/disables debugging breakpoints), and then click the Run button. Notice that the application stops after printing just one of the inner loop statements to the debugger console:
2013-12-02 23:52:30.643 DebuggerPractice[33283:c07] Start
2013-12-02 23:52:30.645 DebuggerPractice[33283:c07] Variables: i - 1 and
description - odd (lldb)
The debugger has paused the execution of the application at our breakpoint and is awaiting further direction, as shown in Figure 24.6.
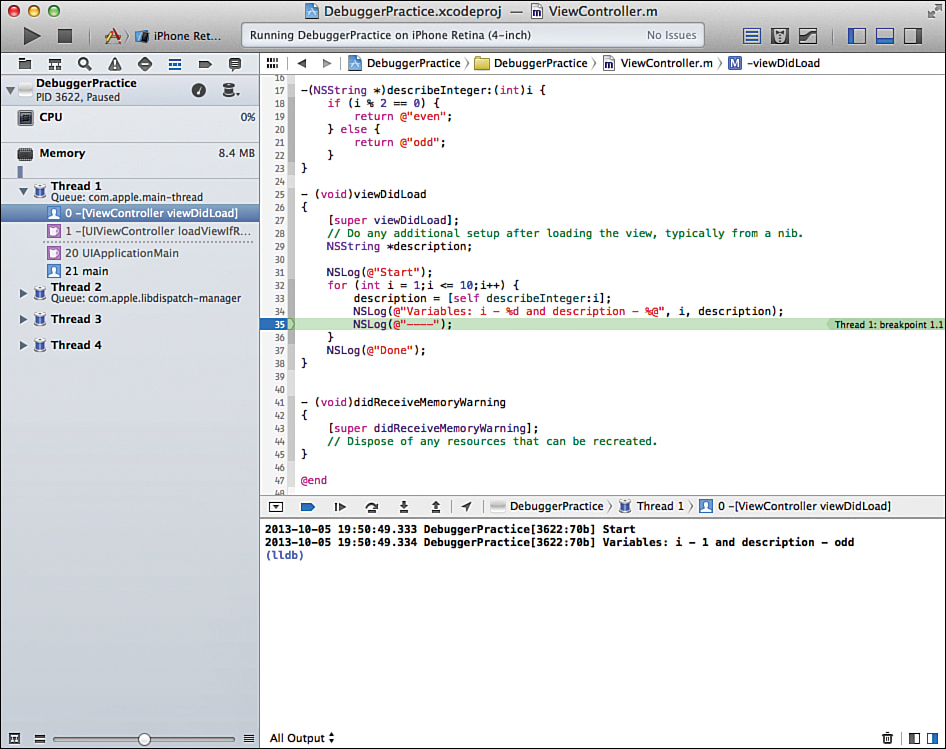
Note
The Xcode debugger pauses when it reaches a line with a breakpoint, but it does not execute that line. You must manually continue execution for the line with the breakpoint to be run. You’ll see how this works shortly.
Examining and Changing Variable States
Now that the execution of the program is paused in the debugger, we can inspect the value of any variables that are in scope. One of the easiest ways Xcode provides to examine variables is the debugger datatip. Just hover over a variable in the source code of the paused method and Xcode will display a popover, visible in Figure 24.7. For simple variable types, you’ll just see the value of the variable. Objects, however, will display more information, including the class type, and a QuickLook icon for displaying details about the object.
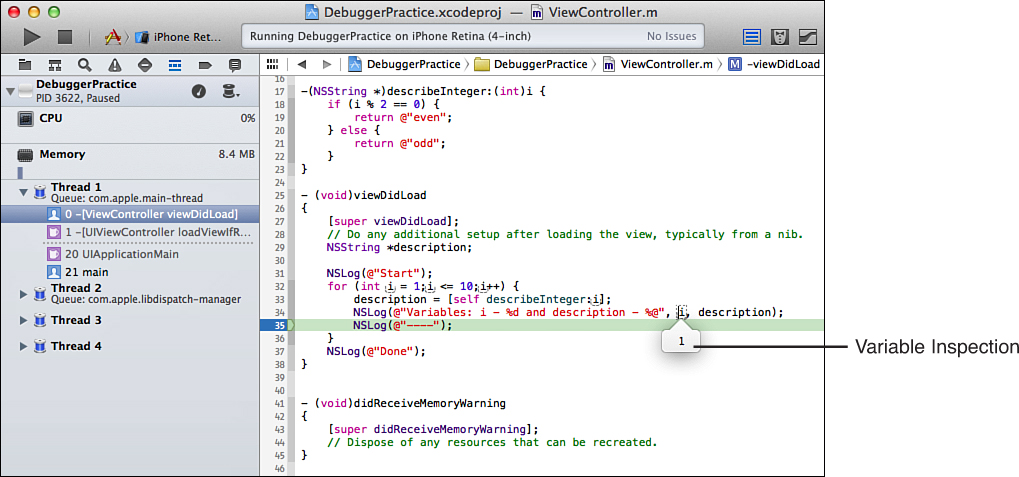
Hover over the i loop counter in the for statement and then the description variable. Notice that the datatip for i is just one level, but the datatip for the more complex NSString object has multiple levels. Click the disclosure arrows to see the additional levels.
Datatips can also be used to change the value of a variable. Again, hover over the i variable in the for loop statement and click the value in the datatip. It is currently 1, but you can change it to 4 by clicking the current value, typing 4, and pressing Enter. The value in the running program is immediately changed, so the next trip through the loop logs to the console with a value of 5, and there won’t be a logged statement with a value of 2, 3, or 4. To confirm that the program does execute as if the i variable has a value of 4, we need to continue the execution of the program.
Stepping Through Code
By far, the most common debugging activity is watching the flow of your application and following what it does while it’s running. To do this, you need to be able to control the flow of execution, pausing at the interesting parts and skipping over the mundane.
The debugger provides five icons for controlling program execution (see Figure 24.8):
![]() Toggle Breakpoints: Toggles breakpoints on and off for the entire application.
Toggle Breakpoints: Toggles breakpoints on and off for the entire application.
![]() Continue: Resumes execution of the paused program, pausing again at the next error or active breakpoint.
Continue: Resumes execution of the paused program, pausing again at the next error or active breakpoint.
![]() Step Over: Steps to the next line of code in the same method.
Step Over: Steps to the next line of code in the same method.
![]() Step Into: Steps into the method that is being called. If a method isn’t being called on the current line of code, it acts like Step Over.
Step Into: Steps into the method that is being called. If a method isn’t being called on the current line of code, it acts like Step Over.
![]() Step Out: Steps out of the current method back to the caller of the current method.
Step Out: Steps out of the current method back to the caller of the current method.
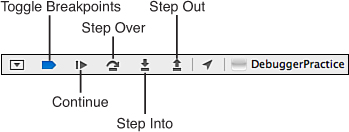
You’ll notice a sixth icon beside the Step Out control. You use this to set a simulated location for location services. I’m not sure why Apple chose to place it there, but they did. It does not affect day-to-day debugging.
Whereas the global breakpoint control is obvious (and useful), the other options might not be so clear. Let’s take a look at how each of these works to control the flow of our application. First click the Continue icon a couple of times. Control returns back to the same breakpoint each time you continue, but if you hover over the i and description variables, you’ll see that i is incrementing and description is switching between even and odd.
Add a breakpoint to this line of code by clicking the gutter:
description = [self describeInteger:i];
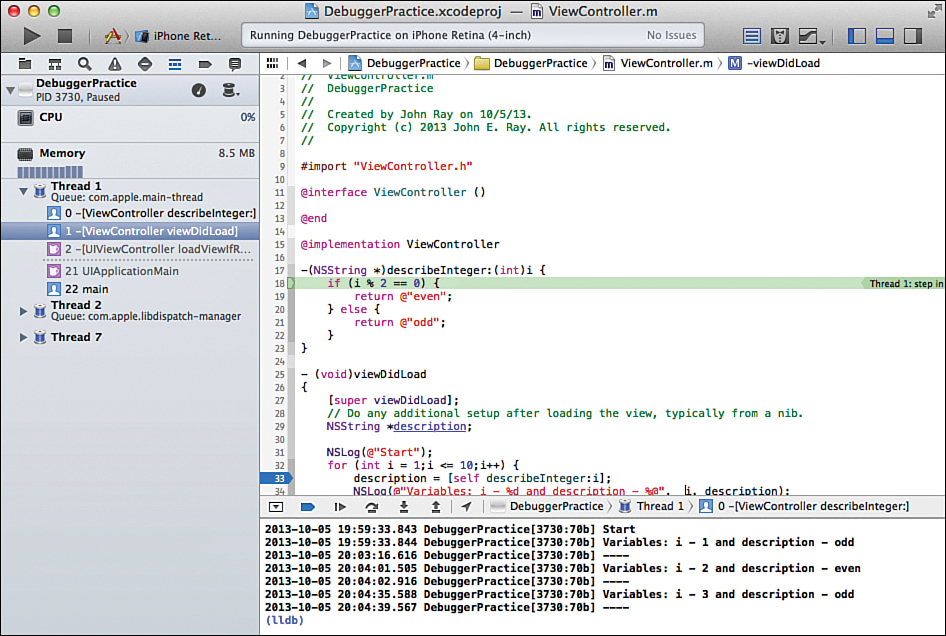
Click the Continue icon again, and this time you’ll see the program stops at the new breakpoint because it’s the next breakpoint the program encounters. This breakpoint is on a line of source where we are calling the describeInteger method. If we want to see what’s going on inside that method, we need to step into it. Click the Step Into icon, and the program stops on the first line of the describeInteger method, demonstrated in Figure 24.9.
To step line by line through a method without entering any of the methods that might be called, use the Step Over task. Click the Step Over icon three times to step through the describe Integer method and return to the viewDidLoad method.
Click the Continue icon until you return to the breakpoint on the describeInteger method, and click the Step Into icon to step into the method a second time. This time, instead of stepping all the way through describeInteger, click the Step Out icon and you’ll be stopped back at the line where the describeInteger method was called. The rest of the describeInteger method still executed; you just didn’t watch each step of it. You are stopped where the program flow has just exited the describeInteger method.
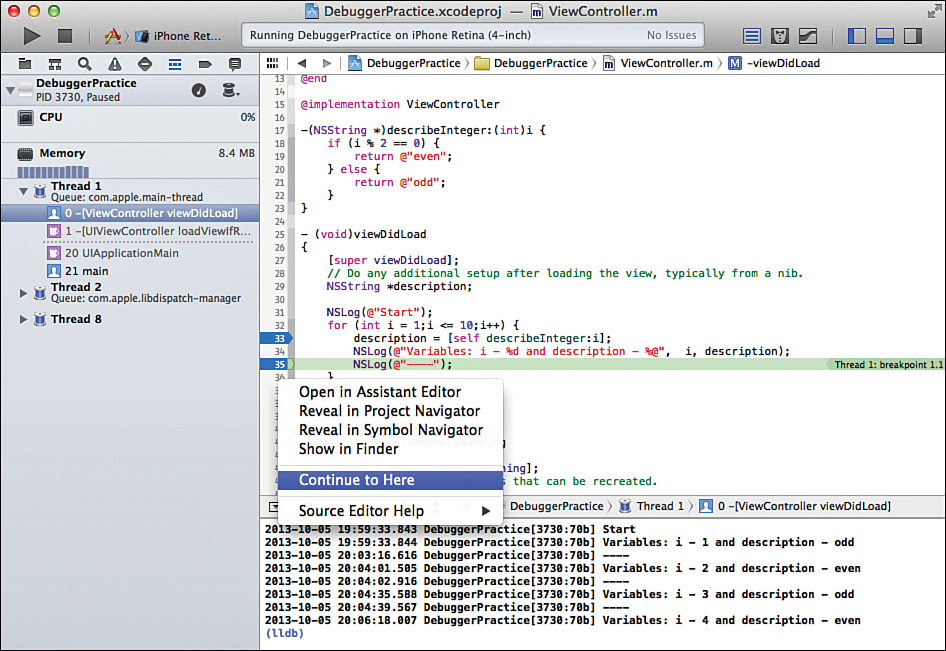
In addition to these program control tasks, another important option is hidden in the gutter. It’s called Continue to Here. Continue to Here works on the line of code you select it on, and it works like a combination of the continue task and a temporary breakpoint. Program flow continues until it reaches an error or an active breakpoint or it reaches the line of code you continued to.
To try this, make sure you’re stopped at a breakpoint in viewDidLoad, and then right-click in the gutter next to this line:
NSLog(@"Done");
Click Continue to Here in the contextual menu, as shown in Figure 24.10. Notice that we didn’t make it to the line of code we continued to; we stopped on one of the two existing breakpoints inside the for loop.
Note
You can also access the Continue to Here function by hovering your mouse near the right side of the gutter and clicking the green circle with arrow icon that appears next to the code line in the editor. Unfortunately, Xcode is very touchy about when it shows the icon while hovering, so you may find the contextual menu approach the most reliable.
Click each breakpoint once to make it inactive, and click Continue to Here on the gutter next to the final line of the method one more time. This time we make it to the end of the method. Inspect the i and description variables with the hover datatip and notice that description’s value is even, but i is no longer in scope and can’t be inspected. The i variable was scoped only to the for loop, and now that we have exited the for loop, it no longer exists. You can now stop the iOS application.
Setting a Watchpoint
Let’s suppose now that there is a tricky bug in your application that only occurs on the 1,000th time through the loop. You wouldn’t want to put a breakpoint in the loop and have to click the continue icon 1,000 times. That’s where a watchpoint comes in handy. A watchpoint is a conditional breakpoint; it doesn’t stop execution every time, it stops only when a condition you define is true.
To test this out, update the for loop to execute 2,000 times rather than 10 times. Your view DidLoad method should now resemble Listing 24.4.
LISTING 24.4 Updating viewDidLoad to Loop 2,000 Times
- (void)viewDidLoad
{
[super viewDidLoad];
// Do any additional setup after loading the view, typically from a nib.
NSString *description;
NSLog(@"Start");
for (int i = 1;i <= 2000;i++) {
description = [self describeInteger:i];
NSLog(@"Variables: i - %d and description - %@", i, description);
NSLog(@"----");
}
NSLog(@"Done");
}
Now let’s set a watchpoint that stops execution when the loop counter equals 1,000. First, remove the existing breakpoints by dragging them out of the gutter. Next, add a normal breakpoint by clicking in the gutter next to this line:
NSLog(@"Start");
Add a second breakpoint here:
NSLog(@"Variables: i - %d and description - %@", i, description);
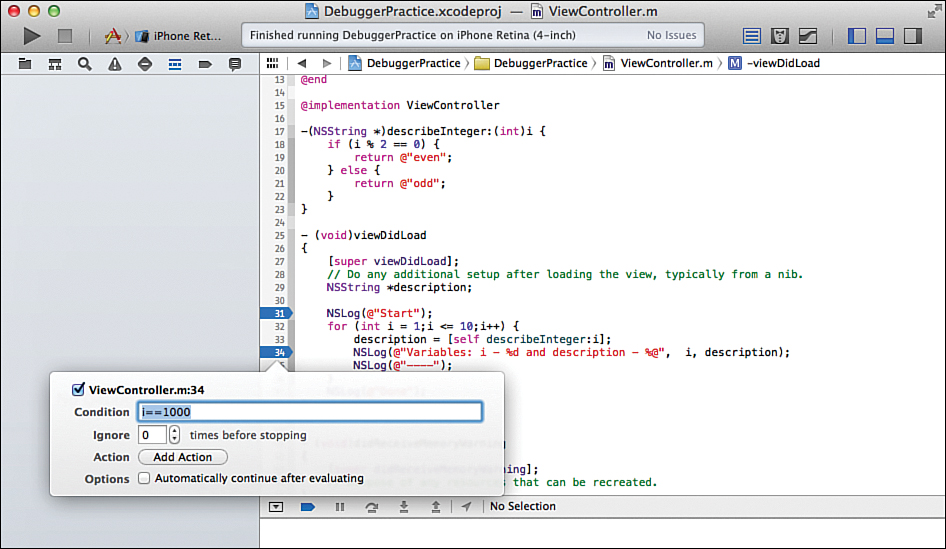
Then right-click the second breakpoint and choose Edit from the contextual menu. The Breakpoints dialog then opens, as shown in Figure 24.11. Here you can use the Condition field to specify when the breakpoint becomes active. Set the condition to i == 1000.
Click the Run button to execute the application. The program stops at the first breakpoint. Click the Continue icon, and the application will go through the loop 999 times before stopping on the watchpoint on the 1,000th trip through the loop when the loop counter i is equal to 1,000. You can confirm this by looking at the 999 log messages in the debugger console or by hovering over the i variable in the source and looking at its value in the datatip.
Accessing the Variable List
If, at any time, you want to access a list of all variables that are active in your current method, you can do so by viewing the left half of the debugger area. The buttons in the lower-right corner of the debugger toggle the Variable List (left side) and Console (right side) To this point, we’ve been focusing solely on the Console view.
Make sure that the Variable List is visible, and you’ll see that both the i and description variables (and their values) that we’ve been inspecting with datatips are shown prefixed with an L icon, as shown in Figure 24.12. This means these variables are declared locally in the method that is currently executing. You’ll also see A icons for Arguments scope variables that have been passed into the current method as arguments. A pop-up menu at the lower-left corner of the Variable List enables you to show All variables, Local variables only, or Auto—to let Xcode choose what it thinks is relevant.
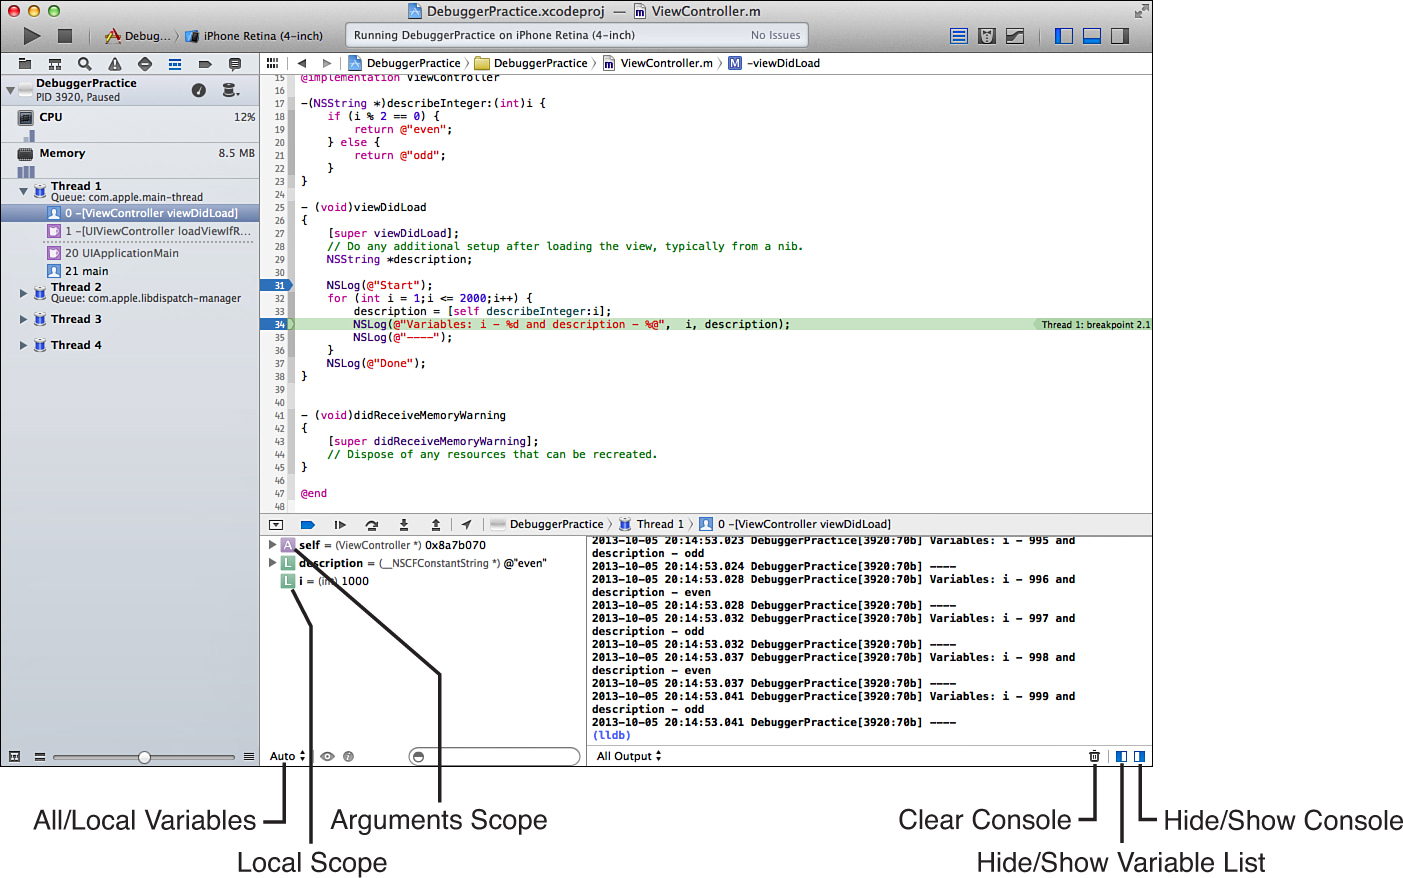
FIGURE 24.12 Use the Variable List to inspect and change the value of active variables in your application.
Double-clicking a variable line in the Variable List enables you to change its value, just as you could through the datatips.
Using the Debugger Navigators
We first looked at the debugger by examining console output, and since then we’ve focused on debugging in that area alone. There are also two navigator area displays—the debug navigator and the breakpoint navigator—that have some helpful benefits. You may have noticed these appearing on the left side of the Xcode workspace while working with the debugger. You can jump to either at any time by selecting them from the View, Navigators menu.
The Breakpoint Navigator
Large projects with hundreds of breakpoints can get out of hand quickly. Where are all the breakpoints? How do you selectively enable/disable/edit/remove them? The breakpoint navigator, shown in Figure 24.13, is your one-stop shop for managing breakpoints in your project.
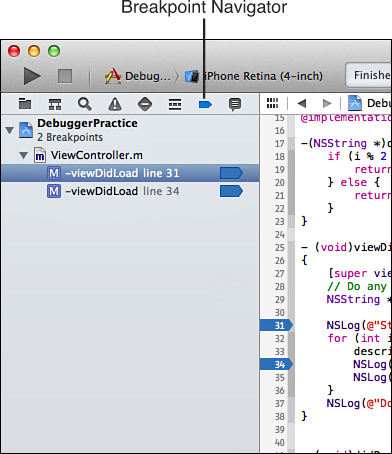
All breakpoints are listed by the file where they are located. You can click any breakpoint to jump to that spot in your code or right-click any listed breakpoint to manage it (including setting conditions, disabling it, and so on).
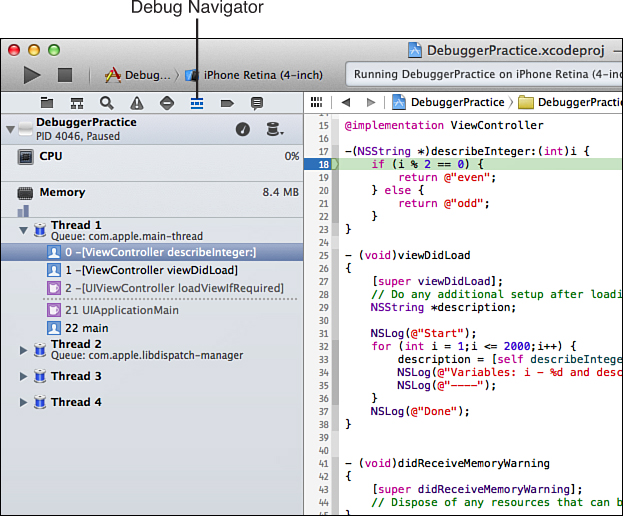
The Debug Navigator
The debug navigator displays the application’s call stack listed by thread. A call stack is the list of all the subroutines (methods and functions) currently being executed. Each method in the call stack has been called by the method below it. To better understand this, it is best to see it in action.
Remove the existing breakpoints from your code, and then add a new breakpoint at the start of describeInteger by clicking in front of this line:
if (i % 2 == 0) {
Now, execute your code and let the breakpoint take effect. After execution has stopped, open the debug navigator by choosing View, Navigators, Show Debug Navigator or by clicking the navigator area toolbar icon (two solid lines with a dashed line in the middle).
Notice that the describeInteger method of our view controller is at the top of the stack and was called by the viewDidLoad method, exactly as we’d expect. The call stack entries listed with a blue icon are code that we have implemented in our project; clicking one of these entries shows a green cursor where the program execution is currently “waiting.” The describeInteger method is waiting on our breakpoint, while the viewDidLoad method waits on the describe Integer method (and so on). Figure 24.14 shows an example of a call stack.
The rows in the call stack that are not in blue are for methods where the debugger only has assembly language available. Click one to see some Assembly code. (Doesn’t that make you thankful that we have a source-level debugger?)
Monitoring CPU and Memory Usage
In Xcode 5, the debug navigator has a new trick up its sleeve. In addition to showing a stack trace, it also shows the CPU and memory usage of your application over time. This can show you whether your application is leaking memory or trying to ask the processor to do too much (eating battery life and leading to poor performance).
To show you how this works, I’ve included a project called CountToDisaster in the Hour 24 Projects folder. This application creates a string, then, every second, sets the string to itself appended with itself (doubling the previous memory usage every second). In a very short time, the application runs out of memory and crashes. As this happens, you can watch the memory usage and CPU usage go up in the debug navigator.
Open the project, switch to the debug navigator, and then click the Run button. Within the Debug Navigator column, you’ll see tiny graphs showing memory and CPU usage as the application runs. Clicking one of these graphs, however, expands to show a detailed dashboard with the actual memory (or CPU) usage and how it compares to the other iOS processes running, as shown in Figure 24.15.
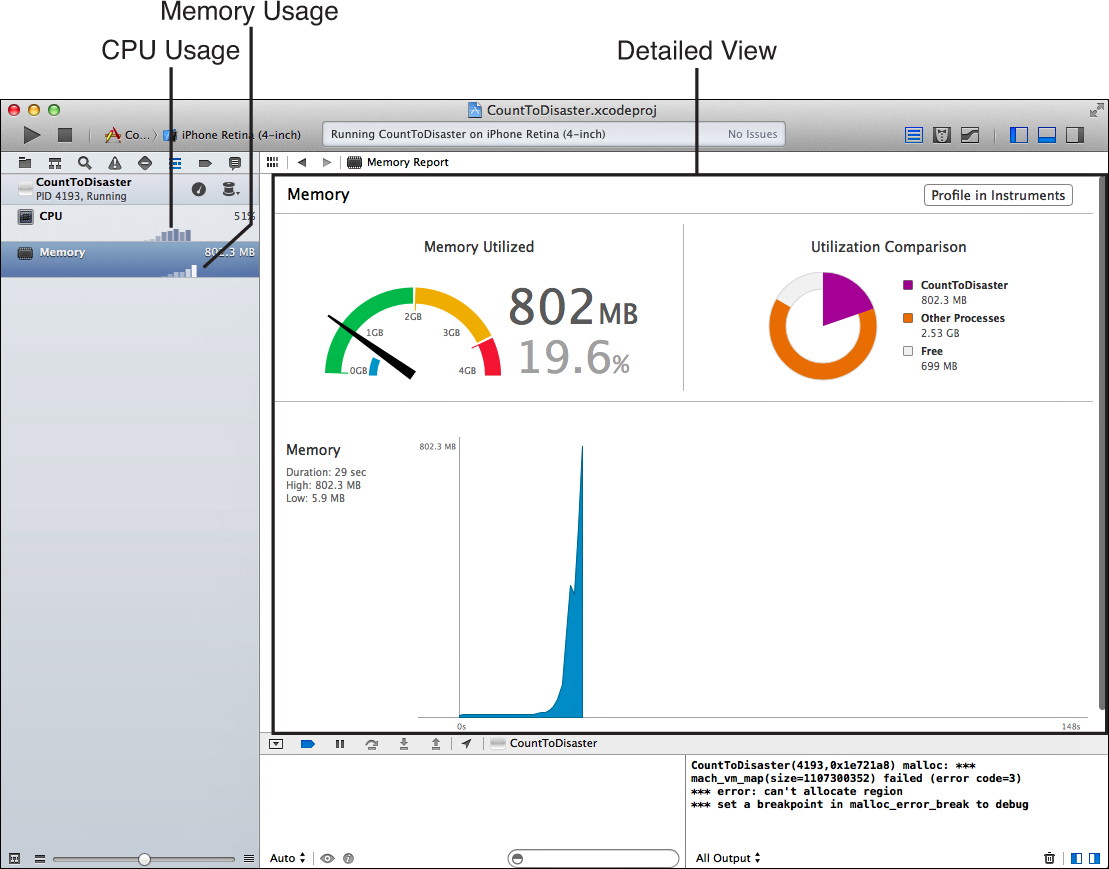
The CountToCrash app will eventually crash, and, with more than a gigabyte of memory used when it does, we can definitely surmise that it is a poorly written app! You’ll want to use these tools to verify that your application is a well-behaved iOS citizen, especially if you are using background processing.
You’ve done enough now to start getting the hang of using the Xcode debugger system. With just these tools for controlling program flow and inspecting and changing program state, you can debug many of the issues you may encounter as you step into the exciting world of iOS development.
Further Exploration
Invest some time into becoming proficient with Xcode debugging. When you’re approaching the launch date for your application, you’ll want to check and double-check your code. In these cases, time is short and the stress level is high, so it’s not the ideal circumstances to be learning application debugging for the first time. Become comfortable with these tools now, and they’ll provide a significant productivity boost when you need it the most.
Xcode offers many other tools for testing and optimizing your applications, but each could take a book in its own right. The Instruments system, for example, allows you to stress-test your application under a number of conditions and identify potential problems. You can even use Instruments to automate user interaction with yourapps to test them. Learn more about Instruments in the Instruments User Guide, accessible within the Xcode developer documentation.
As you’ve learned throughout this book, Xcode is a large, large product. You’ll be discovering new features for a long time to come. Don’t be concerned if your application development workflow varies from what we’ve covered over the past 24 hours; development is as much as creative process as it is technical. Each developer is unique, and Xcode aims to make each of us empowered and productive.
Summary
In this last hour, you learned how to use NSLog for quick debugging and the Xcode debugger for examining the inner workings of your code. Using a debugger takes much longer than an hour to understand everything it can do for you, but the goal has been to give you enough exposure that you recognize when you need the benefits of the tools.
With that, you’ve reached the end of this book. I sincerely hope that you’ve enjoyed yourself and are ready to write some apps. Remember to visit the support website http://teachyourselfios.com for additional materials and corrections.
Q&A
Q. Why is using a debugger easier or better than just using NSLog?
A. NSLog is a great place for beginning developers to start. It gives a degree of insight into what is going on in the code, without having to change the development process. Using the full-blown Xcode debugger, however, will enable you to view and modify values in your code as it is running. In addition, it doesn’t require any changes directly to your code, so there isn’t a need to remove debugger statements when the code is clean. Using a debugger takes awhile to get used to, but for large projects, it is a must.
Workshop
Quiz
1. What is a breakpoint? What is a watchpoint?
2. What is a call stack?
3. You can use the Xcode debugging tools to change the value of a variable while your program is executing. True or false?
Answers
1. A breakpoint tells the debugger to stop execution at the start of a particular line of source code so that the developer can inspect and possibly change the state of the running application and control and monitor the application’s progress. A watchpoint is a conditional breakpoint that stops execution only if a specified condition is true.
2. A call stack is the list of all the subroutines (methods and functions) currently being executed.
3. True. The Xcode debugger enables you to modify your variables as the code runs. This can be useful for testing a variety of conditions, but be aware that the debugger will allow you to set variables to values that couldn’t possibly be generated by your code. It’s that flexible.
Activities
1. Try breaking applications by using the debugger to set values outside their bounds—text in numeric fields, loops that extend beyond their endpoint, and so on. How does Xcode react?
2. Use the debugging tools to monitor the inner workings of the applications you built earlier in this book. Then take a break, eat a sandwich, and take a walk outside.