Portfolio drivers are the foundation of the top-down method. All subsequent portfolio decisions—country, sector, style, and security—stem from these higher level themes. Thus, accurately identifying current and future drivers is critical to success. In this chapter, we'll teach you to evaluate market conditions, aided by the knowledge and context accumulated in preceding chapters, to develop portfolio drivers for emerging markets. By developing and analyzing portfolio drivers you can better determine the market most likely to outperform or underperform your benchmark (i.e., the broader stock market) and allocate your portfolio appropriately.
Despite some categorical similarities, emerging market countries are a diverse lot. Previous chapters provided a glimpse into these differences, but one only needs to open the newspaper to quickly appreciate the diversity across the category. Political models, economic composition, and social norms vary widely. Not surprisingly, market performance is equally disparate—both country and sector performance vary widely year to year. This underlines the importance of correctly identifying portfolio drivers.
Table 6.1 shows the best- and worst-performing countries in emerging markets and the spread between them each year since 1988. There are two important takeaways from the data. First, the difference between the best- and worst-performing countries tends to be substantial. In 2007, for instance, there was nearly a 100 percent spread between Peru (94 percent) and Argentina (−4 percent), even though they are neighbors in the same region and share some of the same drivers!
Table 6.1. Best- and Worst-Performing Emerging Market Country by Year
Year | Best Country | Return | Worst Country | Return | Spread |
|---|---|---|---|---|---|
Note: Price returns in US dollars. Source: Thomson Datastream, MSCI Inc.[168] as of 12/31/2008. | |||||
1988 | Indonesia | 228% | Turkey | −63% | 291% |
1989 | Turkey | 472% | South Korea | 0% | 471% |
1990 | Mexico | 59% | Brazil | −66% | 124% |
1991 | Argentina | 402% | Indonesia | −46% | 448% |
1992 | Philippines | 37% | Turkey | −50% | 87% |
1993 | Poland | 745% | Israel | 14% | 731% |
1994 | Brazil | 64% | Poland | −55% | 119% |
1995 | Peru | 22% | Pakistan | −38% | 60% |
1996 | Russia | 151% | South Korea | −38% | 189% |
1997 | Russia | 112% | Indonesia | −75% | 186% |
1998 | Korea | 138% | Russia | −83% | 221% |
1999 | Russia | 246% | Colombia | −19% | 265% |
2000 | Israel | 25% | Indonesia | −63% | 88% |
2001 | Russia | 53% | Egypt | −44% | 97% |
2002 | Pakistan | 151% | Argentina | −51% | 201% |
2003 | Thailand | 144% | Malaysia | 27% | 117% |
2004 | Colombia | 132% | Thailand | −1% | 134% |
2005 | Egypt | 162% | Malaysia | 2% | 159% |
2006 | China | 83% | Turkey | −7% | 90% |
2007 | Peru | 94% | Argentina | −4% | 98% |
2008 | Morocco | −11% | Pakistan | −74% | 63% |
Table 6.2. Best- and Worst-Performing Emerging Market Sector by Year
Year | Best Sector | Max | Worst Sector | Min | Spread |
|---|---|---|---|---|---|
Source: Thomson Datastream, MSCI Inc.[169] | |||||
1995 | Tech | 11.6% | Materials | −14.5% | 26.1% |
1996 | Energy | 29.8% | Tech | −15.3% | 45.1% |
1997 | Energy | 18.4% | Industrials | −41.0% | 59.4% |
1998 | Tech | 4.0% | Energy | −51.4% | 55.5% |
1999 | Tech | 138.6% | Industrials | 28.1% | 110.5% |
2000 | Health Care | 1.4% | Tech | −44.7% | 46.1% |
2001 | Energy | 14.2% | Telecom | −18.2% | 32.4% |
2002 | Materials | 18.0% | Tech | −22.0% | 40.0% |
2003 | Energy | 84.7% | Consumer Staples | 39.9% | 44.8% |
2004 | Financials | 39.5% | Health Care | 7.7% | 31.8% |
2005 | Energy | 62.4% | Industrials | 25.5% | 36.9% |
2006 | Utilities | 47.4% | Health Care | −8.6% | 56.1% |
2007 | Industrials | 69.6% | Tech | 2.1% | 67.5% |
2008 | Health Care | −17.4% | Industrials | −62.0% | 44.6% |
Second, country leadership changes often because drivers change. Russia is the only country to repeat as the best performer two years in a row (and that was only once, in 1996–1997), and countries have often moved from best to worst (and vice versa). The drivers behind Peru's outperformance in 2007 clearly didn't hold moving forward—the country fell 40 percent in 2008.[167]
A similar phenomenon exists across sectors. Table 6.2 shows the best- and worst-performing sectors in emerging markets and the spread each year since 1995 (unfortunately, sector data are limited going back in time). Spreads are generally narrower than countries where leadership repeats more often. But the difference is still substantial enough to greatly impact relative performance. Thus, success will be greatly determined by your ability to properly identify the countries and sectors most likely to outperform or underperform. This, in turn, rests on being able to correctly develop and analyze portfolio drivers.
To begin developing portfolio drivers, it's necessary to achieve proper context. As mentioned in Chapter 2, stock prices are ultimately a function of supply and demand. This is basic Economics 101, yet most investors fail to consider pricing mechanisms in this context. They're often distracted and overwhelmed by talking heads on television, "research reports" from brokerage firms, or even their next-door neighbor spouting any number of economic, technical, or crazy conspiracy theories. These may make for interesting storylines, but they aren't going to help you develop sound investing drivers. Rather, it all boils down to the mundane economic laws of supply and demand. To appropriately identify drivers, you must frame stocks in this context.
The supply of most goods can quickly change. For instance, most modern cars can be assembled in a day; Toyota can rapidly adjust the pace of manufacturing to account for changes in demand. Not so for securities. New stocks usually come to market via an initial public offering (IPO) or secondary offering. Just think how long these need to evolve and the amount of advance notice companies are required by law to give investors. Creating or destroying supply takes time and effort, allowing you to pretty much assume it's fixed in the short term. Stock prices 10 years from now will be determined more by what happens to supply in eight or nine years, not today.
Demand, on the other hand, can shift powerfully in the short term and is therefore more important in making a forecast for the here and now. Any number of daily, weekly, or monthly events can shift the demand for stocks—a management change, a quarter or two of bad economic data, and so on. The list is endless. But with quickness comes fickleness. Thus, you shouldn't try to forecast too far into the future because the winds of demand can shift quickly. Ever been asked where you see yourself in 10 years? While some may have an idea where they want to be, there's a good chance the end result will differ. Life is simply too uncertain to accurately predict that far ahead. Capital markets act similarly; we cannot possibly know where stocks will be 5 to 10 years from now. Anyone that tells you otherwise is telling you more about their overconfidence than their forecasting prowess.
Staying focused on the short term also means you should avoid putting too much weight in the big, secular trends so often cited as positives for emerging markets. As in, "China and India have an absolute mass of people bound to inextricably alter the face of such and such industry forever." Undoubtedly, you've heard this line of reasoning before, and for good reason—it makes intuitive sense and there is much truth to it. But it's a big, slow-moving thing and isn't likely to drive markets in a given year. Instead, you should focus on the incremental changes within the larger trend. You'll have more success at identifying the winners over a shorter period.
Successfully identifying drivers is also rarely achieved by following the herd—you need to see things others don't. Capital markets are highly effective discounters of all widely known information. Therefore, to add value, investors must identify information not widely known or interpret widely known information differently from other market participants. We aren't advocating betting the reverse of the consensus—what most people consider contrarianism. A contrarian is correct in thinking what everyone assumes will happen rarely does, but wrongly assumes the exact opposite will happen. If the consensus expects the markets to rise 10 percent next year, contrarians bet it will fall. But markets could just as easily be flat or up 20 percent or more. Surprises are what move markets, not the consensus. That's where you should mine for your portfolio drivers: Understand what is widely expected and decide how reality will under- or overshoot that expectation.
Last, if you expect what follows to provide a checklist for your next portfolio rebalance, you'll be sorely disappointed. Markets are constantly changing, meaning the evaluation of drivers and market conditions requires a dynamic approach. Success won't come from rote memorization of contributing factors and applying those indiscriminately going forward. Instead, you need a general framework—one flexible enough to account for a wide variety of market conditions and adjustable as appropriate.
Identifying portfolio drivers begins with an analysis of three broad categories of factors that influence relative performance the most: economics, politics, and sentiment. These factors work across all categories of stocks, but the drivers within them will vary considerably depending on both place and time. Some are explicitly related to country decisions; others pertain more to sectors. But most are broad enough to have an impact on both, and investors should analyze each one with this in mind. Here, we detail many important factors across the three main categories of drivers, with key questions to ask as you go about the process.
Economic drivers are things related to the macroeconomic environment. This could include monetary policy, interest rates, lending activity, yield curve analysis, relative GDP growth analysis, and myriad others. What economic forces are likely to drive GDP growth throughout countries in the world? What is the outlook for interest rates and how would that impact sectors? What is the outlook for technology and infrastructure spending among countries?
Economic drivers pertain not only to the fundamental outlook of the economy (GDP growth, interest rates, inflation), but also to the stock market (valuations, M&A activity, share buybacks). As an investor, it's your job to identify these drivers and determine how they'll impact your overall portfolio and each of its segments.
Important economic drivers include:
Relative GDP growth: Investors often wrongly assume strong absolute economic growth translates into stock market outperformance. Economic growth is a valid driver; it's just relative growth that matters. Ask yourself how fast a country is growing relative to its peers. How does it compare to recent history? Is growth accelerating or slowing? Does growth compare favorably to other countries with a similar economic structure (e.g., how does growth compare across countries reliant on exports)? How are the underlying sectors of the economy performing? Is domestic demand leading growth? Exports? Investment spending? Is the trend sustainable?
Monetary policy: Monetary policy affects the economic environment through a number of channels—interest rates, liquidity, and inflationary expectations, to name a few. Some key questions to ask: Is the central bank raising or lowering interest rates? Do the various measures of money supply (M0, M1, M2, etc.) suggest the environment is tight or loose? Are banks lending and multiplying the money throughout the economy? Are reserve requirements changing?
Inflation: High and wildly gyrating rates of inflation are generally bad for economic activity (see Chapter 3). Is inflation, as measured by the consumer price index (CPI), high or low? Trending downward or rising? Relatively stable or erratic? Are "core" measures of inflation—which exclude volatile energy and food prices—showing a different trend? What do other market indicators, such as inflation-protected securities or bond yields, say about inflation expectations? Are price changes different across industries? If so, which industries does this help or hurt?
Relative interest rates: Domestically, interest rates primarily impact lending. Are interest rates low enough to encourage borrowing? How do they compare relative to historical standards? Is the central bank raising or lowering short-term rates? More broadly, interest rates also reflect the relative attractiveness of capital to foreigners, with higher rates increasing the likelihood of investor interest.
Yield curve: Related to interest rates, the yield curve reflects the degree of banking profitability. Banks take deposits at short-term rates and lend at long-term rates. This spread is called the net interest margin (NIM). When it's positive—long rates above short rates, or an upward-sloping yield curve—banks are incentivized to lend, a good thing for overall economic and investment activity.
Currency strength: Emerging market currencies are volatile and prone to big swings, making currency strength a powerful driver. Ask yourself if the currency prone to speculation. Has it been devalued in the past? How are political and social events affecting sentiment? What's driving most recent performance? Interest rate or growth differentials? Capital flows? Inflation expectations? Currency strength also has different impacts on different industries. For example, a weak currency helps exporters by making their goods cheaper in foreign markets.
Debt levels: As evidenced by its turbulent history, debt levels can vary dramatically in emerging markets, often to negative effect. Remember, debt levels are relative—some debt is often a good thing—and distinguish between private and public debt. Do households and business have access to credit? Is the debt service burden acceptable (i.e., are interest rates reasonable or punitive)? What currency is the debt denominated in? Is debt finding its way into productive hands?
M&A, issuance, and repurchase activity: These actions fundamentally shape the supply of securities. M&A and repurchase activity generally reduce supply by lowering the total shares outstanding. Thus, increased M&A and repurchase activity is good for markets. Equity issuance, however, is the exact opposite since it increases the available supply. Are there any granular trends within sectors (e.g., are utilities companies consolidating)? New issuance can also be positive for more underdeveloped markets since it increases market depth.
Infrastructure spending: Infrastructure refers to basic physical systems like communication, transportation, or electricity networks. Spending on new infrastructure increases efficiency and productivity and can be broadly stimulative to the economy. How much of a government's budget is going to new infrastructure? In what segment of the economy is that money being spent? Is private spending occurring (often at the company level)? Do any particular sectors stand to benefit, either as the recipient of such spending or the actual construction?
Political drivers can be country-specific, pertain to regions (Asia, Latin America), or affect interaction between countries or regions (such as trade policies). These drivers are more concerned with categories such as taxation, government stability, fiscal policy, and political turnover. Which countries are experiencing a change in government that could have a meaningful impact on their economies? Which sectors could be at risk from new taxation or legislation? Which countries are undergoing pro-growth reforms?
Political drivers will help determine the relative attractiveness of market segments and countries. Be warned, however: Most investors suffer from "home country bias," where they ascribe too much emphasis on the politics of their own country. Always keep in mind it's a big, interconnected world, and geopolitical developments everywhere can have implications.
Political drivers also tend to be exaggerated in emerging markets. Big changes often occur rapidly; even entire governments can be overthrown in days. Thailand, for example, has witnessed 10 coup d'états since 1971.[170] Given the potential for surprise, politics is an especially powerful driver in emerging markets. Some of the most important aspects:
Government stability: In the developed world, we often take government stability for granted, but it's often a major concern in emerging markets. Fractured party systems can be destabilized by myriad competing interests, and shaky coalitions may perpetuate weak governance and slow progress on reform. Other countries have the exact opposite problem, either as a de facto one-party state (e.g., South Africa) or an authoritarian regime (e.g., China) that won't easily budge.
Taxation: Are tax rates low enough to incentivize economic growth? Do any industries receive special tax breaks? How do the overall levels of taxation compare to other countries? Is compliance simple or complicated? Are tax receipts stronger or weaker than expected (a sign of economic activity)? What are the tax rates by industry? Do any receive tax breaks? Face tariffs in other countries?
Trade/Capital barriers: Barriers like a closed capital account or trade restrictions are impediments to the free flow of capital and bad for markets. Does the country have an open or closed capital account? Has it entered into any free trade agreements? How are relationships with its neighbors? Do tariffs or subsidies distort the competitive attributes of any industries?
Fiscal policy: Analyze the government's broader fiscal policy. What segment of society is it catered to? Business? A particular economic sector? The poor? Does it promote redistributive measures (a negative)? Is the government spending wisely? Who are the potential winners and losers of any spending programs? How is spending being financed? With growth? Higher taxes? External debt?
Political turnover: Generally, capital markets fear the uncertainty created by political change and abhor politicians artificially determining winners and losers. Know when a country has federal, state, or local elections scheduled and the ideological beliefs of the primary political parties. Analyze their platforms leading up to the election. Will they maintain the status quo? Are they generally good for business? Do any sectors stand to benefit or suffer from the change? Do they promote structural reform?
Property rights: Property rights are fundamental to well-functioning capital markets. Can citizens freely buy and sell property and expect to retain it without worry of seizure? How ingrained are legal and judicial institutions? Is there a distinct separation of powers? Checks and balances? If property rights exist, how well are they enforced? Do any sectors receive special treatment from the government?
Protectionism: Protectionism refers broadly to government actions restricting the free flow of trade. This includes tariffs, taxes, quotas, or other restrictive actions. Such policies are often used to protect a vulnerable domestic industry from foreign competition. And since emerging markets represent a threat as low-cost producers, protectionist measures are often enacted with them in mind. Since protectionism artificially distorts natural market mechanizations, it is viewed negatively by investors.
Corruption: Corruption is commonplace in emerging markets, but its impact as a driver is less straightforward. The actual act invariably creates inefficiencies as consumers and businesses go about their day-to-day affairs. But it is tough to measure, so focus on the broader picture. Does corruption threaten progress on reform? Endanger government stability? Decrease the transparency of particular industries?
Privatization: The state often plays a large role in emerging market countries. As a more efficient allocator of capital, private enterprise is generally preferred to government control. To what extent is the government selling state assets to the private sector? What sectors are affected? After privatization, does the state maintain any involvement? Are privatized industries truly free and unrestricted?
Structural reform: Structural reform refers broadly to change in a country's economic or political framework that increases efficiency or allows capital markets to operate more freely. This may include simplifying the tax code to reduce the cost of compliance or change in financial regulation to allow banks to more freely lend. What reform, if any, is the existing government promoting? Have they successfully made progress? Are there any political impediments, such as a lack of support from the legislature?
Social stability: Social stability is often weaker in emerging markets due to starker demographic diversity. Income, race, and religion, for example, can all substantially influence markets. Are there competing racial or religious groups within a country? What is the general level of income inequality across demographic groups? Are any of these differences institutionalized, like South Africa's Black Economic Empowerment (BEE) (see Chapter 4)?
General levels of freedom: The level of economic, political, and social freedom in emerging markets also has a bearing on performance. The Heritage Foundation publishes the Index of Economic Freedom, which scores the freedom levels of 183 countries around the world across various factors (
www.heritage.org/Index/Default.aspx). The higher a country ranks on the scale, the "freer" it is. All else being equal, a freer country is a good thing for investors. The 2009 rankings illustrate the clear distinction between emerging and developed markets: The UK ranks 10th, while Russia ranks 146th. This is an imperfect measurement, but telling nonetheless.
Sentiment drivers attempt to measure consensus thinking about investment categories. In the quest to know something others don't or interpret widely held information differently, sentiment drivers are vital inputs—they reflect expectations and what the market is discounting. Surprises move markets, so use these drivers to help you find areas where sentiment is different than reality. For example, let's say you observe most investors currently expect a recession in the next year. But you disagree and believe GDP growth will be strong. This presents an excellent opportunity for excess returns. You can load up on stocks that will benefit from an economic boom and watch your portfolio rise as the rest of the market realizes it later and prices in the result.
Since the market is a discounter of all known information, it's important to try and identify what the market is pricing in. Looking forward, which sectors are investors most bullish about and why? What countries or sectors are widely discussed in the media? What market segments have been bid up recently based on something other than fundamentals? If the market's perception is different than fundamentals in the short term, stocks will eventually correct themselves to reflect reality in the long term. Key sentiment drivers include:
Mutual fund/portfolio flows: Mutual fund and portfolio flows capture investor demand for the securities of a particular country or asset class. Is money flowing into or out of a country or sector? How much and how fast? Investors are fickle, so these flows can be transient and short term. And, too often, this money flows toward the flavor of the month, so be wary of chasing heat.
Foreign investment: Beyond mutual fund and portfolio flows, there is another measure of investment demand: foreign direct investment (FDI). FDI consists of more tangible investments than portfolio flows, such as a new factory or bridge. Because they often represent longer-term investments, these flows are scrutinized by investors. Keep an eye out for countries (or sectors) both giving and receiving this type of investment.
Media coverage: Media coverage is a powerful qualitative measure of sentiment. What is the tone of the media coverage for a country? Are journalists writing favorably about its economic, political, or social environment? Or is negative news pervasive? Do "local" opinion sources differ from "foreign" sources?
Risk aversion: General levels of risk aversion can drive performance of a particular country or sector. For example, if risk aversion increases, investors may sell out of smaller, riskier countries (like Thailand or Argentina) or sectors sensitive to the business cycle (like Industrials).
Consumer confidence: The most widely quoted measure of investor sentiment. It has some relevance as a coincidental indicator, meaning it tells you how people feel right now. But because it isn't telling you anything about what people will feel going forward, the power of these figures is often overstated. Collection methods can also be spotty so be sure to evaluate how the data are calculated before putting too much stock in what they say.
Professional investor forecasts: Taken together, professional forecasters represent a good proxy for consensus expectations. If every major forecaster is bullish on a country, seriously analyze whether expectations have gone too far. Do the economic and political drivers warrant such optimism? Is another country with positive drivers ignored because of the myopic focus on one country?
Momentum cycle analysis: Stock market momentum refers to the rate of acceleration of a category of stocks or security's price. Is a country or sector continuously moving downward? This may suggest investors have become overly pessimistic. The opposite is also true.
Once you've completed a thorough analysis of potential economic, political, and sentiment drivers, you need to translate what you've found into portfolio allocation decisions.
Remember that capital markets are highly effective discounters of all widely known information. Therefore, you're looking for drivers not widely appreciated or those misinterpreted by the market. Are any of your drivers showing "extreme" readings? Are there any outliers? These are the areas that should generally drive your major allocation decisions. For example, maybe your analysis reveals that structural reform in South Korea has given the shipbuilding industry easier access to cheaper imported steel. Shipbuilders rallied considerably after the announcement, but steelmakers have barely budged—this may be a category of stocks worth further analysis.
Your degree of confidence in the underlying drivers will determine the weighting difference relative to the benchmark. No investment is without risk, and recognition of risk is just as important as identifying potential positives. Ideally, you're looking for a few high- conviction areas to place your largest over- and underweights. Areas you have less confidence in can be neutral weights or minor over- and underweights.
Sometimes, allocation decisions are predicated on exclusionary management. That is, maybe you can only confidently determine areas to underweight. In this case, you might overweight the remaining categories because they should have a higher expected return. To better give you a feel for how an evaluation of portfolio drivers works in practice, here's an example featuring Brazil.
At the end of 2002, Brazil hardly looked like a contender for country leadership. Economic growth seemed pedestrian compared to the blistering figures reported in other emerging markets like China and India, with GDP rising a mere 1.3 percent in 2001.[171] Confidence remained shaken following another currency devaluation in 1999—the fifth in less than 10 years. And a noted populist threatened to end a growing trend of positive political reform. The country's weak relative market performance reflected the pervading uncertainty—Brazil fell an annualized 20 percent from 2000 through 2002, compared to a decline of 14 percent for the MSCI Emerging Markets Index.[172]
In 2003, global equities entered a five-year bull market that saw the MSCI World Index return an average annualized 18 percent. Emerging markets performed even better, rising 37 percent a year over the same period. But Brazil blew away nearly every other country in the world, posting a 65 percent annualized return. What drove such a dramatic reversal? In this section, we evaluate the political, economic, and sentiment drivers behind Brazil's stunning outperformance.
In 2002, Brazil prepared for a new president—the second term of President Fernando Cardoso's administration was coming to an end. Elections are one of the most important political drivers, as they represent the greatest probability of change. As such, investors tend to view them cautiously, and this one was no different.
The outgoing president, Fernando Cardoso, was a firm proponent of fiscal responsibility. As finance minister, he helped lead the country out from hyperinflation with his "Real Plan" in 1994.[173] In his second term, Cardoso passed several landmark laws, including the Fiscal Responsibility Law in 2000, which imposed greater controls on government spending. Given Brazil's historical lack of fiscal discipline, this was a welcome change.
Cardoso also introduced additional sound reform. Presidential Decree 3088, issued in January 1999, established inflation targeting as the official monetary regime for the Brazilian central bank. Brazil's long history of hyperinflation wreaked havoc on economic and financial stability; the sheer scale of price changes and its violently unpredictable nature continuously frightened away investors. While the Real Plan successfully brought inflation down from the heady levels of previous administrations, Cardoso's decision to institute inflation targeting helped keep it under control. These reforms represented positive political drivers—much rested on their continuation in the next administration.
But Cardoso's successor potentially threatened this progress. A former metalworker and union leader, Luiz Inacio Lula da Silva (known commonly as Lula) gained popularity by leading strikes against the Brazilian military dictatorships of the 1970s and 1980s. He also helped found the Worker's Party, the dominant left-wing party of Brazilian politics.
Given his background and Brazil's history of populist-leaning leaders, Lula frightened investors. He had a history of fiery anti-capitalist rhetoric, promoting such causes as intentional debt default and the renationalization of state-owned enterprises. At best, investors feared he would ditch the market-friendly policies introduced under Cardoso's regime. At worst, he represented a return to the country's populist ways. Investors held their collective breaths and the uncertainty weighed on markets—Brazilian stocks sold off in the run-up to elections. This was a political driver at work.
Investors were also suspicious of the economy. Crises in Argentina and Uruguay erupted into fears of contagion across the region. Even though Brazil was financially separated from these trouble spots, it was still viewed by investors as Latin American. Contagion represents both a sentiment and an economic driver. It is based mostly on fear (sentiment) but is also in response to the visible deterioration of some corner of the market (economic). In either case, traders thrashed the Brazilian real to historic lows, interest rates and inflation spiked, and major credit rating agencies began questioning the country's ability to service its $250 billion in debt.[174] Taking stock at the end of 2002, uncertainty remained high. Investors were unsure what elections might bring, and the economic outlook appeared murky.
Lula took office in 2003 and quickly assuaged investors' fears. Upon assuming office, the 35th president of Brazil hardly resembled the leader suggested by his past. He toned down his populist rhetoric and adopted many of Cardoso's key policies on fiscal responsibility and inflation targeting.
The fear of change soon morphed into optimism of further change. Lula didn't just keep the market-friendly policies of his predecessor, he built on them. For example, the pension system was bloated from the populist handouts of previous administrations—pensions cost the government nearly $20 billion, or 4 percent of GDP at the time.[175] One of Lula's first actions as president involved reforming this system. He passed laws limiting the size of public-sector pensions and made them taxable. These moves were very unpopular; Brazil's politicians had long cemented their hold on power through the support of the masses. But markets welcomed the structural reform. They represented a break from Brazil's damaging populist past.
But the administration wasn't done yet. Brazilian consumers and businesses had long starved for credit. Not only were interest rates prohibitively high, but structural inefficiencies deterred banks from lending more. For example, Brazilian reserve-to-deposit requirements were among the highest in the world. This manifested itself in a generally low level of credit across the economy, even by emerging market standards. Credit availability is a crucial variable to the efficient functioning of markets, a key economic driver.
Lula focused on structural reforms to increase the overall availability of credit. A series of measures, such as changes to bankruptcy law and the framework for securitization, coaxed banks to take more risk and increase lending. With interest rates and inflation already heading downward, banks were now more apt to extend loans after reform. And lend they did. Bank lending rose from 25 percent of GDP in 2003 to just over 40 percent in 2008. This had clear positive economic ramifications: During this period, capital goods production consistently grew over 20 percent year-over-year, and retail sales, which were declining in 2003, began to grow at double-digit rates.[176] In this case, positive political drivers (structural reform) helped shape economic drivers (increased lending).
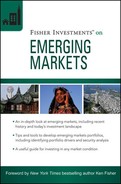
Continued reform boosted investor confidence and led to other enticing economic drivers. Inflation, long the country's nemesis, remained steady and predictable, encouraging investment, consumption, and ultimately higher economic growth (see Figure 6.1). Capital goods production consistently grew over 20 percent year-over-year, and retail sales, which were declining in 2003, began to grow at double-digit rates. Not surprisingly, Brazilian Financials performed extremely well due to the windfall of credit reform, returning 69 percent annualized from 2003 to 2007.[177]
In addition to positive domestic drivers, there were larger, more powerful trends brewing outside Brazil's borders. In the developed world, we often take for granted the electricity lighting our homes, the roads facilitating easy transport, or the clean water systems providing one of our most basic human needs. But this infrastructure is generally inferior or non-existent in emerging markets. Rapid economic growth and industrialization in recent years only exacerbated the strain on existing resources.
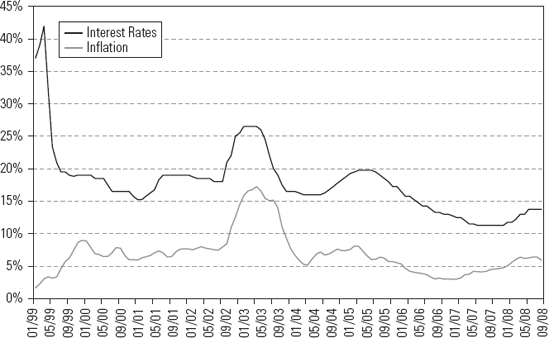
Figure 6.1. Brazil Inflation and Interest Rates Since Inflation TargetingSource: Thomson Datastream.
In response, governments deployed enormous amounts of capital to upgrade the emerging world at the turn of the twenty-first century. At the same time, cracks began to form in the developed world, much of which was industrialized 100 years ago. Its infrastructure began to deteriorate and, in some cases, fail completely. The developed world needed a refresh. Together, these trends unleashed an investment boom seen only a few times in history (an economic driver). And because of its resource-heavy market composition, Brazil was one of its biggest beneficiaries.
Infrastructure requires two key inputs—raw materials and energy. You can't build a skyscraper without steel beams or a road without concrete, and the surge in infrastructure spending dramatically increased demand for basic materials. From 1980 to 2000, global crude steel production, a metal required for manufacturing and construction, grew 18 percent. In the seven years from 2000 to 2006, however, production increased 58 percent.[178] Increased demand for steel in turn led to demand for iron ore, its main ingredient (see Figure 6.2). In addition, the wave of industrialization dramatically increased demand for oil and its derivatives, pushing up oil prices more than five-fold.[179]
This was a powerful economic driver for Brazil, as the country was the world's second-largest producer of iron ore and also home to a large energy sector.[180] Together, the Energy and Materials sectors account for nearly 50 percent of the country's weight. Both clearly benefited from the global thirst for commodities, returning an annualized 73 percent and 82 percent from 2003 to 2007, respectively (see Table 6.3).
The commodities boom presents a few key takeaways. First, investors cannot ignore the structural composition of each country's market. One of the first steps to evaluating a country should be an understanding of its sector composition. Here, recognition of the larger infrastructure theme would have likely led you to Brazilian Materials and Energy regardless of your view on the country. Second, don't forget to think globally. In today's globalized world, not every reason for a country's relative market performance lays within its borders. A broader global trend can be just as impactful to a country if it provides a key input or is in some way connected.
Table 6.3. MSCI Brazil as of December 31, 2007
Weight | 2003–2007 Annualized Return | |
|---|---|---|
Source: MSCI, Inc.,[181] Thomson Datastream. | ||
Materials | 25.0% | 73.1% |
Energy | 23.2% | 81.5% |
Financials | 14.5% | 69.2% |
Telecommunication Services | 14.1% | 33.3% |
Consumer Staples | 12.3% | 43.4% |
Utilities | 7.0% | 51.1% |
Industrials | 3.3% | 34.4% |
Consumer Discretionary | 0.5% | 34.2% |
Health Care | 0.0% | N/A |
Information Technology | 0.0% | N/A |
No evaluation of portfolio drivers is complete without an in-depth analysis of risk. An underappreciated negative can sometimes outweigh an otherwise rosy outlook. Investors should therefore spend just as much time evaluating what could go wrong as what may go right.
And despite the ongoing positive developments, risks remained. Economically, Brazil as a country remained sensitive to market turbulence due to its reliance on foreign capital. Red tape still entangled businesses, fostering inefficiencies. And although interest rates were substantially lower than historical levels, they remained high on an absolute basis.
Politically, a series of scandals plagued much of Lula's first term and threatened progress on reform. Corruption is commonplace in emerging markets due to weak institutions and often poorly developed legal and regulatory frameworks. Lula was also going against the weight of historical trends; it takes a strong politician to consistently challenge the status quo. At any given point in time, Brazil's fragmented political process threatened to undo the progress made.
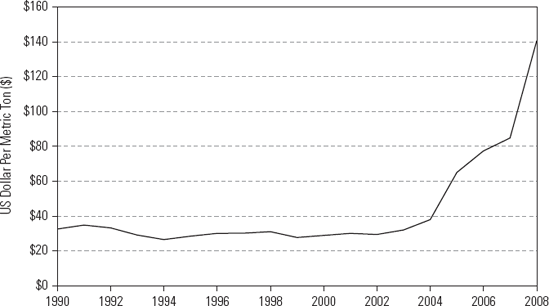
The evaluation of portfolio drivers doesn't occur in a vacuum. In this case, a similar analysis of other countries in the benchmark would need to be conducted before determining the appropriate allocation to Brazil. After you've gone through the relevant markets, stack up countries (or sectors) relative to each other. Clearly, there were a number of positive drivers in Brazil. But how did they stack up against other emerging markets? We like to think of this process like a scale, with the heavier category represented as an overweight. Put one country (or sector) on each side. Which side would weigh more? By how much?
Figure 6.3 illustrates a very simple example of this idea, comparing Brazil to South Africa in the early 2000s. Like Brazil, South Africa also benefited from increased commodities demand because of its vast mineral resources. But while interest rates and inflation were falling in Brazil, they were rising in South Africa. And the political environment in South Africa was fraught with risk. Therefore, an overweight to Brazil relative to South Africa was justified. Utilizing this approach with each segment will help guide you in determining what areas of the market to over- and underweight.
Despite consisting of 24 different countries, each driven by a unique confluence of factors, broader asset class considerations can sometimes take precedence depending on market conditions. While the framework introduced earlier in the chapter is applicable here as well, there are several important factors worth further discussion. In this section, we discuss the factors that may drive emerging markets as a category to perform differently than developed markets.
Emerging markets tend to have higher economic growth rates than developed markets. This is part of their allure to investors. But does stronger economic growth translate into stock outperformance?
The evidence suggests so—at least through its relatively short history. Using the 24 official countries in emerging markets today, the average annual GDP growth for the category since 1988 is 4.3 percent. The same number for developed markets is 2.8 percent.[182] Stock market performance over the same period is also in emerging markets' favor, with the MSCI Emerging Market Index returning an annualized average 11.4 percent versus 6.2 percent for the MSCI World Index.[183]
Taken at face value, these data suggest holding a constant overweight to emerging markets. After all, they offer stronger economic growth and higher stock market returns. However, this is dangerous logic in the short term. No category of stocks outperforms at all times, and emerging markets stocks are often subject to large swings in performance. In any given year, such a belief can lead to disappointing and unexpected negative returns. For example, the MSCI Emerging Markets Index fell an average annualized 9 percent from 1994 through 1998, while the MSCI World Index rose 16.2 percent a year over the same period.[184]
In addition, much of emerging markets' outperformance in the past two decades represents their arrival on the world stage. Growth was disproportionate in this beginning stage and, as it invariably slows, emerging markets may begin to perform more like their developed market peers over time. In the very long term, most equity indexes finish with roughly the same return.
Upon closer inspection, the connection between economic growth and stock market performance appears less straightforward. At the country level, for instance, there is little relationship between the two. In Chapter 2, we told the story of China's vicious 2001 to 2005 bear market, a time when the Chinese economy averaged double-digit growth. Investors indiscriminately following the country with the best economic growth would have seen their portfolio wilt. To be sure, the two are not mutually exclusive—a strong economy can certainly be one driver behind market outperformance. But solely using economic growth as a guide for portfolio allocation may just as often lead to trouble.
A better approach is to take a step back and consider emerging markets' role in the global economy. Economic development happens in several stages. Most societies are agrarian to start, largely for means of self-sustenance. Eventually, productivity increases enough for a society to specialize and trade for goods it has neither the skills nor the resources to produce. Over time, the country moves up the value-chain, developing a manufacturing base to produce more sophisticated goods.
This happened in the developed world at various stages throughout the eighteenth and nineteenth centuries—think of the US' humble progression from Pilgrim farmers to railroad magnates. The continuous fight for progress rarely slows, and many societies move further toward high-margin and knowledge-based services, such as banking or engineering.
Emerging markets are predominantly in the early stages of this development cycle. While many still cling to their agricultural past, most have recently industrialized, replacing the developed world as the source for lower-end manufacturing. This means emerging markets represent the beginning phases of the global economic production cycle and tend to be more sensitive to expectations of world economic growth.
The lesson for investors: Emerging markets tend to perform well when expectations of global economic growth are strong and underperform during downturns. So your expectations for emerging markets as a category should invariably include some evaluation of global growth expectations.
How does an investor possibly begin to evaluate something so broad? First, consider (though not necessarily heed) the consensus. Various organizations, such as the IMF and big brokerage houses, publish growth expectations. Get a feel for what they're saying and why. Ask yourself if you agree and why, and then brainstorm alternative scenarios. What do you think would surprise markets or cause an economy to deviate from the consensus? Feel free to be as creative as you like. Think aliens might invade Russia? Go ahead and jot it down.
Once you've thoroughly exhausted every conceivable option, go back and assign a probability to each of your scenarios. Don't feel pressured to be overly precise. Remember, investing isn't a certainties business—you're simply trying to objectively evaluate a range of possibilities. Do this often enough, and you'll notice your conclusions differ in some ways from the consensus. Even if it's a subtle difference, it can have important allocation implications. Imagine the consensus believes the global economy will grow like gangbusters, but you see it growing positively at an average pace. In this case, maybe you underweight emerging markets slightly because you believe there is a greater probability of downside surprise.
Beyond economic growth, the overall risk environment is another important driver for the emerging markets. Investors perceive emerging markets to be risky investments. This is warranted—returns are volatile and the political, economic, and social environments are often chaotic. Because of this added risk perception, emerging markets tend to perform in line with the overall risk environment—when investors are fearful, emerging markets underperform; when optimistic, they outperform. In other words, emerging markets act like high beta plays on global equities.
To see this at work, consider a recent example: The global bear market beginning November 2007. A full explanation of the events surrounding this period is beyond the scope of this book, but, broadly, the crisis began in the developed markets and emerging markets played little to no part. Unfortunately, that doesn't mean they were left unscathed—investors pummeled the category in tandem with developed markets from the start. This was an interesting phenomenon at the time, defying emerging markets' historic role as riskier, higher-beta plays on global equities (one would expect emerging markets to decline more). But strong fundamentals justified their relative resiliency: Economic growth remained robust, government officials built up war chests of foreign currency reserves in the preceding years, and monetary and fiscal policy was increasingly stimulative.
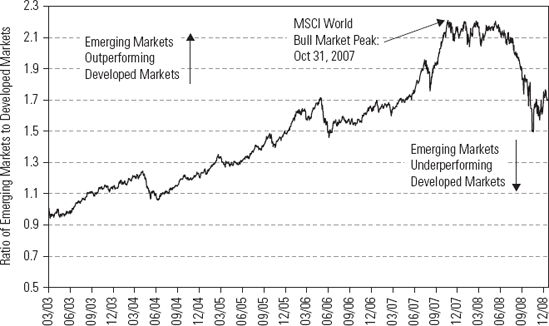
Yet, as economic data from developed markets continued to darken, investors' overall perception of risk continued to follow suit. Even though fundamentals for many emerging market countries and securities remained solid, the overall risk environment deteriorated, and the category paid the price simply for what they generally were: risky assets. Figure 6.4 shows the marked turn in emerging markets' relative performance to developed markets at the beginning of 2008. Note how emerging markets traded sideways relative to developed markets at the start of the bear market (i.e., both categories were declining at roughly the same rate). By May 2008, emerging markets began to underperform considerably.
A related concept introduced in earlier chapters is worth reiterating. Contagion describes the transmission of a crisis across many countries, including those with no apparent fundamental link to its cause. Emerging markets are especially vulnerable to this behavior. As such, negative events in only a small handful of countries can weigh on the entire asset class.
Table 6.4. Emerging and Developed Market Sector Weights
Emerging Markets | Developed Markets | Difference | |
|---|---|---|---|
Source: Thomson Datastream, MSCI Inc.[185] as of 12/31/2008. | |||
Telecommunication Services | 13.6% | 5.3% | 8.4% |
Materials | 12.8% | 5.8% | 6.9% |
Financials | 22.8% | 18.6% | 4.2% |
Energy | 14.9% | 11.6% | 3.2% |
Information Technology | 10.8% | 10.2% | 0.6% |
Utilities | 4.0% | 5.7% | −1.7% |
Industrials | 7.7% | 10.9% | −3.2% |
Consumer Discretionary | 4.8% | 8.9% | −4.1% |
Consumer Staples | 5.8% | 11.1% | −5.3% |
Health Care | 2.9% | 11.9% | −9.0% |
Structural differences also drive performance for the emerging markets category. Table 6.4 illustrates the differences in sector weights between the developed and emerging markets. Aside from Information Technology, they are notably different.
Clearly, if you expected Health Care to lead the market in the period ahead, you'd also expect emerging markets to underperform. Likewise, if you were particularly bullish on global Telecommunication Services, you would expect emerging markets to outperform. Emerging markets are also more associated with commodities, as they have over 10 percent more weight devoted to the Energy and Materials sectors. If you are interested in learning about the drivers behind individual sectors, see the Fisher Investments On series.
In its formative years in the late 1980s and early 1990s, emerging markets was an esoteric asset class. A small group of early adopters sought exposure to an untapped segment of the equity universe and the low correlations and diversification that came with it. This is less true today. Emerging markets are increasingly integrated into the global economy and beginning to converge with developed markets. A dedicated allocation to emerging markets has become increasingly necessary for proper international equity exposure.
While the diversification benefits of emerging markets have decreased, the increased demand has made the asset class more accessible to investors. The introduction of American Depositary Receipts (ADRs) gave the average US investor access to securities previously only available to institutional investors with contacts in local markets. More recently, the increasing availability of exchange-traded funds (ETFs) has given retail investors the ability to acquire exposure to the entire category with one security. Financial innovation will surely persist, and the further lowering of barriers to investment will continue to contribute to emerging market demand relative to other categories.
Often, a trend across several countries can drive performance for the broader category. In the early 2000s, for instance, emerging markets on balance enacted pro-growth reforms and reduced tax burdens. In 2002, South Korea offered tax breaks and other incentives to investors in an effort to attract capital—companies investing more than $50 million in the country received exemptions from corporate and income taxes for an extended period.[186] Many other countries introduced similar investor-friendly measures, and, taken together, this trend represented a driver for the category as a whole.
How do you get the information to conduct such an analysis? Investors often ask how they can possibly identify drivers without visiting a country, kicking the tires with management at a company's headquarters, or speaking the local language. The logic goes that the information disadvantage to doing none of these is so great that you're bound to miss something important, with your portfolio suffering as a result. Twenty years ago, there was some truth to this. But the world today is a vastly different place—most of the data you need to successfully invest in emerging markets rest right at your fingertips. You just need a computer and an Internet connection.
True, there are a limited number of hours in a day, and the average investor isn't working full time on his portfolio. However, the time you do have available—whatever amount that may be—should be spent on information gathering and analysis. That's how you generate actionable portfolio drivers. Warren Buffet was once asked how he got his investment ideas. His response: "I just read. I read all day."[187] We wholeheartedly agree.
Most economic data come from government sources and are often publicly available for free on the Internet. These websites offer information from interest rates to banking statistics to gross domestic product figures. Because not every organization produces the same set of figures across all countries, you may have to do a little bit of digging. For instance, Malaysia's inflation rate comes from the Department of Statistics Malaysia (www.statistics.gov.my/eng/), while Mexico's inflation rate is tracked by the country's central bank, Banco de Mexico (www.banxico.org.mx/sitioIngles/index.html).
If you don't know which government agency produces the data, look for a press release or newswire story on the subject. Most articles cite what source the data came from, as in "Mexico's consumer prices rose in February, according to the central bank," or something similar. Data can often be easily downloaded too, allowing you to track them over time or plot them out on a graph. And no need to fret language barriers—virtually every website these days offers an English-language version.
Data don't just come directly from the government. There are myriad third-party sources that either compile their own data or reinterpret figures from national sources. Two great resources, which are used extensively throughout this book, are the International Monetary Fund (IMF) and World Bank. The data may not be as timely as some of the figures offered by the government, but they can be invaluable when evaluating history or attempting to quickly glean high-level trends.
The IMF's World Economic Outlook Database (www.imf.org/external/data.htm), updated a few times a year, offers annual data on important figures, such as inflation, gross domestic product, and the current account balance. The World Bank complements these data with other statistics such as external debt and population growth (www.worldbank.org, see "Key Development Data & Statistics"). In addition to hard data, these sources also offer topical research papers and in-depth studies for those particularly inclined to get their hands dirty.
We'll touch on this a bit more in Chapter 7 when discussing security analysis, but a company's filings can also offer insight into a country's investment environment. Unfortunately, reporting standards are quite a bit more lax in emerging markets compared to the developed world. But many emerging market companies are increasingly becoming big, global players with secondary listings or ADRs on developed market exchanges, subjecting them to the higher regulatory and reporting standards of developed markets.
Staying on top of day-to-day news is critical to the proper monitoring and development of portfolio drivers. If you don't pay attention to what's going on in the world, you can't possibly know if your drivers remain valid and risk new drivers passing by unnoticed.
Luckily, remaining informed is easier than ever before—there are almost too many choices. We suggest spreading your time across several different news sources to get different points of view. For general financial developments, a major daily such as the Wall Street Journal or Financial Times is highly recommended. Longer-dated periodicals such as the Economist or BusinessWeek are also worth occasional perusal. A variety of other sources provide a mix of commentary and just-the-facts reporting, such as Bloomberg.com, Reuters, BBC (British Broadcasting Company), and the like. And most emerging countries have a major daily rag in English that can offer a unique perspective, such as South Africa's Mail & Guardian or China's China Daily. Read through as many different sites as you can until you get a feel for the ones that offer the best content for your purposes. And change it up! Too many investors become habituated to the same columnists and editors; your job as an investor is to ascertain the right information and what the consensus believes.
A common concern when investing in emerging markets is the credibility of published information. Because of weaker reporting standards and lower levels of ethical conduct, the data from emerging market nations often need to be taken with a liberal shaking of salt.
This highlights the value of diversifying your information sources. First, if the data are suspect, you're likely to read about it in the press. For example, it is widely understood that Argentine inflation figures are fudged by the government.[188] Second, third-party providers will often adjust their estimates for such inconsistencies.
Certainly, data credibility issues make it more difficult to objectively assess emerging markets. Unfortunately, there is no way to completely circumvent potential issues—it remains an inherent risk to investing in the category. But remaining diligent and inquisitive in your information gathering should help you stay ahead.
Chapter Recap

Identifying portfolio drivers begins with an analysis of three broad categories of factors: economics, politics, and sentiment.
These factors work across all categories of stocks, but the drivers within them will vary considerably depending on both place and time. (See the questions provided in this chapter to get a better understanding of what to look for in emerging markets.)
This framework can also be applied to emerging markets as a category, although several key factors play particularly important roles at this level (like economic growth and the overall risk environment).
Obtaining the required information to develop drivers is easier than ever. Investors can access a variety of websites—from government data sources to third-party newswires—with a simple Internet connection.
Data quality issues remain, but diligent investors can navigate with little trouble.