
After completing this chapter, you will be able to
Understand what Excel Services is, and what it is not.
Understand the history of Excel Services and what important scenarios the product addressed with each release.
Have a solid grasp of the high level areas of functionality Excel Services provides, from basic use all the way to extensibility.
Be familiar with the most common administration concerns, including basic configuration, security, and basic external data configuration.
Be able to apply advanced permission security to Excel files to allow tighter management and control.
Create a workbook connected to external data that utilizes Excel business intelligence (BI) features.
View and interact with a workbook in SharePoint by using Excel Services.
Understand the different approaches for extensibility of Excel Services.
Introducing Excel Services could be as simple as saying it’s a server product that enables the refresh, recalculation, interactivity, editing, and display of Excel files in a browser-based way. Although a fairly short and accurate description, it might be misunderstood on a number of fronts. Let’s clarify a little further exactly what Excel Services really is—and what its strengths are.
Over the years, we have found that it is sometimes worthwhile to explain what Excel Services is not, before helping people understand what it actually is.
Excel Services is not:
A “toy” server product that was quickly put together and released as some kind of an interim solution or response to a competitive threat.
Excel.exe packaged up and running on a server.
An add-in, like Office Web Components (OWC) or some other ActiveX control, installed on your computer and running in the browser.
A “thin” application, built on a webpage that converts Excel workbook files to HTML, that runs on your computer in a browser.
The preceding list contains some of the most common misconceptions about Excel Services. With those out of the way, we can get specific about what Excel Services is.
Excel Services is a full-fledged server product built and designed from the ground up to be scalable, manageable, performant, secure, robust, and extensible. It is tightly integrated into SharePoint and shares much of the functionality of SharePoint and of technology related to areas such as authentication, security, and manageability. Excel Services is a serious server product that is meant to be a long-term answer to a number of common problems with sharing and managing Excel workbook files.
Excel Services isn’t just Excel.exe—architecturally. It is very different because it is a service designed to support many users scaled across many machines. However, from a usage standpoint, it is different as well; it is meant to be “Excel” in the server and cloud world. That doesn’t mean simply duplicating all the Excel client functionality; it means that it extends the reach of Excel into the server and cloud. Excel Services is optimized around the kinds of Excel scenarios that are common in modern organizations, such as broadly sharing workbooks, parts of workbooks, and Excel-based BI insights across an organization in a way that can be tightly controlled, secured, and managed. Although there might be places where Excel Services functionality overlaps with Excel; Excel client and server are better together and naturally complement each other.
I won’t go deeply into architecture because that’s beyond the scope of this book, but it is worth taking the time to clarify that Excel Services is not like OWC. OWC ran as an add-in to the Internet Explorer browser and had to be installed on machines across an organization. This requirement carried with it all the security, upgrade, deployment, and manageability headaches that come with installing any client components broadly across many computers. Instead, Excel Services core components run on a server, either a single server or a group of servers. It is generally much easier to deploy and upgrade a few server machines than many client machines. People can use their browsers to view Excel workbooks and reports using Excel Services without having to install any client-side components. The browser rendering is completely thin, or “zero-footprint,” because it uses only DHTML and JavaScript—no install required. And by “no install,” we mean no install; it doesn’t even require an Excel client to be installed on the user’s machine.
Because the core Excel Services components are based on a server, the browser is rendering only the results of the Excel workbooks, refreshes, and calculations. The actual workbook file and all the intellectual property (formulas, and so on) are loaded on the back-end server, not in the client-side browser; so Excel Services isn’t simply converting the entire file to HTML and in the process exposing the entire file and its contents. The results are rendered in the user’s browser as HTML, but the Excel content underneath resides on the server. This makes it possible to do things such as show the results of formulas as HTML in the browser but keep the formulas themselves secure on the back-end server.
And make no mistake: Excel Services is loading native Excel workbook files. It isn’t converting them or saving them as something else. These are real Excel files that an Excel client can open and edit.
Excel Services is actually a set of service applications that run on top of SharePoint. This simply means that you can get to the Excel Services functionality described in this chapter from inside SharePoint, and that functionality is tightly integrated into SharePoint for permissions, authentication, management, and so forth.
Excel Services was first released as part of Microsoft Office SharePoint Server Enterprise Edition in 2007. The initial release of Excel Services was geared toward extending Excel-based BI solutions on the server and making managing Excel files easier.
The Excel client added a lot of BI functionality in 2007, such as OLAP formulas, structured tables, conditional formatting for creating elements such as data bars and Key Performance Indicators (KPIs), better PivotTable functionality, and more. A significant part of BI revolves around sharing insights gained with your team, department, or organization. Excel Services was the answer to widely sharing those Excel-based BI reports through SharePoint. This is the reason why Excel Services generally did a great job at rendering new Excel file types geared toward BI. In 2007, Excel Services couldn’t calculate or render many types of Excel files and objects, so the first release was clearly a subset of Excel functionality—and was really about exposing the BI features.
A Web Part, along with the ability to view parts of Excel workbook files in a Web Part (for example, showing a single chart), also shipped with SharePoint 2007. This made it possible to create dashboard experiences that integrated Excel content natively.
Sharing and managing Excel files was the other problem Excel Services tackled in 2007. Users could store their Excel files in SharePoint and assign permissions to them, so the files could be tightly managed and controlled.
When users needed to share Excel files more broadly, they no longer needed to copy and paste contents into email messages, send email attachments, or set up a terminal server where people could log on to view the files. They could simply send a link to the file in SharePoint, and people could view the Excel file by using Excel Services in a way that didn’t alter the contents of the Excel file. With sufficient permissions, viewers could open the file directly in Excel to perform more advanced analysis or editing, or by restricting permissions, viewers could be limited to the browser-based view.
This new capability meant that workbook authors didn’t have to worry about showing up at the Friday board meeting and have five other people show up with five different versions of the file—and five different versions of the numbers. The “one version of the truth” for the numbers could be contained in a single Excel file in a single place but could be viewed broadly by using Excel Services. Users didn’t even have to have the Excel client installed to view the workbooks. And because Excel Services is just another service in SharePoint, it could be managed in a single place.
There was also a simple extensibility story for the 2007 release. There were two parts to it—a web service and user-defined functions.
Excel Web Services is a simple SOAP-based web service that allows customized programs to open, recalculate, and interact with workbooks from any application. This capability enables developers to use Excel Services for offloading Excel calculations to more powerful servers. Custom solutions could load those files on the server, set parameters, recalculate them, and get the results back using Excel Web Services.
Excel Services also had the ability to leverage User Defined Functions
(UDFs). UDFs are simply custom managed-code solutions that can be installed
on the server and then called from a workbook file just like any function.
For example, you could write some custom C# code that returns all the items
from a specific SharePoint list. You could then use that custom routine from
a workbook on the server just like any other function. Instead of typing
=SUM(A1, B1), you could type something like
=MyCustomSharePointListFunction("http://URLtoMyList").
Excel Services had its capabilities expanded during the 2010 release wave of Office and SharePoint products.
In the previous release, there were a number of common features (for example query tables or comments) present in workbooks that were used as BI reports. The features may not have even been a core part of the report that authors wanted to share, but the presence of these features in the file prevented it from loading in Excel Services. Excel Services added support for more features that blocked files from loading in the previous release, making the server rendering option more relevant for a greater variety of workbook files. Excel Services also added support for the new BI functionalities that the Excel 2010 client introduced, such as sparklines, slicers, and PowerPivot support.
The 2010 release of Excel Services adds a powerful new capability: the ability to collaboratively edit Excel files by using only a browser, which enables users to edit Excel files inside the SharePoint environment. Collaborative editing capability was shipped as part of the Office Web Applications.
So far, we have been using the term “Excel Services” generically to mean “the server product on SharePoint that has all the Excel-like functionality.” But technically, there isn’t an actual Excel Services product. There is an Excel Service Application that shipped as part of Microsoft Office SharePoint Server 2010, and there is an Excel Web Application that shipped as part of the Office Web Applications, which must be installed on SharePoint. These two products originate from the same team at Microsoft and have considerable overlap.
If you install them both, you see only one service application inside of SharePoint. That service application is a combination of capabilities from both of the installed services. For now, we use “Excel Services” to mean the combination of both services, and we address important differences between the two later in the chapter as appropriate.
The 2010 release also revised the extensibility story, updating the existing SOAP-based web service to support the new editing functionality. The UDFs were still there and still supported, but the release also added a new object model: the ECMAScript object model.
This new object model (using JavaScript or JScript) gave developers the ability to build applications that ran in the browser, using a language familiar to most web developers. This new object model can do many of the things the web service does, but it also allows the developer to control basic properties of the workbook (such as whether the toolbar is visible in the user interface [UI]), as well as capture and respond to basic events. For example, you can easily write an application that enables a user to edit an Excel file in the browser and, based on what the user enters into certain cells or which cells are selected, trigger various processes (like SharePoint workflows) to kick off, have warnings shown, and so on. This is because the developer can hook into events such as the cell selection event or other events that can be useful for triggering key application behaviors.
Last, but certainly not least, the 2010 release added a REST-based API as well, which provides access to individual parts of the workbook, such as a specific chart, via a simple URL. The REST API makes it easy to embed Excel content in blogs, webpages, or even as refreshable images in applications such as Microsoft PowerPoint.
Excel Services was introduced to the world as a hostable service during the 2010 release. All of SharePoint can be hosted on-premise and exposed as a service, and Excel Services supports that. Appendix A talks about hosted cloud-based services, so I won’t discuss it in depth here. But Excel Services works as part of service-based SharePoint solutions.
Excel Services capabilities are also available on the Internet now, hosted by Microsoft. To try it, simply attach an Excel file to an email and send it to your Hotmail account or upload the file to your Windows Live SkyDrive account ( www.skydrive.com ), and then click the file to view or edit it. The fundamental technology being used there is Excel Services.
Generally speaking, you have many ways to build a solution with different BI products in the SharePoint ecosystem. This section is intended to give some guidance on when an Excel Services–based solution might be a better fit than some other products.
There was a question asked at the beginning of a presentation at a recent BI conference we attended:
Q: | What’s the number-one BI feature request across all BI applications, regardless of which company created those applications? |
A: | Export to Excel. |
This answer contains a strong element of truth—many, many, BI solutions end up in or go through Excel at some point. Excel is a tool that business users understand and use to express core business logic. Excel has a rich history and many existing solutions at virtually every major business in the world. Excel doesn’t require an “authoring” environment, developer tool, or developer environment—it’s just Excel. Getting Excel out of a company’s system is a tough challenge. “From my cold, dead hands” is an expression I have heard many companies’ IT developers quote from conversations with their users when they discussed removing Excel from the ecosystem. Excel is a tool that people know, often love, and in which they have invested a lot of learning and solution time.
Depending on the needs of the users and requirements of the system, the path of least resistance is often to build it around Excel.
Continuing on the theme from the preceding section, people already know how to use Excel and likely have solutions already based in Excel. Prototyping a new BI-based solution is often faster when it’s based on Excel Services than on some other tool. Why? Because it often means that most users don’t need to learn anything new.
They don’t need to learn a new suite of tools to “design a dashboard.” A dashboard in Excel is usually the first sheet that has grid lines turned off, with the most important charts, data, and pivot table showing the most important grouping of the results. So business users of the BI system being designed already know how to create the BI content without new training time and expense. This means that the overall BI solution designer can focus on putting together the server pieces of the solution and leave the business logic and visuals to the existing Excel users.
Note
Sometimes a more formal dashboard solution is required, or the application needs some functionality that Excel Services doesn’t support. Other chapters in this book, such as Chapter 7, provide alternative options in those cases.
Because Excel Services acts much like Excel, after seeing that Excel Services provides the ability to manage Excel files, people are more likely to try it out, which makes it a great steppingstone to getting richer BI controls and solutions in place. Getting Excel files working on the server is typically quick and straightforward (often no harder than simply saving them in SharePoint). This makes it a great choice when you are taking initial baby steps toward introducing a deeper BI solution later, or when you are looking for a quick prototyping or proof-of-concept BI solution. It is no secret that people are more comfortable with what they know—that’s one of the reasons PowerPivot uses Excel and Excel concepts as the front-end UI.
When users want to go beyond the capabilities of a workbook sheet, Excel Services provides a Web Part that supports more complex dashboards that can be deeply integrated into SharePoint. You can leverage this capability from within the SharePoint UI; no extra install or tool is needed.
One of Excel’s strengths is that it is a fantastic tool for doing quick analysis on the fly. You can easily add a new column to a table for a quick calculation, drill down on a pivot table to go deeper into the insight, or alter a slicer to change how the data is viewed. This kind of loose, ad-hoc data interactivity and exploration works equally well on Excel Services.
Other BI tools may not be as good at ad-hoc exploration. And if Excel Services doesn’t support the full level of ad-hoc functionality that the user desires, the user can always just click Open In Excel and take the file into Excel client to do more. This works because Excel Services loads native Excel files; no conversions are required, and there’s nothing special about those files—they can be opened on the client or server.
Because Excel Services is a true server product, it can be scaled out to many machines or scaled up to use more resources on a single machine to meet the demands of many users viewing and interacting with workbooks in the system. For example, if you have some Excel-based BI reports that many people need to share, Excel Services is a natural choice. This is especially true in cases where the people who need to view the data might not all have an Excel client installed.
This section discusses high-level security and configuration concerns. It is not meant to be an exhaustive list but focuses on the must-know concepts and most common “gotchas” that people have encountered when configuring the server.
You don’t need to do anything special or extra to install Excel Services; it is part of the SharePoint installation. When you install the Microsoft Office SharePoint Enterprise Edition, Excel Services is installed. Similarly, when you run the configuration wizard at the end of the SharePoint installation, Excel Services is configured automatically.
The primary thing to point out for installation is that if you want the ability to create new Excel files or to edit Excel files by using only a browser, you also need to install the Office Web Applications on top of SharePoint. The installation and configuration of the Office Web Applications generally looks and behaves the same as the core SharePoint install—so there isn’t anything new to learn from an install point of view. You should install and configure the Office Web Applications after installing and configuring the Microsoft Office SharePoint Enterprise Edition.
For the sake of simplicity and the purposes of this book, it is easiest to allow the post-setup configuration wizard to run to make sure your server and services are correctly configured.
You administer Excel Services just like any other service application in SharePoint—through an administration landing page where all the settings reside. Excel Services also supports PowerShell, and you can perform advanced administration through scripting. In a default configuration of Excel Services, the service should be secure, ready to use, and should support most workbooks without the administrator needing to do any further configuration.
To get to the administration landing page for Excel Services, on the Start menu, click Microsoft Office SharePoint Server | Central Administration. You’ll see the Central Administration Console, the page from which you can manage all of SharePoint.

On the Central Administration Console, under Application Management, click Manage service applications. You’ll see the Manage Service Applications page, as shown in the following illustration.
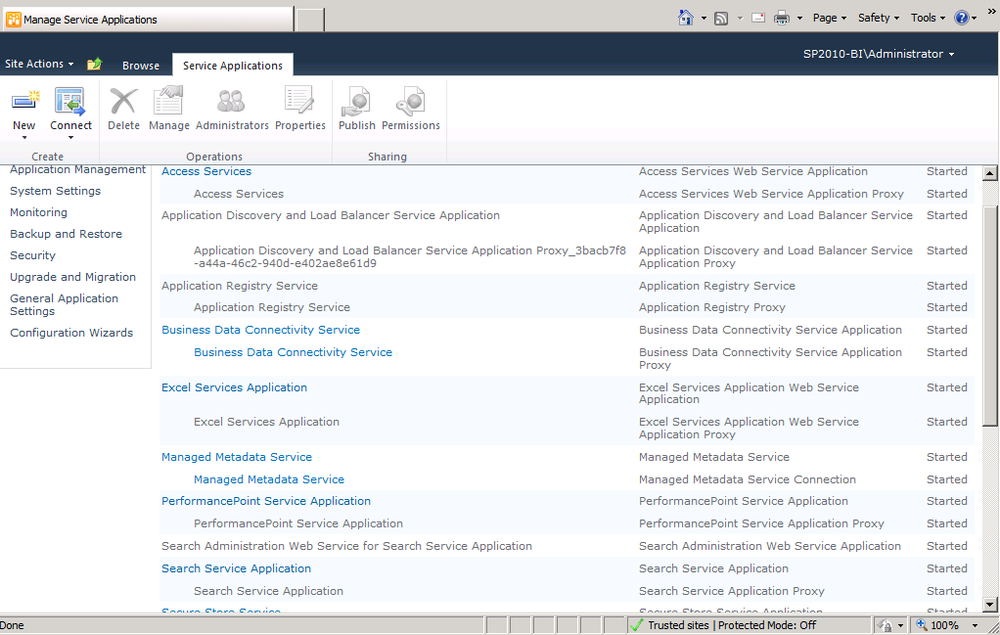
You can manage your service applications from the Manage Service Applications page. Each service application generally has both a service application and a service application proxy. The service application is the core engine that loads the files, handles security, manages sessions, and provides the core functionality. The proxy is a component that allows communication with the service application and allows for some advanced configuration options with respect to how the service application relates to the rest of the SharePoint farm. For more information and diagrams to help explain proxies, see http://technet.microsoft.com/en-us/library/cc263199.aspx . Of particular interest on that page are the topics “Services in SharePoint 2010 Products,” at http://go.microsoft.com/fwlink/?LinkID=167092 , and “Cross-farm Services in SharePoint 2010 Products,” at http://go.microsoft.com/fwlink/?LinkID=167095 .
With some service applications, you manage the proxy separately from the service application itself. Excel Services is not one of those. You can perform all Excel Services management from the service application landing page; you don’t need to manage the proxy separately.
Some service applications support running multiple instances of that service application in the farm or support running the proxy on one farm while hosting the service application on a different farm (also known as parent/child farms and inter-farm shared service applications), but Excel Services is designed to have only a single Excel Services application running in the farm. This is because Excel Services supports working with only the default Excel Services proxy of the default proxy group. You can have multiple groups defined per web application, but those scenarios are beyond the scope of this book. Sharing an Excel Services application across farms is also unsupported. For most enterprise deployments, a single Excel Services application running on the SharePoint farm is sufficient.
To get to the Excel Services administration landing page, on the Manage Excel Services Application shown in the following illustration, simply click the name of the Excel Service application you wish to manage.

From this page you can configure and manage the major pieces of Excel Services. Separate pages exist for each set of administrative task if you should need to change any settings to support a custom solution or adjust security settings to control resource usage or broaden capabilities.
Like any other files in SharePoint, Excel files are subject to SharePoint permissions and security. This remains true even after Excel Services is installed.
The most important server-security concept that Excel Services takes advantage of is the notion of trusted file locations. Trusted file locations are simply directories from which Excel Services permits Excel files to be loaded. If an Excel file is not stored in a location in the list of trusted locations, Excel Services does not load it. By default, in Excel Services 2010, the entire SharePoint farm is considered to be a trusted location. That means that Excel Services can load any Excel file from any SharePoint location.
When a workbook is loaded on Excel Services, the server forces that workbook to respect settings that are defined for the trusted location from which it was loaded. Trusted locations have many available settings, so the server administrator can control the allowable operations as well as how many server resources workbooks can use.
For example, you can specify that workbooks loaded from http://portal/teamsiteA cannot be larger than 1 MB and can never be allowed to refresh against any data sources, but workbooks loaded from http://portal/trustedTeamSiteB can load much larger workbooks, up to 20 MB, and can query data sources.
Note
If workbooks are failing to load or if certain operations fail for those workbooks, check whether the workbooks are being loaded from a trusted location directory and whether the settings for that trusted location enable the types of operations you want to perform on those workbooks.
To see the trusted location list, go to the Excel Services Central Administration page and click Trusted Locations.

Select the trusted location you want to view and click the link to that location. As shown in the following illustration, you’ll see a page that shows some of the settings and values that apply to the default trusted location.

One challenge for administrators is to get external data configured for use by Excel Services. Unfortunately, for deployments that aren’t single-box evaluator style deployments, (where all components are installed on the same machine with a default configuration usually as a trial deployment), some amount of configuration is required to make external data connectivity work.
This section doesn’t contain an exhaustive approach to all external data connectivity but does provide some simple guidance and links to detailed steps so that you can complete the high-level configuration needed to get going. Also, you can reuse much of the configuration work described here for other service applications, such as Visio Services, PerformancePoint Services, and even PowerPivot.
The simplest way to get data connectivity working on the server is to use a single account to connect to all the data sources or to save the credentials in the connection string. The downside of this is that there won’t be any per-user security applied to the data. The single account used to get data for Excel Services is known as the “Unattended Account.” Even if the credentials used to connect to the data source are in the connection string, for security purposes, Excel Services requires that you first have an Unattended Account configured. When the connection is made, Excel Services will use either the Unattended Account or the credentials stored in the connection string, depending on what is in the connection string.
The Unattended Account is simply a user account created for the purpose of read-only access to data sources. The account credentials (user name and password) must be stored in the Secure Store Service (SSS). (SSS is another service application, similar to Excel Services, that stores accounts securely.) The article at http://technet.microsoft.com/en-us/library/ff191191.aspx , “Configure Secure Store Service for Excel Services (SharePoint Server 2010),” contains instructions for configuring SSS and the Unattended Account for Excel Services.
Another option is to configure the Secure Store Service explicitly for credential retrieval. Basically, SSS stores credentials in a secure way that makes them available to service applications like Excel Services to use for things such as data refresh. An administrator must configure it and set permissions so the right user groups have access to the credentials. A workbook author must then know the key, or Application ID, to use in the workbook to ensure that the right set of credentials is requested when the user tries to refresh the data in the workbook. So it is better than the simple “one account for everyone to refresh data on the server” approach, does have more setup overhead, but usually isn’t quite as hard to configure as the option we discuss next. For more information about Secure Store Service, see http://technet.microsoft.com/en-us/library/ee806889.aspx .
If you want per-user security, the best option is to configure Kerberos in your environment. Kerberos configuration can be complex—and you might not need it if your users need simple read-only access via a single account. See “Configuring Kerberos Authentication for Microsoft SharePoint 2010 Products,” at http://www.microsoft.com/downloads/en/details.aspx?FamilyID=1a794fb5-77d0-475c-8738-ea04d3de1147&displaylang=en, for more information about Kerberos configuration.
In most deployments, the workbook author must explicitly mark which type of security option—Unattended Account (shown as “None” in the UI), SSS, or Kerberos (shown as Windows Authentication in the UI)—to use when Excel Services loads the file. If you are using a single-box deployment (and running your browser from that machine) or if you have configured Kerberos, the default settings are sufficient and you can skip this procedure.
Use the following procedure to get an existing workbook configured to use the Unattended Account.
Start the Excel client, and open the workbook for which you want to enable data refresh on the server.
On the Data tab, click Connections.
The Workbook Connections dialog box opens, as shown in the following illustration.
For each connection (only one is shown in the preceding image, but you can have more), select the connection and click Properties.
In the Connection Properties dialog box, click the Definition tab, as shown in the following illustration.
Click Authentication Settings to open the Excel Services Authentication Settings dialog box, shown in the following illustration, which enables you to specify how the data connection should authenticate (and thus how Excel Services can connect to the data sources when the workbook is loaded on the server).
In the Excel Services Authentication Settings dialog box, select the appropriate option based on how your server has been configured. The preceding screen shot shows the None option selected, which means the server will use the Unattended Account or will use any basic authentication credentials that might be stored in the connection string.
You can set these options when the data connection is created. (For example, the Authentication Settings button for Excel Services is displayed in the last screen of the data connection wizard.)
Also, after you configure a connection this way, that connection can be shared and reused, so not every user in your organization needs to set the configuration. The best way to do this is to store the .odc connection file in a SharePoint Data Connection Library and let your users know that they can select preconfigured connections from there.


For more information about external data connectivity and configuration, see the following resources:
A downloadable document showing more details on configuring Kerberos for Service Applications (like Excel Services) in SharePoint: http://www.microsoft.com/downloads/en/details.aspx?FamilyID=1a794fb5-77d0-475c-8738-ea04d3de1147&displaylang=en
A more basic webpage showing options for Configuring Kerberos in SharePoint 2010: http://technet.microsoft.com/en-us/library/ee806870.aspx
Details about how to configure the Secure Store Service: http://technet.microsoft.com/en-us/library/ee806866.aspx
Details about configuring Secure Store Service for Excel Services and the Unattended Account: http://technet.microsoft.com/en-us/library/ff191191.aspx
Because tight control over Excel files is a goal of many solutions, this section provides an overview of how to publish and secure server views of an Excel workbook.
Excel files can sometimes contain sensitive intellectual property (IP). For example, a workbook may use custom or proprietary formulas and logic to get a result. The result may often need to be shared, and the logic may need to be protected. This kind of overall solution is very difficult to achieve in Excel natively but can be done using Excel Services.
The secret to sharing the workbooks while protecting the IP is to apply the View Only permission for users who need to view the report but shouldn’t be allowed to see any of the logic underneath. View Only permissions means that only a sanctioned application can be used to open files of a certain type. In SharePoint, Excel Services is registered as the file handler for the supported types of Excel files (.xlsx, .xlsb, .xlsm, .odc). Therefore, when View Only permissions are applied, only Excel Services can be used to open the Excel files. This means that users can’t use the Excel client, can’t select Save Target As, cannot download the file, and cannot open those files in any other way. The view provided by Excel Services does not expose any of the IP in the workbook.
Note
SharePoint grants the highest level of rights possessed when deciding whether you have permissions to complete an action. This means that when you apply View Only permissions to a user who is a member of another group, such as Readers (the default), that user gets the highest level of permission granted. In this case, even though you specified View Only permissions, because members of the Readers group have higher-level rights, that user can download and view the Excel file in the client, exposing the IP. The lesson here is that when you apply View Only permissions to users, make sure they aren’t getting a higher level of access than intended because they are a member of some other group that can do more than just “view.”
You can apply View Only permissions either by making the user a member of the Viewers group or by granting the permissions to a specific user directly. The permissions can be configured at many different levels in SharePoint: sites, lists, document libraries, or individual documents. The following procedure shows how you can explicitly apply View Only permissions to a user from a site.
View the site in your browser, click the drop-down Site Actions arrow, and then click Site Settings.
On the Site Settings page, under Users and Permissions, click Site permissions.
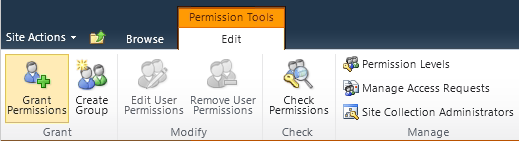
On the Permission Tools tab, click Grant Permissions. (You can also select an existing user or group, and then click Edit User Permissions.)
Clicking Grant Permissions opens the Grant Permissions dialog box.
In the Grant Permissions dialog box, enter the user or group for which you are setting permissions. Then expand the Add Users To A SharePoint Group (recommended) drop-down list, and select Viewers [View Only], as shown in the following illustration.
Click OK to save your changes.


Now, when the specified users view an Excel file that has been assigned permissions in this way, they can fully interact with that file in the browser by using Excel Services, but they cannot otherwise open, access, or edit the file itself.
View Only permissions are especially powerful when combined with the publish capabilities in Excel. The Excel client allows a user to choose which parts of the workbook are shown on the server. The entire file is always published, or saved, to the server because it is needed to enable full recalculation and refresh actions. But the workbook author can choose to display only certain parts of the file when it is rendered by the server. View Only restricted users have access only to these portions of the workbook in the UI and through the extensibility APIs, like the JSOM or Web Service.
The following procedure shows how to narrow down what is displayed in a workbook that is rendered on the server.
In the Excel client, click File, click Save & Send, and then click Save To SharePoint, as shown in the following illustration.
Click Publish Options (displayed at the top right section of the preceding illustration) to open the Publish Options dialog box.
The Show tab of the Publish Options dialog box controls what is shown on the server. Remember that Excel always saves the entire file; this dialog box controls only what gets displayed. By default, the entire workbook is displayed.
In the drop-down list, click Items In The Workbook to choose a range of sheets or to choose only specific items from the file. In the example below, only a chart and a pivot table have been selected for display.
Click OK to close the dialog box, and then complete the Save operation.
Only the selected chart and pivot table are available on the server. Notice that the UI that allows the user to open the file is trimmed as well.


Excel Services can be thought of as part of Excel—the part that extends the Excel-based BI story into the browser. This means that BI in Excel Services starts in Excel client. This section walks you through creating a simple workbook and then helps you save that workbook into SharePoint. This section does not provide an exhaustive list of all the BI features in Excel but does touch on a few that you can use to create an interesting report that can then be rendered in Excel Services.
The workbook used in the following procedure was created by connecting to the sample Contoso Retail DW database and connecting to the Sales cube.
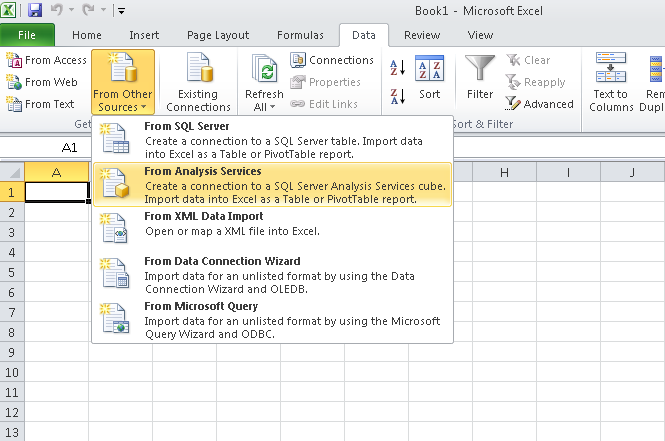
To start the data connection wizard in Excel, click the Data tab, click From Other Sources, and then click From Analysis Services, as shown in the following illustration.
Complete the Data Connection Wizard to connect to the Contoso Retail DW database, click the Sales cube, and click Finish.
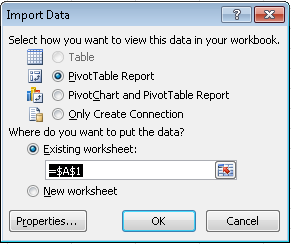
In the Import Data dialog box, shown in the following illustration, select PivotTable Report to create a new pivot table report in your sheet.
In the PivotTable Field List dialog box, shown in the following illustration, click Sales to filter the list of fields to display only those relevant for the Sales data.
Scroll through the field list, selecting the check boxes next to the Sales Amount and Product fields. This adds the primary data to the spreadsheet that we will be working with.


Use the following procedure to add a second pivot table to the report so that you can compare product sales to the cost of making those sales.
On the Data tab, click Existing Connections.
Click the name of the Contoso connection you created earlier, and insert a new pivot table. Insert the pivot table to the right of the pivot table you created before. (We inserted this new table in column F, but you can always move these pivot tables around later if you need to.)
In the new PivotTable Field List dialog box, click Sales to show only data relevant to sales, and then click Sales Total Cost and Channel Name so that you can see the cost of sales from each sales channel.
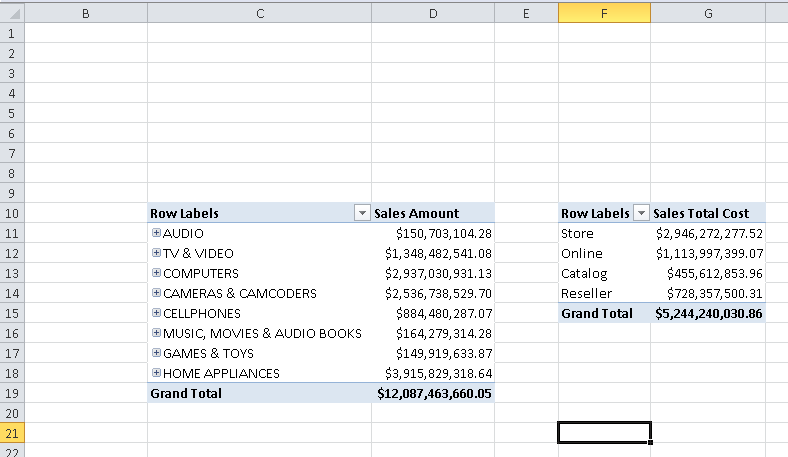
As shown in the following illustration, you should now have two simple pivot tables showing data about sales, sales channels, products, and the cost of sales.
Save the workbook.

You can use the following procedures to take advantage of some new Excel 2010 BI features.
To make it easier to gain some insights into the data, the following procedure shows how you can add conditional formatting to help make the outliers in the data really pop.
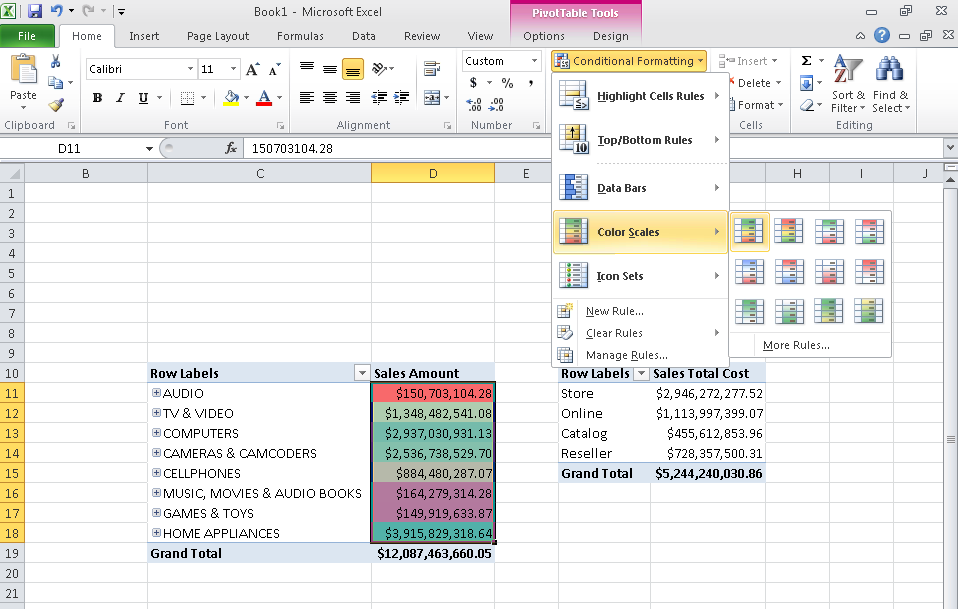
Select the Sales Amount for each sales category on the Sales Amount pivot table. Don’t select the grand total at the bottom though; you want the conditional formatting to apply only to the subtotals for each product category.
On the Home tab, click Conditional Formatting, click Color Scales, and then choose the color scale that appeals to you.
Repeat the previous steps for the Sales Total Cost pivot table, but this time use an icon set as shown in the illustration provided in Step 5 of this procedure. You might need to expand the column showing the Sales Total Cost after you apply the icon formatting so that the numbers display properly instead of showing hash marks (#####).
Right-click the Audio value in the Sales Amount pivot table, and select ExpandCollapse | Expand Entire Field from the pop-up menu to drill down one level on all product categories in the pivot table, exposing aggregated totals for all the products in each category.
Select all the products for the Audio group products, but do not select the total for the Audio category. (The total row is the row that has the color scale formatting applied to it.) Apply data bar formatting by clicking Conditional Formatting on the Home tab, clicking Data Bars, and then choosing a data bar color that appeals to you. Repeat this for each category in that pivot table.
You should now have a report with two pivot tables and some conditional formatting similar to the formatting shown in the following illustration.

Slicers are a new feature that you can use in conjunction with pivot tables. They make filtering operations to display the correct subset of data much easier than it was in the past. Slicers look like toggle buttons that appear when the data they represent is being displayed in the tables they filter.
Slicers that don’t contain data (because all their values might already be filtered out by some other filter) appear as disabled or empty. So not only is the slicer UI a more intuitive way to filter, it also provides visual clues that say something about the data.
Slicers also give users a great deal of control over the visual display of a report; they can resize and reposition the reports, can adjust the button sizes, and they can control the slicer color theme as well.
Slicers also become very useful in cases where you have different sets of data that need to be filtered by the same set of values. You can connect slicers to more than one pivot table, giving you the ability to “slice” the report.
You can use the following procedure to add some simple slicers to the report you’ve been building in this chapter.
Select the Sales Amount pivot table by clicking any cell in the pivot table. (For example, in the illustration shown in Step 3, the Bluetooth Headphones cell is selected.)
On the Insert ribbon, click Slicers to see a UI very similar to the pivot table field list.
Scroll down to select the calendar year and the product subcategory name, as shown in the following illustration, and then click OK.

Two new slicers have been inserted into the workbook. Now you can add some formatting.
Click and hold on the title of the slicer to drag the Product Subcategory Name to the right of your pivot tables. Then drag the Calendar Year to a position above your pivot tables.
Select the Product Subcategory Name slicer, and click the Slicer Tools tab. In the Buttons group, change the Columns value to 3, the Height value to 0.2″, and the Width value to .92″. Then, in the Size group, change the Height value to 4.15″ and the Width value to 3.01″.
Repeat the process in Step 2 for the Calendar Year slicer, but this time, in the Buttons group, set the Columns value to 3, the Height value to 0.2″, and the Width value to 1.05″. Then, in the Size group, set the slicer Height value to 1.1″ and the Width value to 3.4″.
In the Slicer Styles group, select the light green style (or any other style that appeals to you).
You should now have a report that looks something like the following illustration.

At this point, spend some time playing around by selecting the slicer buttons. You should see your pivot table update. Notice how some buttons look inactive at certain points. If you click one of these inactive buttons, your pivot table goes blank because there is no data for those buttons. Also notice that you can select (or Ctrl+Click) multiple buttons at the same time. Finally, notice that you can clear the slicer by clicking the Clear icon at the top of the slicer.
Now let’s connect your slicer to the other pivot table. The Sales Total Cost pivot table shows different data, but the fields that the slicers are filtering apply to that set of data as well.
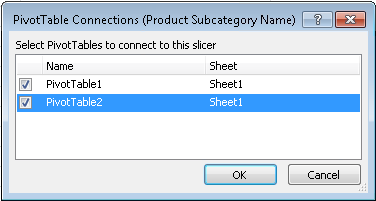
To connect the Product Subcategory Name slicer to that pivot table, select the slicer and then on the Slicer Tools tab, in the Slicer group, click PivotTable Connections.
When the PivotTable Connections dialog box opens, make sure each check box next to each pivot table is selected as shown in the following illustration, and click OK.
Now when you click the slicers, you should see both pivot tables being updated.
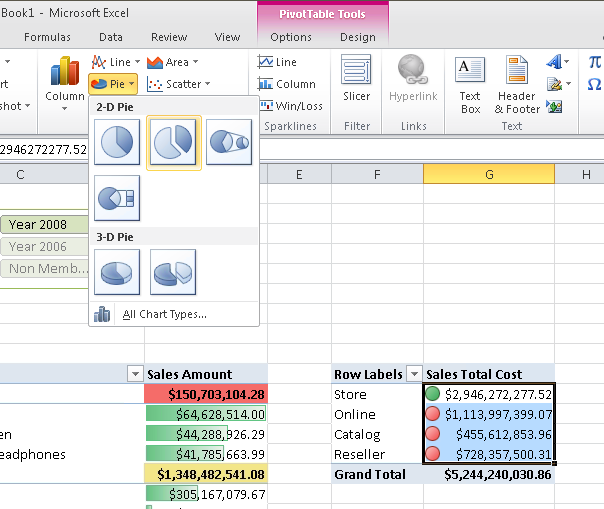
What report would be complete without a chart? Let’s add a chart to show the split of Sales Cost.
Highlight values from the Sales Total Cost pivot table (don’t select the Grand Total row though), and on the Insert tab, click Pie to choose and insert a 2-D split pie chart, as shown in the following illustration.
To format the chart so that it looks a little better in the report, drag the chart to position as needed, and then grab the corner of the chart to resize it so that it fits above your Sales Total Cost pivot table. You can optionally choose a chart style you like from the chart ribbon as well.
Click the Chart Analyze tab, and then in the Field group, click Hide All.
Finally, click the word Total in the chart, and then type in Total Sales Cost.
The chart in the workbook should now resemble the following illustration.

If you want to make things fit together a bit more tightly in the report, resize columns B and E to make them smaller and spend some time lining up edges of pivot tables, resizing charts, slicers, and so on.
If you don’t like how the pivot table columns resize and adjust the look of your report when you drill down or filter on your pivot table, you can turn the resize behavior off. To do this, right-click your Sales Amount pivot table and click PivotTable Options on the pop-up menu. When the PivotTable Options dialog box opens, clear Autofit Column Widths On Update check box and click OK.
The report, with the preceding minor adjustments to size and position completed, should resemble the following illustration. (Notice that the Sales Amount pivot table has most of its fields collapsed.)

Sparklines are a great new BI feature in Excel 2010 that you can use for showing large amounts of graphical data in a way that can be summarized in a single cell.
You can use the following procedure to add some simple sparklines to the sample report. However, before you can add sparklines, you need to add some data in the spreadsheet that you can summarize. To do this, you can insert another pivot table from the existing data.
Select cell K3 as the designated location for the new pivot table. Then, just as you did to insert your first pivot table, on the Data tab, click Existing Connections, and under Connections In This Workbook, click the Contoso Retail DW Sales connection, and then click Open.
When the Import Data dialog box opens, click OK to accept the default of creating a PivotTable Report.
You should now have a new pivot table in the workbook.
In the PivotTable Field List dialog box, click Sales to limit the fields to data relevant only to sales. Then select the Sales Total Cost check box for the measure, and select the Calendar YWD check box in the Date field, as shown in the illustration in Step 4 of this procedure.
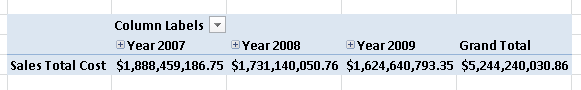
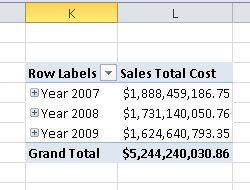
Referring to the following illustrations, drag the Calendar YWD value from the Column Labels box into the Row Labels box so that the calendar dates are displayed on the rows.
You should now have a new pivot table in the workbook that resembles the following illustration.


Select the cell for Year 2007 in the pivot table, right-click it, and select ExpandCollapse | Expand Entire Field.
The pivot table should expand to show the totals for each week of each of the three years.
Select each of the weeks for the year 2007 (but do not select the grand total for 2007). On the Insert tab, in the Sparklines group, click Column, as shown in the following illustration, to open the Create Sparklines dialog box.
In the Create Sparklines dialog box, the Data Range text box is populated with the data you selected from the pivot table, as shown in the following illustration.
Click the Edit Reference button on the right side of the Location Range text box to collapse the dialog box and enable you to select a cell where you want to place the finished sparkline. Select cell C7. This populates the dialog as shown in the following illustration.
Click the Ref Edit button on the right side of the textbox shown in the preceding illustration to expand the Create Sparklines dialog box once more, and then click OK to insert the sparkline.
A default blue sparkline representing the trend of data for the year 2007 is inserted into the cell you selected, as shown in the following illustration.


To be truly interactive, the sparkline should update when the report is sliced using the slicers. It doesn’t make sense for the date slicer to affect the sparkline because the sparkline is always for the year 2007. But when the products are sliced, the sparkline should change. Because the sparkline is based on a pivot table, you can simply connect the Product SubCategory Name slicer to the pivot table on which the sparkline is based.
To connect the slicer to the pivot table, follow the steps in the earlier procedure titled To connect the slicers to another PivotTable, except perform them for the Product SubCategory slicer against the Sales Total Cost pivot table on which the slicer is based.
Repeat this process for all of your sparklines.
Try clicking the slicer, and notice how the pivot tables—and now the sparklines as well—update with new data as you slice the report.
You don’t have to settle for the default sparkline appearance. You can use the following procedure to change the default look by dressing up the sparkline a bit.
Click the Design ribbon under Sparkline Tools. This ribbon contains many options for formatting or adjusting other properties for the sparkline.
Choose a faded red style from the styles gallery. Then in the Show group of the spark-line tools ribbon, select the High Point and Low Point check boxes to highlight the high and low points of the trend. The sparkline should now resemble the following illustration.
To make it more obvious what year this trend belongs to, select the cell containing the sparkline and type in 2007. Then adjust the size of the text, the color of the text, left-align it, and apply any other text formatting as you please. The sparkline now resembles the following illustration.
Follow the preceding steps to create sparklines for 2008 and 2009 below your existing sparkline. I chose different colors for each year, so my finished set of sparklines displays as shown in the following illustration.

The last step in getting the sparklines in your report is to hide the pivot table from which they summarize data. The pivot table is large, and the numbers it shows aren’t particularly interesting. The only interesting data from that pivot table is the trend—and you have captured those trends using only three cells with the sparklines!
Note
By default, if you hide rows that a sparkline is summarizing, that sparkline ends up showing no data. To keep the sparkline showing the trend data, you need to change this setting.
Select the sparkline you want to adjust. (You can adjust them only one at a time.)
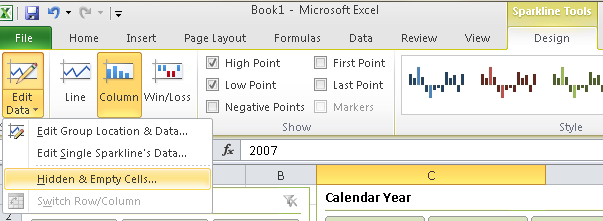
On the Sparkline Tools Design tab, click Edit Data in the Sparkline group, and click Hidden & Empty Cells, as shown in the following illustration, to open the Hidden And Empty Cell Settings dialog box.
In the Hidden And Empty Cell Settings dialog box, shown in the following illustration, select the Show Data In Hidden Rows And Columns check box and click OK.
Repeat Steps 1 through 3 for each sparkline.
Select the columns K and L that contain the pivot table you created. Right-click the column headers, and select Hide to hide the pivot table so that it is not visible as part of your report.

At this point, you have a nice report that you can save to SharePoint.
Before you save the report, you can use the following procedure to make the file look a little nicer by turning off the display of gridlines and headings.
On the View tab in the ribbon, clear the Gridlines And Headings check box. This turns off row and column headings, making the report look much cleaner.
Go ahead and resize, adjust, change colors, and generally clean up your report to get it looking exactly the way you want. (We deleted Sheet2 and Sheet3 because they weren’t used, renamed Sheet1 to Report, and applied a faded green style to each of our pivot tables.)
The finished report will be interactive via the slicers and drill-down buttons on the pivot table, and you should see the complete report updating when you interact with it. The finished report should resemble the following illustration.
Now the file should look more like a report that might be proudly shown across an organization.
Note
To load the file to Excel Services, you must first save it to SharePoint. You can follow the steps outlined in the section titled Locking Down Excel Files, earlier in this chapter, or you can simply save the file to SharePoint.
To save the file to SharePoint, click File, and then click Save & Send. Click Save To SharePoint, and then select a location or click Save As.


This section provides important information about viewing and editing your Excel Services workbooks, as well as displaying your workbooks in a SharePoint dashboard.
The file from the preceding section should now be saved in SharePoint. To use Excel Services, simply navigate to the document library where you saved the file and click the file. This renders the file in the browser by using Excel Services, as shown in the following illustration.
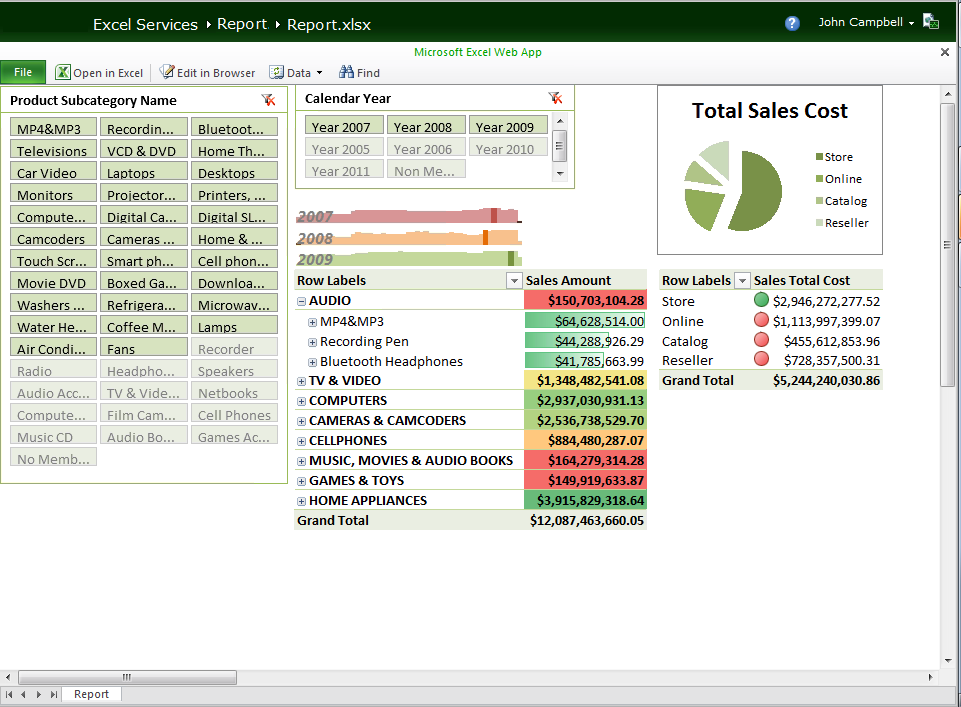
Notice that the report’s visual fidelity is maintained even though this version of the file is rendered in your browser. Excel Services also has complete calc fidelity, meaning that a workbook calculated in the Excel client yields the same numbers when calculated on the server.
Note
In some workbooks, some formulas are deactivated on the server for security reasons because they can expose information about the server environment.
Also notice that the workbook is interactive. For example, try drilling down on the pivot table: The data refreshes on the server just as it would on the client. Also try using one of the slicers. You’ll see that the entire report is sliced just as it would be sliced in the Excel client.
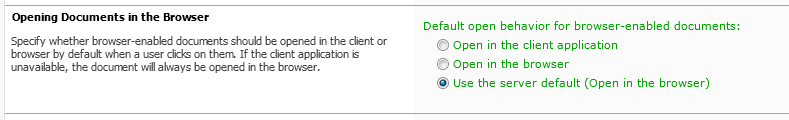
Excel Services provides a setting to control whether a default click on a document opens the Excel file in the thick client (the Excel client) or Excel Services. To access that setting, from the SharePoint document library in the browser, on the Library tab, click Library Settings. On the next page, under General Settings, click Advanced Settings. In the Opening Documents In The Browser section, you can choose whether the document library follows the default server policy, opens using a web browser, or opens using the Excel client.
You can try editing this or any other Excel file that you can view on Excel Services.
Because this file uses external data refresh, it is editable on Excel Services only if you first check the file out. This is true of all Excel files that perform a data refresh because all editing is collaborative on the server. Any user with permissions to edit the file can join at any time. When editing collaboratively, all users share the same session—and hence all users would share the same set of credentials, which can present a security issue in some environments. To prevent cases where other users might be using your credentials to perform a data refresh, Excel Services requires that you first check the file out to prevent others from joining the edit session.
When you check this file out from the document library and then view it with Excel Services, you can click the Edit In Browser tab. The editing capabilities are basic in Excel Services; you can add formulas (by typing the = sign in a cell and then typing the formula name), add text, format cells, add hyperlinks, add tables, and more. The editing is a subset of the most basic spreadsheet editing functionality and can be useful in many cases where you have a single spreadsheet that many users need to enter data into.
To see collaboration in action, simply open another instance of your browser, go to the SharePoint document library, and chose to edit the file in the browser. In this case, you are now “collaborating” with yourself.

SharePoint provides the ability to combine insights from Excel workbooks to be consumed side by side with other data in SharePoint. The most common way to do this is to configure a Web Part page in SharePoint. This gives a quick and easy way to get Excel based data into a dashboard format that many BI users are familiar with. See Chapter 8, for a more complete discussion and step-by-step guidance.
When designing a BI solution, you inevitably run into places where the functionality that came with the product isn’t sufficient to do something customized to your particular needs. This is where extensibility comes in; it involves extending the product to meet a custom set of scenarios.
This section provides a high-level overview of the extensibility mechanisms available for Excel Services, but it is not intended to be a one-stop shop for details about any specific extensibility mechanism. Instead, it provides descriptions of each approach, when you might want to use that approach, and provides some pointers to online references where you can get more information.
The four primary ways to extend Excel Services are as follows:
User Defined Functions
Excel Web Services
Javascript Object Model
REST
The following subsections provide an overview of each.
UDFs are simply managed-code assemblies written to perform a specific task and deployed to the server. These managed assemblies can be called from a workbook just like any other Excel function. So they can take a set of parameters from other cells in the workbook, and they can return a single value or an array of values.
UDFs are particularly useful when you are using custom-coded routines to calculate a particular set of values in a particular way. They are also great mechanisms to use for performing other tasks in the system or in another system. Some UDF examples I have seen include: refreshing data from a SharePoint list; writing some custom data values into a data store that are specific to the user viewing the workbook; retrieving values from a custom data store; performing complex mathematical computations; and parsing data from the web, returning a list of values based on the custom web query.
UDFs aren’t a replacement for full VBA solutions or macros. For example, they don’t provide any type of object model against a workbook on the server.
To learn more about UDFs, see “Excel Services User-Defined Functions” at http://msdn.microsoft.com/en-us/library/ms493934.aspx.
Excel Services provides a SOAP-based web service that allows programmatic access to workbook files loaded on the server. The web service isn’t only for use on the web—you can call it from any application that knows how to call a web service, including custom-built client-side applications and other web-service aware Microsoft applications, such as InfoPath.
The web service is a great way to access values from a workbook when you don’t need to display the Excel UI. It enables you to do things such as set values, recalculate the workbook, refresh the data, and retrieve the entire workbook or just values from certain cells. If the Office Web Applications are installed and Excel Services editing capabilities are enabled, you can also persist values in the workbook.
To learn more about Excel Web Services, see “Excel Web Services” at http://msdn.microsoft.com/en-us/library/ms572330.aspx .
The Excel Services ECMAScript object model (JSOM) is similar to Excel Web Services in many ways: it supports loading workbooks, setting values, recalculating and refreshing workbooks, and the ability to retrieve specific values from the workbook. It also supports a number of things that the SOAP-based web service doesn’t, such as displaying the UI and an event model.
ECMAScript code is designed to be run on a page inside a browser as part of a solution where the user is interacting with the core Excel Services UI. It provides events, so you can programmatically react to things that the user does. For example, when performing some simple data validation, if a user types in a value that is below 100 in cell A1, you might want to show a pop-up window stating, “The value is too low. Enter a value greater than 100.” Events include such activities as “a cell is being edited” or “a value in a cell has changed.” These events are fired by Excel Services, and your solution can take action on them.
Some events allow you to know which cells have been selected. This makes it possible to navigate the Excel Services UI to a different location in the workbook or even to have a second window on the page that shows Excel Services UI based on the selection. Solutions with VBA buttons on the first Excel sheet are fairly common. When users click a button on the first sheet, they might be taken to a different part of the report. Unfortunately, such solutions don’t work on Excel Services, because VBA isn’t supported. But you can re-create such solutions by using the JSOM on a webpage.
To learn more about the Excel Services ECMAScript, see “Excel Services ECMAScript (JavaScript, JScript),” at http://msdn.microsoft.com/en-us/library/ee556354.aspx .
REST stands for Representational State Transfer. It is commonly used to retrieve an XML description of a webpage by using only the URL to the webpage. For Excel Services it means that, given a URL to a workbook file, you can access the entire file or parts of the file from any client that knows how to traverse a URL and request content.
This powerful concept allows users to build useful solutions without actually writing any code. The “code” in this case is just a carefully crafted URL. The URL specifies the path to the workbook. Then the REST query portion of that URL specifies any values that should be set into certain cells in a workbook, as well as what object or values should be retrieved.
REST supports retrieving many types of objects from a workbook (charts, cell values, tables, and so on) and enables you to specify what format they should be in (xml html, or an image).
Using REST, you can easily embed a chart or table of data based on Excel logic into a blog, webpage, or any other application that can traverse a URL. And the file itself isn’t embedded—the file is stored safely in SharePoint. Instead, Excel Services loads the file, recalculates it to get the latest numbers, and returns only the result to be embedded in the webpage. So as the file updates, the blog or page gets the latest numbers or image as the page is reloaded.
REST is also a great way to quickly and easily retrieve data from the workbook in xml format for further processing as part of a more advanced solution.
The same concept works for anything that can traverse a URL and bring back data from it, including applications such as Microsoft Word, PowerPoint, or InfoPath. Have you ever wondered how to get an Excel chart into a PowerPoint deck and make it refreshable—without having to copy the file or embed the full file into PowerPoint? REST is the answer. Leave the file in SharePoint, and insert an image into PowerPoint. Then, in PowerPoint, specify that the image is from a link, provide the REST URL to the chart, and enjoy an image that gets refreshed every time a user opens the PowerPoint file.
To learn more about the Excel Services REST, see “Excel Services REST API,” at http://msdn.microsoft.com/en-us/library/ee556413.aspx .
Many existing BI solutions are already in Excel, and by adding SharePoint plus Excel Services to the mix you can gain the extra level of control and functionality needed to fully leverage Excel based BI solutions. Excel Services with SharePoint provides management, security, support for the new Excel-based BI functionality, and a way to broadly share and interact with spreadsheets. Excel Services doesn’t require any client-side install but still allows users to recalculate, refresh, interact with, and even edit spreadsheets. (You need to install the Excel Web App as part of the Office Web Applications for edit capabilities.) Excel Services, in the tradition of Excel, also provides a platform for building more advanced solutions via one of the four extensibility mechanisms (UDFs, web services, JSOM, and REST).
In this chapter you had an overview of all of Excel Services along with some step-by-step guidance to help get you started with the product. The following table contains a quick summary of options and steps for common tasks, along with pointers to the relevant sections in this chapter for more detail.
|
To |
Do this |
|---|---|
|
Adjust settings to customize or troubleshoot your Excel Services configuration |
Launch the Central Administration page and navigate to the Administration page for your Excel Services service application:
|
|
Tightly lock down Excel files so that the IP in the workbook is protected while still allowing the workbook to be shared broadly |
Configure View Only permissions on the file in SharePoint. For more information, see the section, Locking Down Excel Files. |
|
Connect a workbook to external data from Excel client and create a pivot table |
Use the Data Connection Wizard to connect to data as well as create a pivot table. For BI, this is usually against an OLAP source such as Analysis Services. For more information, see the procedure, To configure authentication in the workbook. |
|
Connect multiple pivot tables together so that they can be filtered in an easy and intuitive way |
Add Slicers to the workbook and hook them up to your pivot tables. For more information, see Adding Slicers. |
|
Help users more easily find trends, outliers, and generally make sense of the data |
This really boils down to making a great report in Excel and utilizing the BI features that are appropriate for the kind of data you are visualizing. Options include:
|
|
Share workbooks broadly without requiring Excel |
Upload or publish the workbooks into SharePoint. Simply click the file in SharePoint, and use Excel Services to view and interact with the workbook in the browser. For more information, see Viewing and Editing Workbooks in Excel Services. |
|
Allow editing for workbooks in situations where employees are on the go, are away from their installed Excel version, or otherwise need to make collaborative or simple edits. |
Use the editing capabilities added by installing the Excel Web App as part of the Office Web Apps on SharePoint. This enables editing of workbooks in the browser. For more information, see Editing Workbooks. |
|
Extend the capabilities of Excel Services to address custom needs or enable custom scenarios |
Depending on what you want to do, many options for customizing your scenario are available, including the following:
|