Organizations and organizing
1.1 The business world
This section examines the business world by starting with a look at the influencing on a business through the PEST analysis. It then describes the different types of organizations, including the different legal forms that can be taken. It goes through the business plan essentials for a startup situation and then concludes by looking at the external money transactions that are made.
The business world is a complex situation. Each organization exists in a world of opportunities and constraints. The best way to describe this environment is to carry out a PEST analysis, to consider the ways that outside forces impinge on an organization. PEST stands for Political, Economic, Social and Technological factors. There are a few similar acronyms such as STEP, STEEP, LE PEST C, which cover similar factors.
PEST analysis
This analysis looks at a variety of present factors which presently affect the business world and gauges the probability of changes arising. The areas examined include:
Political factors
• Legislative structures of the EC, national and local government and how they are changing.
• Monopoly restrictions such as the Office of Fair Trading and the Monopolies Commission in the UK and similar structures in the EC commission and other countries and how they are interpreting events in a worldwide context as well as domestically.
• Political and government stability – not only extreme cases such as armed insurrection, but even in the UK a change of government may herald changes in legislation such as deregulation and privatization of state controlled industries, which affect businesses – as happened in Western Europe in the later decades of the twentieth century.
• Political orientations of governments’ attitude towards business, trade unions and the environment often drive tax and other economic policies.
• Pressure groups such as Friends of the Earth and the various consumer groups can influence not only buyers’ and investors’ attitudes, but also government policy. This affects matters such as the environment legislation and delays in the construction and other industries by public enquiries. Other examples include the fuel price escalator in the UK during the 1990s.
• Taxation and grant policies can change over a period. For example, the various UK and EC grant schemes and changes in policy on capital allowances for factory construction in areas of high unemployment.
• Employment legislation in areas such as equal opportunities, working time directive, etc.
• Foreign trade regulations both at home and in a country targeted for exports, for example many countries, have restrictions on the importation of certain goods to protect indigenous industries. This happens not just in the developing countries, but also in the developed countries, as can be seen from the regular meetings of GATT (General Agreement on Tariff and Trade) where discussions have been ongoing since 1947 without completely eradicating national tariffs and quotas.
Economic factors
• Business cycles: These are a natural rise and fall in demand for products which have been observed throughout history. They are caused by a complex mixture of factors and can be quite severe on occasions, i.e. the depression of the 1930s. Unfortunately these cycles vary considerably and are not easy to forecast. Governments have attempted to do so in the hope of controlling them, with limited success.
• Money supply: Reflects government action on government tax and spend policy and actions such as credit availability controls. The saving behaviour of individuals can affect the circulation of available money as can be seen in Japan where there is a high tendency towards saving when future trends look pessimistic.
• Inflation rates, i.e. the rate at which prices of products, services and wages change. This can affect people’s attitude to credit and savings and the ability of people on fixed incomes to have surplus money for spending. It can affect the flow of imports and exports as the exchange rates vary in relation to other countries.
• Investment levels: Ties in with business confidence about the future, perhaps based on an assumption regarding the stage of the business cycle. This cycle especially affects the construction and machine tool industries.
• GNP (Gross National Product), i.e. the value of the productive efforts of the nation as a whole.
• Pattern of ownership – especially trends in same. Examples include home computers, mobile phones and the growth in car ownership.
• Energy costs: Can affect the cost of making products. Also affects the consumer’s attitude towards various products and their functions. A good example is the drive for lower fuel consumption in cars following the oil price rises of the 1970s.
• Unemployment. Is a double-edged factor. Low unemployment means a healthy demand from consumers, but it also leads to a shortage in certain key skill areas which tends to drive up wage costs for these jobs.
Socio-cultural factors
• Demographics, i.e. the make-up of the population – the age groups, where they live, etc.
• Lifestyles: As well as fashion trends, this also looks at habits such as eating out, holiday preferences, central heating, etc.
• Education levels: This will determine the ability of staff to take on new ideas, equipment and processes. It will also affect job seekers’ expectations towards company policy and pay.
• Consumerism: This reflects the growing power of special interest groups towards policies. Consumer panels often advise the regulator on privatized industries regarding service delivered and allowed charges.
Technological factors
• Levels and focus of R&D expenditure within the industry and especially by your competitors.
In addition to the PEST analysis, there are always the competitors’ actions which will directly affect a business in its relationships with its customers. Chapter 6 deals further with the market and an organization’s competitive position therein.
Organizations
Organizations come in many shapes and forms, from the one-man business to the large multinationals employing thousands of people in many countries. Although most are profit making there are also some which do not have making a profit as one of their aims, such as the National Health Service, one of the largest employers in the UK.
For a group of people to become an organization requires more than just casual contact – it requires a formal relationship of the participants in working towards a set goal. So what are the goals for organizations?
There are probably as many goals as there are organizations. The first one must be continual survival, and money is the important component in this. Even all the not-for-profit organizations such as charities, trade unions, the civil service, the National Health Service and state education, which are very large organizations, must have money to complete their function and ensure their continued existence.
In this textbook, we are mainly considering the organizations which supply services or products for a profit. If the profit does not materialize, then they will have to cease trading – either voluntarily or by being put in the hands of the official receivers, i.e. by being made bankrupt.
It is therefore important to recognize the legal status of those companies you deal with – especially if you are supplying them with goods on payment terms. It is illegal for a business to continue to trade when they know they cannot meet existing debts, but that fact does not guarantee your payments will be made. You need to determine your own risk.
Types of ownership
The basic one-person business – although it may employ others. This is the majority of businesses where one person raises the investment capital and takes all the profit. The owner also takes all the risk and remains personally liable for the business debts.
Most small businesses do not grow and many fail because:
• Many ideas are not commercially viable.
• Many owners have little commercial understanding and training.
• Capital raised is insufficient to cover the initial time until customers build up.
This size of business does, however, have its advantages:
• Personal involvement of the owner.
• Quick decision making and action.
• Normally communications are easy.
• Details of earnings required by tax authorities are limited, in effect they are treated as self-employed and do not require to submit audited accounts.
The latter does not mean that sole traders should not keep detailed accounts for their own purposes.
Partnership
Basically similar to the sole proprietor, but involving more than one person – up to twenty people can be partners, although more are allowed in certain professions. All partners have the same ultimate liability as the sole trader, even a sleeping partner, i.e. someone who contributes to funding but takes no part in the day-to-day management of the partnership. Working, and sleeping, partners do not necessarily take the same share of the profits, but cannot take a secret share.
This is a common arrangement amongst professions such as accountants and consultant engineers. It has the advantage of more skills and money available initially.
Again the details of earnings submitted for tax purposes are limited although it is highly likely that detailed audited accounts will be required to demonstrate a proper share out of the profits.
The registered company
This is an artificial legal individual under the law, i.e. it is legally separate from its owners. There are three types:
• Unlimited company: Whilst still a separate entity, the owners retain full liability for the business debts. This has advantages in certain circumstances that full accounts need not be disclosed.
• Limited company: The owners have a liability for debts only to the extent of their agreed shareholding. If they have not paid for all their shares when the company ceases trading, they will have to pay up
– but only for the amount they have outstanding. A limited company can be private, or public:
– Private limited company: The shares for this type of company cannot be offered on the stock market, but it is still a limited company. It has the advantage that owners can take decisions without considering how their share price fluctuates on the stock market, but has the disadvantage that selling of shares is more controlled, i.e. they cannot be offered on the stock market only by personal contact with the buyer.
– Public limited company: The shares for this type of company are bought and sold on the stock market and as such the share price has an influence on the operation of the company. Legally these companies are controlled by their owners, i.e. the shareholders, but in practice the day-to-day operation is very much in the hands of the company directors.
The accounts of registered companies do need to be audited independently annually and submitted for company tax purposes (see Chapter 5).
The limitation of liability does make dealing with a limited company more risky, but most companies do have a long life, therefore as long as you keep track of the company’s performance these risks can be kept small.
Without this limitation in liability, it would be extremely difficult to persuade investors to risk participation in companies. However, it is also said that the limitation deprives creditors of a full comeback if the company is mismanaged – after all the shareholders are legally supposed to be the ultimate controllers.
Setting up a business
Sole traders and partnerships are relatively easy to set up as they require no legal stages to come into existence. They do, however, require registration for tax, VAT (Value Added Tax) and National Insurance contributions. The main problem with their formation tends to be the raising of capital.
Although it is not a requirement, most partnerships do complete a legal Deed of Partnership, i.e. a personal contract between the partners. This should spell out their relationship on matters such as capital input, share of the profits, management of the partnership, signatories for contracts and cheques, and how partners are changed, e.g. addition of a new partner or a present partner leaving the partnership.
Where a partnership wishes to trade under a name other than that of the partners, they need to have the name registered with the Registrar of Business Names.
When forming a company, the procedure is more arduous and registration under the Companies Act 1980 is required. The following need to be presented.
Memorandum of association
This is a document explaining the external workings of the company for prospective subscribers. It must include:
• The company name – including Limited or Ltd if a limited company.
• The objects clause: This sets out the purpose that the company is being formed to do. Legally this limits what the company can be involved with and may make some contracts void, although this is often mitigated if a contract has been entered into with good faith.
• Limited liability – if appropriate.
• The nominal share capital at registration, i.e. the amount available and the unit of issue, e.g. £100 000 in £1 shares. Note a private company has no minimum amount, but a public company has an authorized minimum of £50 000 under the Companies Act, although this need not be all issued, i.e. sold, at the start-up. This section should also denote the type of shares.
The articles of association
This document shows the internal workings of the company, i.e. its rule book. It covers matters such as annual meetings, election of directors and some matters relating to the day-to-day management.
The costs of setting up a company, even a limited company, are quite small and the steps are simple, although it is advisable to employ lawyers skilled in this type of work to avoid unnecessary complications later.
Starting up your own company
Every organization should be working to a moving series of business plans which lay out the direction in which it proposes to move over the following years. These tend to be split into short term (tactical) for a year or so and longer term (strategic) for five to ten years. Even for the long-term plans, we need to prepare matters so that there is a firm base.
A business plan is especially necessary for the start-up situation as it can be the basis on which it may attract financing. Many of the tools you require to complete a business plan are contained within the chapters of this textbook and the main pertinent chapters are shown with the headings of the plan.
For example, when you decide to start up a new business you will need to approach a bank to open a business account, even if you are not borrowing or arranging credit facilities through them. The bank will want to see your business plan before it decides on taking you as a customer.
There are many packs available from banks which guide you through the process, and you are advised to get a few from various banks. In the main they will require a properly presented plan which will contain the following details.
A summary of the plan
This will outline what the business is and the market potential for its product or service. It should state the dates of starting and include a profit forecast and what additional investment is required. If you have been trading, it should include the accounts for that period.
Management (see Chapters 1 and 2)
Management should denote the legal form of the business, i.e. sole trader, partnership or limited company, including the Memorandum and Articles of Association for the latter.
Starting with yourself you should detail your proposed role in the business and your business record and achievements, especially those directly related to the present business. The latter should give a clear idea of past responsibilities, and personal skills and competence.
You should do the same with any partners and other key skilled people involved, so that the bank can see the breadth and depth of the management. This should also indicate what management weaknesses exist and what is planned to address them.
Product or service (see Chapter 6)
This should describe your product or service in clear simple terms. If it is a complex product then you should include the technical detail in a separate appendix. Any unique selling points and price need to be highlighted, including any after-sales requirements.
A brief summary should be made of your nearest competitor’s products/services and price for their nearest equivalent offering. This should indicate why you believe your offering can compete.
Market description (see Chapter 6)
• Who are the potential buyers – by size, number, business sector, etc.?
• Is the market static or changing?
• Are there identifiable sectors which require different offerings?
• How often does a buyer purchase your product, i.e. a single sale or repeat customers?
• What are the market qualifying and order winning criteria?
• Number of competitors and their position in the market.
• What your selling and advertising plan will be, including who will be doing the sales contacts.
Operations (see Chapter 5)
Here you need to detail the premises where you intend to operate in and trade from and the associated equipment and vehicles you need to purchase, or already possess. The age and expected usage/life may need spelling out with a replacement policy if equipment is second-hand.
This should include any processes that will be operated at particular locations, so that you clearly have a right to do so, and have considered environmental matters such as safety, noise and other nuisances.
It will not be sufficient to say merely that you propose to have your product entirely produced and packed by a sub-contractor. You must include actual quotes if this is proposed and show how you will prevent your supplier marketing a similar product.
Record system (see Chapters 5 and 7)
As it is important that a close watch is kept by the company over matters such as cash flow and outstanding debts, it is imperative that you demonstrate that proper records will be kept. The intended use of software would look good here.
Finance (see Chapter 5)
You will need to state where you are getting the funds to start your business. In addition to your own money, you may be borrowing from friends and family or perhaps a venture capital company if you have a good product or service. Banks like you to be risking your own personal money, especially if you wish to borrow some extra from them.
You will have to include as appendices cash flow and budgeted profit and loss statements for the next two years. The first year normally needs to be on a month-by-month basis, but the second year may only need to be on a quarterly basis. This should indicate what assumptions have been used to arrive at the figures.
Costs must be clearly identified in value and timing. These will include:
• Source of capital and repayment and interest terms.
• Start-up and development costs.
• Premises cost including any lease terms.
• Equipment purchase and running expenses.
• Material costs, both direct and other consumables, including any arrangements for trade credit.
• Wage costs and basis of application. Include your own anticipated drawings.
• Cost of services such as telephone, lighting, heating and water/sewage.
• Arrangements for VAT, tax and National Insurance payments.
• Vehicle purchase and running.
• Miscellaneous expenses such as stationery and postage.
• Insurance of persons, property, employees and product liability.
Legal matters (see Chapters 1 and 3)
In addition to the particulars of what type of business it is, i.e. sole trader, partnership or a company, you will need to demonstrate you have considered all other legal aspects such as:
Owners’ objectives
Although this may appear an extra, it is often necessary to include the long-term plans of the owners to see how the business fits in with this.
Who to consult
There are many sources who it would be useful to consult both before and when starting a business. Some offer assistance with training and others will arrange the appointment of mentors to aid you through your start-up. The sources include:
• Business Links (in Scotland Business Shops).
• Training and Enterprise Councils (TECs).
• Local enterprise and development agencies.
The last is a very useful source of potential pitfalls and advice on many matters. It could prove useful to join a local small business club to share problems with others – and incidentally the added possibility of picking up business.
Money transactions
In Chapter 5 we examine how the organization looks at money within itself, i.e. investment appraisal, costing, book-keeping and budgeting. What we are concerned with here are the financial transactions that the organization has with the outside world.
In a business contract, there must be consideration, i.e. in return for a product or service something of value will be given in return. In past times, a system of barter did exist, but money became the universal medium of exchange many centuries ago. It could be said that if money did not exist, then neither would the industrial world, as the barter system could not accommodate the many transactions which take place today.
The organization will have to make the following payments out of their funds on a continual basis and needs a detailed record of them and any associated paperwork:
Pay to employees, after deductions
Expenses to employees. Note petrol allowances can vary on a mileage basis
Payment to suppliers of products, services and facilities, including
details of delivery notes and credit for returned purchases
Payments under leases for plant or premises
Payment for plant and equipment purchased
Payment for service cover and spare parts used
Payment to professional advisers
Employer’s National Insurance contribution (NIC)
In addition organizations act as a collecting arm of the government by calculating out, collecting at source and paying to the government the following:
Income tax, NIC and VAT
Employees have income tax and National Insurance contributions deducted from their wages under PAYE, i.e. pay as you earn. Calculation of income tax and NI is complex and varies from year to year. The amounts due are based on a stepped percentage of the pay after reaching a base figure. The percentages and bases are different for both systems and ready reckoning tables are used which are easily incorporated into computer software. However, this means that the software has to be updated each year with changes introduced in the annual government budget.
For many years there have been moves to amalgamate employees’ income tax and NIC and this is now going ahead.
Income tax
Almost everyone has to pay this on their total income less any tax allowances. If you are an employee the government works out your tax allowance and gives you a code. Your employer works out your income tax based on this code which gives you an amount before you pay tax. On the remainder you pay a progressive tax, i.e. an initial rate for a set amount, then a variety of increasing rates above that.
Example using 2000–2001 rates:
| Earnings | £32 000 |
| Tax allowance | £6 000 |
| Taxable pay | £24 000 |
| 10% on 0–£1500 | 10% × 1500 = £150 |
| 22% on £1501–28 400 | 22% × 22 500 = £4950 |
| 40% on over £28 400 | Nil |
| Total due | = £5200 |
This figure is not calculated at the end of the year, but has to be done on each pay day.
If you are self-employed, i.e. a sole trader or a partner, you have to agree with the tax office what allowances you can offset before paying tax. If you are self-employed, you can elect to calculate out the tax due yourself.
You may also be due to pay income tax on other earnings such as capital gains.
National insurance
With National Insurance there are different bases for calculating the contributions due from the employee, the employer and the self-employed. If you are an employee in an organization and earn additional money on a self-employed basis, you may have to pay both as an employee and self-employed.
Class 1 contributions are paid by the employee and the employer on employee earnings in stepped stages between two amounts. These contributions are not the same. The contributions further depend on whether the employee is contracted out or into the government SERPS (State Earning Related Pension Scheme). Where there is an occupational pension most employees will be contracted out.
Again this calculation has to be done on each pay day.
Self-employed people pay two contributions. In 2000–2001, these were Class 2, a fixed amount of £2, and Class 4, equal to 7% of taxable income between £4385 and £27 820. This appears to be slightly more than an employee, but is based on taxable income whereas the employee’s is based on total income. Note that if you are self-employed you will not be eligible for all the same state benefits as an employee.
VAT
The VAT payment (standard rate is 17.5%, but can be 5% or 0%) appears initially to be more simple. You first keep records of all the VAT you pay on items and services purchased – it normally appears as a separate amount. Secondly you keep a note of all the VAT you charge your customer. You pay the government the difference if you charge more than you paid, or collect a refund if you pay more than you charge. This has to be done quarterly unless you are a very small business.
The difficulty is that you may not be registered for VAT. Nonregistration is a choice you make if your turnover is below £52 000, note this is turnover – not profit. You may also be zero rated or exempt in certain dealings. In non-registration and exempt cases, no VAT is charged and you cannot claim back any VAT paid.
As this demonstrates, calculation of income tax, National Insurance and VAT can be complex. There are penalties attached for late payment, avoiding payment or supplying false information – hence the need to employ a good accountant.
Payment can also be collected and passed on for items such as:
In addition, the organization has to keep tabs on all incoming money, including any VAT paid with the account, money owed to them from their customers or suppliers (i.e. by credit notes), and any grants or subsidies due from central or local government.
The control of customers’ credit is especially important to ensure that money is received for products despatched or services rendered. There are several credit reference agencies which you can use to check out the credit worthiness of potential customers. Remember that this needs to be periodically rechecked to ensure that the credit rating remains in force.
The wait for payment can be quite long. Your invoice may state a maximum period but it is common for this to be exceeded, sometimes by months. This is a common reason for small companies to have cash flow problems. The government has attempted to reduce these delays and has passed a law limiting the amount of credit taken by late payment. However, if you are a small business with a lot of your income coming from another business, you are in a weak position to force matters. You may lose future orders.
It is possible to factor out the receivable accounts, i.e. get another organization to do the actual collection. You will then receive money due quickly from the agent, but at a cost. The factoring agent will charge a fee – usually up to 2.5% of total turnover.
If you are dealing directly with the general public and offer credit terms, you need to follow the conditions laid down in the Consumer Credit Act 1974. This includes being licensed under credit control regulations.
This means that the organization has to keep careful notes of all collections and payments as they become liable for any mistakes made. Therefore the organization has to know all the regulations and laws involved so that no penalties are incurred, this is where the real knowledge of the accountant proves valuable.
In order to keep tabs on the money flow, the use of accounting software makes it easy to ensure that all transactions are recorded, an easy audit trail is made and end-of-year summaries such as profit and loss accounts and balance sheets are readily compiled. Figure 1.1.1 shows show screen layouts from a PC accounts system for small companies.
Problems 1.1.1
(1) We are mostly members of a family. So are we members of a legal partnership in this case?
(2) Do you consider it fair that a company can go bankrupt through management paying themselves excessive salaries with no comeback against their property?
(3) What new business do you feel may succeed in your local town?
(4) Do you think that registering for VAT as a small business, and charging customers this extra, puts you at a disadvantage compared to another business not being registered and not charging?
(5) As practice for operating accounts in a small business, try keeping a detailed record of personal income and spending over a three-month period.
1.2 Structures and links
In small organizations, people often tackle a wide variety of tasks. As the organization grows, people tend to deal with a limited number of the available tasks. This leads to problems in communications and focusing which organizational structures attempt to deal with. Links and relationships now extend from inside the organization outwards towards its suppliers and customers.
Internal structures
When organizations start, they have very few people – often only one, the owner. This means that this person (people) has to do every job that arises. However, as organizations grow, the volume of work also grows. It is natural then that people stop doing just any of the many tasks that arise and start to concentrate on doing only a selection of the tasks, i.e. a division of labour takes place.
This division of labour is important to the efficiency of the organization as it enables employees to become skilled in doing a limited number of tasks through continual repetition, i.e. they undergo a learning curve. They then have the opportunity and motivation to seek ways to become more knowledgeable in these tasks so that they can perform them to a higher level and hence become more useful to the organization. Sometimes it may be so they can become more secure in their jobs, or even gain more influence within the organization.
As the organization continues to grow, the work for these individuals increases; individuals become sections and then departments within the organization. People are then employed with a deeper level of knowledge and experience in these particular areas. This, unfortunately, also means that individuals have a smaller overall breadth of knowledge about all the jobs being done within the organization.
These departments tend to fall into recognizable functional areas. However, just as people grow up differently, so does each organization. A department in one organization therefore often does not cover exactly the same detailed functions as a similar named department in another organization.
We are going to examine the typical functions, i.e. jobs that need to be done within any organization. Most organizations start with two basic functions:
From within these grows a multitude of other functions:
The list will continually grow and diversify as the organization increases in size. There is a disadvantage in too much specialization as it creates problems of communication and ensuring that everyone is moving in the same direction. Large organizations therefore require the integration of management to:
Each organization finds different structures to link these together. This is partially determined by the industry and their market, and partially by the characteristics and competencies of their staff as they are growing. If we look at an organization’s environment, as in Figure 1.2.1, we see that there is a multitude of influences and constraints on how they operate.
This also has an effect on the growth and composition of their internal structures as they form interfaces with the outside world.
Historically the only organizations that were large enough to have separate functions within them were governments and armed forces. When other organizations became large enough to support internal specialization, they tended therefore to imitate those models available. This gave rise to the concept of line and staff posts (see Figure 1.2.2), where line personnel are directly in the chain of command and staff personnel are in an advisory position.
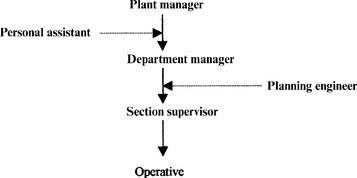
Figure 1.2.2 Line and staff relationships. (Line relationships are indicated by the full lines and staff relationships by dotted lines)
The first stage in internal structuring arises with the change from anyone doing any job to people having set jobs.
As the organization grows then the number of people performing similar duties grows. If this is only two or three they may be still part of the overall team. Once numbers grow it becomes difficult for the remainder of the overall team to communicate with each person and usually one person becomes the communication focus and a specific section is formed. With continual growth this focus becomes that person’s main role and you now have a section leader, or supervisor. This role then has responsibility for the productivity and quality of the section.
If the number in the section continues to grow, then the span of control may become too much for one person. You are then left with a choice:
• Do you form two/three separate sections, splitting the duties between these sections? or
• Do you retain the section as a whole under the present leader/supervisor, but with others put in a similar, but junior role reporting to the leader/supervisor? The latter would then be classified as a manager.
Your choice is to increase the number of different junctions or to add levels of management. However, there probably will not be too much difference eventually as you may have to have someone co-ordinating the several separate sections!
In this way as the organization grows, the levels of management and their span of control change. Two problems tend to arise in this situation:
• The sections become specialized and lose focus on the organization’s overall objectives.
• Top management become increasingly distanced from the detail of the day-to-day operations.
This has led to most organization’s changing their internal structure to try to keep direction and focus. Some organizations appear to be continually changing their internal structures – perhaps on the basis that by pure chance, the ideal must be hit on sometimes. Many centuries back, a Roman general was reported to have complained that the reaction to any problem is to reorganize.
The various structures that can be seen are:
• Entrepreneurial as in Figure 1.2.3.

Figure 1.2.3 Entrepreneurial organizational structure. (The Chief Executive is at the centre of all decision making)
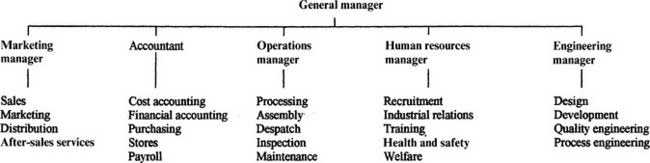
• Functional as in Figure 1.2.4: The actual make-up of the functions will be dependent on the importance of different tasks. For example, the purchasing function may be under accounts in one organization, but under operations in another. The former may give better financial management, the latter better ties to production schedules.
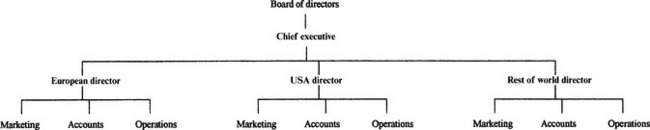
• Regional as in Figure 1.2.5: Here the lower levels could be a mixture of any of the other structures. In sales, it is often a lower level copy of the main structure.
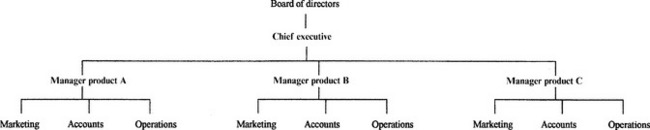
• Product as in Figure 1.2.6: This is common where products are diverse and focus is required at product level.
• Business sub-units: Each smaller unit is an organization by itself with its own internal structure. Very common in conglomerates.
• Matrix as in Figure 1.2.7: Here there are several main different focuses at work. Can create problems when each focal point is under conflicting pressure from the different axis.
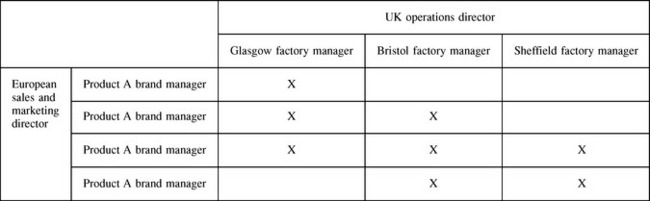
Figure 1.2.7 Matrix organization. (The factory managers have to satisfy the requirements of the competing brand managers. Where problems arise they may have to go to discussion between the UK operations director and the European sales and marketing director)
• Centralization: Here the centre attempts to control certain aspects.
• Decentralization: Here the centre plays a specialized role. This is normally financial, but could include research and development activities.
There is no universal panacea that an organization can just impose on an existing structure. Any change must be well thought through and tested, and needs very careful management during implementation.
The problems in communication and different viewpoints that tend to develop with specialization by functions have led many organizations back to reforming project teams for various tasks with members coming from the different functions. In effect they are reforming the entrepreneurial structure.
This leads to three advantages:
• Communications and feedback are quick.
• People in close working relationships tend to be more prepared to listen to the differing viewpoints of others and adjust their own stance.
This has led to substantial cuts in project times and tends to produce results which are both effective and more acceptable to the people involved.
Supplier relationships
In many modern manufacturing industries, the manufacturer of the final product is just an assembler of bought-in components and assemblies. In these companies, the cost of the bought-in items can often be more than 50% of the direct cost of the products.
This means that purchasing cannot be thought of just as a cost. It must be managed in a way that maximizes its potential to contribute towards profit. This means sourcing the best suppliers that fit into the organization’s operational demand of cost, time, and quality (see Chapter 6 Section 4, for a discussion on order-winning criteria and competitive analysis).
In addition there are many recent adoptions within organizations of ISO 9000 quality registration and changes in material procurement to a JIT (just-in-time) system that increase the need to have high quality suppliers delivering error-free items direct into the production process.
The objective of the JIT methodology is to operate with a minimum of internal stock. This means that the factory makes only what is required for immediate delivery and only brings in materials and components required for immediate use by the process lines. This incoming material needs to be of high quality and adherence to delivery times is very important.
It used to be sufficient to have incoming goods retained in a reception area and then to have inspection carry out either 100% inspection or apply an acceptance sampling scheme to batches of incoming material and reject batches that exceeded a set number of defects. Nowadays, this method cannot cope with the stockless operations with their tight time schedules and high quality demands. The most important process of ensuring one has suitable material available as and when is to carry out a complete assessment of all suppliers’ abilities to supply the correct material.
Vendor assessment
This assessment can be an initial stage prior to investigatory visits to suppliers to examine their processing facilities and audit their quality procedures. When examining suppliers, one should take into account all the factors which are of importance to the company, namely:
• QUALITY, i.e. the level of rejected batches.
• PRICE per item, relative to other suppliers.
• DELIVERY, i.e. deliveries made on time.
• SERVICE, i.e. amount of back-up and flexibility demonstrated.
Vendor assessment is a simple rating of different suppliers against each other under headings so that their overall value to the company can be assessed. It is a matter of selecting the particular factors, such as these above, which are considered important and applying a weighting to them in relation to their agreed impact on the company.
An organization may decide on the following weightings out of 100 points available. They can compare each supplier against these factors:
| • Maximum points for QUALITY | = 40 |
| • Maximum points for PRICE | = 25 |
| • Maximum points for DELIVERY | = 20 |
| • Maximum points for SERVICE | = 15 |
If a supplier has the following profile:
• 90% of his deliveries are made on time.
• Their price is 105p per item against the cheapest quote of 90p.
• 95% of their delivered batches are accepted on inspection.
This supplier would be rated as:
![]()
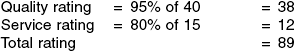
We then can compare this supplier’s total rating against all other suppliers for the same material or components to decide on which better serves our needs. It can also be used in conjunction with selected suppliers to show where their total service is behind their competitors to drive up the general rating of all suppliers combined. We wish to end up with a few high value suppliers.
Vetted suppliers
Once suppliers have been selected to be the main, or sole, supplier and we are convinced that the quality of their supply consistently meets our requirements, it should be possible to reduce the need to inspect their incoming goods.
It will still be necessary to monitor their quality which can be partially from occasional quality audits and partially from records of their material/components service within the plant and in service with our customers. To ensure that this can take place it is important to ensure that full traceability of all materials used is possible and maintained.
When examining a potential supplier, the areas which should be examined are:
Management
The supply chain
As in Figure 1.2.8, there is a complete supply chain from the basic, or primary industries, through to the ultimate consumer through which we can see material progressing and changing shape. A few companies are vertically integrated and own parts of their supply chain, but this is rare.
Every organization supplying services or products exists within a mixture of different supply chains as in Figure 1.2.9. Some of these chains will be of great importance to the organization; others will be less so. The organization should identify which chains are important, and then fully engage with them to gain the maximum advantage for themselves.
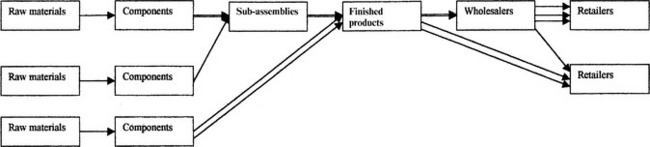
Figure 1.2.9 Mixture of supply chains. (Where multiple arrows are shown there can be several different supplier-customers involved)
Today the supply chain for many products is worldwide and organizations’ destinies are becoming more interwoven and interdependent in an international setting. The earthquake in Kobe, Japan, in 1999, for example, caused shortages in components for organizations throughout the world.
In 1961, a model demonstrating the effect of a change in demand rippling back through the supply chain was demonstrated by J. M. Forrester in Industrial Dynamics. This showed that the further upstream, i.e. away from the end user, the higher the fluctuations in demand experienced.
To show the effect of a change in demand of 10% from the end customer on the subsequent participants in the supply chain, a simple example of the flow of orders and products is shown in Table 1.2.1. The rules in the table are:
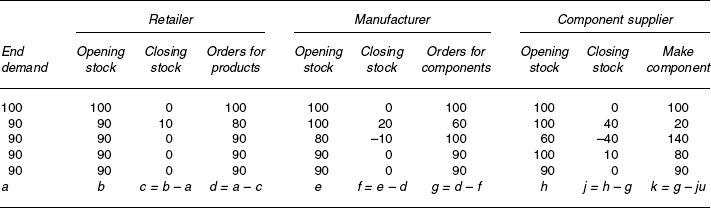
Each point in the chain aims to have at each period-beginning, a stock equal to the orders received during the previous period.
• Orders passed on to the next stage in the supply chain are based on a sufficient quantity to bring the closing stock up to the desired opening stock quantity for the next period.
• Orders are placed at the end of a period and are instantaneously delivered so that the items are available in the opening stock for sale in the next period.
• Stock shortages are allowed and taken off the quantity delivered.
The first period shows a stable market, therefore opening stock for each stage is set at 100 units. As 100 units are sold, the closing stock drops to zero and an order is placed for 100 units at each stage.
In the second period, the end sales reduce by 10 units to 90 units. The retailer therefore resets his stock target to 90 units (same as orders received). Order quantity then becomes 90 − 10 (closing stock), i.e. 80 units.
The manufacturer receives an order for 80 units and therefore has a closing stock of 20 units left from the opening stock of 100 units. As the new opening stock is 80 the order placed for components is 60 units, i.e. 80 − 20 (closing stock).
The component supplier receives the order for 60 units which leaves them with a closing stock of 40. They reset their opening stock to 60 (as sales) and therefore make only 20 units.
In the next period, as we can see from Table 1.2.1, both the manufacturer and the component supplier have a stock-out, shown as a minus figure in the closing stock. This means they would have to make special arrangements (i.e. incur extra costs) to quickly make these.
As can be seen in Figure 1.2.10, a change is doubled at each stage initially. Thereafter the further up the supply chain the more severe the fluctuations become before settling down as the effect of the change is dampened after four periods.
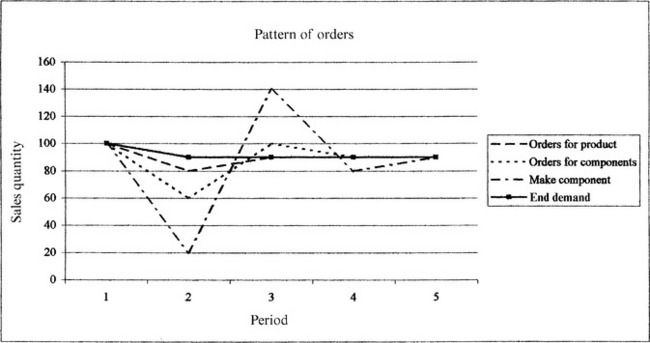
As all markets have fluctuations, continual small changes in end demand will tend to send constant ripples through the whole supply chain, forcing the lower level suppliers to continually vary their manufacturing orders much more radically than the actual changes in the end demand.
In order to level out these disturbances large amounts of safety stocks are installed to buffer the effect and ensure no stock-outs arise. This means a large amount of safety stock at all points in the chain:
• Retailers would hold stock in case the manufacturers failed to deliver sufficient products.
• The manufacturer would hold stock of the end product in case the retailer suddenly requested more than normal and at the same time would hold stocks of raw materials and components in case their supplier failed to meet their orders.
• The component supplier, of course, would also hold stocks of components and raw materials in case the manufacturer suddenly increased their order.
The advent of EDI (see Chapter 7) has meant that organizations can share data not only within themselves but with partners along the chain, i.e. customers and suppliers. It is possible to have point of sales information collated in a computer and then relayed to all points in the supply chain as in Figure 1.2.11. This means that only replacement items need to be produced so that any changes in the sales pattern are immediately catered for.
Eliyahu Goldratt discusses the handling of this integration in his book It’s not luck. In his latest book Necessary But Not Sufficient he in fact goes one step further in advocating that all supply chain members only get paid when the final sale is made.
It is natural that supplier and customer follow on to their developed relationships in trading together over factors such as quantities and delivery time, to other aspects such as developing products and services together.
Manufacturers of bought-in components will have a wealth of experience in making their own products. For their customer to ask them to make an item to an imposed design may not produce the best component in terms of function, quality or cost.
In the same way as cross discipline teams are formed within organizations, it is easy to apply the same concept between organizations to develop a rapid response and design functionally effective products and processes at a minimum cost whilst protecting profits in both organizations.
This does require openness and trust between organizations. As their long-term future will be tied up together, a lack of fairness and honesty in the setting up of a relationship will leave both open to future difficulties.
An example of trust between organizations is the on-site stock of a supplier’s materials that is only charged for when it is withdrawn for use by the customer. This was initially set up in spare parts for maintenance, but has now spread to low value items which are used in manufacture, such as bolts and screws.
Problems 1.2.1
(1) Think about a hockey team. Is it important that each player fulfils a set role? Should there be occasions when they can step outside that role?
(2) Think about the last group project you were involved with – did everyone carry out the same task? Why not?
(3) If you were asked to investigate a supplier, how would you persuade them to allow you to closely examine their operations?
(4) How easy would it be to make the consumer demand available to everyone in the chain, when there are many suppliers serving many intermediates in the chain?
(5) What problems do you see in Goldratt’s proposition of all supply chain members getting paid only when the final sale is made?
1.3 Improving the organization’s performance
All organizations need to be continually improving themselves, especially when they are exposed to keen competition in their markets. To achieve this is no easy task and this section looks at two methodologies that exist which attempt to integrate all aspects of an organization towards it becoming fully effective. It also examines the modification to ISO 9004 introducing Quality Management Principles.
As the twentieth century ended, many organizations were being subjected to tremendous pressures due to the international nature of many markets. During the 1990s organizations had been through a process of ensuring that high quality products and services were delivered to the customer through techniques such as continuous improvement, company-wide quality and total qality management. These have now become so ingrained in organizational culture that it is difficult to demonstrate their uniqueness, except when they are missing.
What was required during the twentieth century were management approaches which integrated all functions and aspects of the organization towards its key result areas. We are going to examine three of these:
Business Excellence Awards
The history of Excellence Awards
These awards started as part of the national quality initiative in Japan in the 1950s with the Deming Prize, and spread to the USA with the Malcolm Balridge National Quality Award in 1988. Europe followed suit in 1992 with the European Quality Award.
In the UK, the British Quality Foundation (BQF) introduced the British Quality Award (BQA) using the Business Excellence model which has since been adapted as the framework for most countries within Europe and is also used for regional awards within the UK.
Although the original criteria of these awards was biased towards design and manufacturing quality aspects, the models have expanded to include all aspects of a business and hence the BQA award has been renamed the EFQM (European Foundation for Quality Management) Excellence Model. It was revised to its present format in 1999.
The Business Excellence Model
The model comprises nine criteria covering all aspects of the organization. It can be applied to the organization as a whole, or to parts of it. The criteria are grouped into two sectors as in Figure 1.3.1. The first sector is concerned with inputs and contains five enablers. The second sector is concerned with criteria outputs and contains the remaining four results criteria.
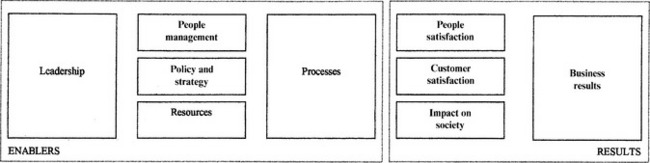
Figure 1.3.1 The Business Excellence Model. Reproduced courtesy of the European Foundation for Quality and Management
The organization is assessed under each criterion and given a score for that criterion. The individual criterion scores are then summated, using weighting indicating the criterion’s contribution, to give an overall score for the organization. The individual criterion score and the overall score can then be used to determine the organization’s present standing using a process of comparison, i.e. benchmarking, against known organizations. These exemplar organizations can come from various business sectors, not just the sector in which the organization is active.
More importantly, the assessment process highlights key areas that can then be improved to increase the organization’s all-round effectiveness. If assessments are carried out over time they also indicate any trend that is happening to judge the result of action taken.
We will examine the enabler criteria first and then see what the results criteria are and how the enablers contribute towards the performance in the result criteria.
The enabler criteria
These are the criteria in which the organization’s performance should be reflected in the results criteria.
Leadership. A key area as the leaders drive all the other process by their behaviour, communicating purpose through relevant systems and motivating staff.
Purpose: How the leader develops visions and values and forms a role model:
• Defines mission and desired results.
• Sets and reinforces an ethical culture.
• Gathers feedback on impact of style and amends behaviour.
External contacts:
• Involved in partnership and community projects.
• Works with customers and authorities to determine their needs.
Behaviour:
Policy and strategy. Looks at how the organization develops implements and reviews its policy and strategy.
Establishing needs: Here we are looking at what data is used to establish needs and expectations of all possible stakeholders:
Develop and review process:
• Match to short- and long-term objectives of organization and partners.
• Balance between the various stakeholders.
• Assumptions made, risks identified and contingency plans.
Deployment:
Communications:
People management. This looks at how the staff are developed and motivated to effectively perform towards the business goals.Planning:
• Is there a manpower plan prepared on the basis of a business plan?
• Are there clear career development plans?
• Is training need analysis used to develop training and development programmes?
Participation:
• What decisions are people empowered to do themselves?
• How are staff encouraged to participate in continuous improvement?
Communication:
Rewards:
• What tie into organizations objectives is there?
• Additional facilities, e.g. child-care, sports facilities.
Partnerships and resources. Here we look at how the organization adds to its results through effectively using partners and its available resources.External partners:
Finances:
• Review and development procedure.
• How are investments evaluated?
Buildings and equipment:
Technology:
Information:
• How is information collected and used?
• How are information systems linked to user’s needs?
Processes. If the people are to deliver the main objectives, the key processes must support them in their roles in satisfying customers and other stakeholders.
• Are there measures of capability and output?
• Are appropriate standards applied, e.g. ISO 9000 and ISO 14000?
Innovation:
• Is there identification of potential improvements?
• Number and degree of changes.
Design:
Process:
• Match to customer and other stakeholders’ needs.
• Are some processes outsourced?
Customer relationships:
The results criteria
There are two areas of measures on the first three criteria – perception and performance indicators. On the fourth criterion, the performance results, the measures are outcomes and leading indicators.
Customer satisfaction. What the organization is doing in relation to the complete chain of its external customers. We must ensure that the measures used are of real importance to the customer.
Perception measures: Can be collected from surveys, interviews, trade analysts’ views, vendor assessments, and complaint records:
• Overall perception: Accessibility, flexibility, responsiveness and cooperation.
• Product/service: Functionality, specification range available, quality, value for money, reliability, design innovation, environmentally friendly.
• Pre-after-sales: Staff friendliness and competence, technical/sales advice and support, match to customer requirements, response time, problem solving, complaint procedure, product training, sales and customer literature and manuals.
• Future relationship: Intention to continue to trade/looking for other suppliers, willingness to recommend you to others.
Performance indicators: Many of these can be collated from internal data:
• Product/service performance: Defect/reject rate, complaints, returns, warranty claims, delivery delays.
• Design: Number of innovations, product life cycle, time to market, conversation/rejection of quotations into orders.
• Sales/after-sales: Number of complaints, speed of response, demands for information/training.
• Customer loyalty: Length of relationship, number/value of repeat orders, lost business/retention rate, value of order per customer.
• Customer recommendation: Prizes, award nominations, trade press coverage.
People satisfaction. Here we are looking at how the organization’s actions are perceived by their own staff:Perception measures: Taken from surveys, focus groups, interviews and staff appraisals:
• Motivating factors: Career development and opportunities, communication, involvement, empowerment, equal opportunities, leadership issues, recognition for achievement, target setting and appraisal, learning and training opportunities, commitment to organization, sharing organization goals.
• Satisfaction measures: Condition, pay and benefits, job security, change management, health and safety, peer relationships, administration.
Performance indicators: Again most of these can be collated from internal data:
• Employee achievement: Competency gap, productivity, number of training initiatives, training uptake and completion, post-training evaluation.
• Evidence of participation: Suggestion scheme responses, involvement in improvement teams, recognition of individual/teams, response to employee surveys.
• Satisfaction indicators: Absenteeism, sickness levels, accidents, turnover, recruitment response, number of grievances, use of welfare and social facilities.
• Administration: Accuracy in data held, response time to queries, health and safety audits, environment audits, community projects.
Society satisfaction. What the organization is doing in relation to the local, national and international communities – especially in environmental matters and with authorities which affect or regulate its business:Perception measures: Taken from surveys, newspaper reports, public meetings, dealing with local/national authorities:
• Corporate citizenship: Disclosure of relevant information, equal opportunity practice, impact on local economy, ethical behaviour, relationship with authorities.
• Supporting local community: Schools and colleges, hospitals, community projects, voluntary work, sport and leisure facilities, medical and welfare provision.
• Nuisances: Noise, smell, sound, traffic, pollution, health risks and general safety.
• Environment: Product recyclability, waste produced and collection efficiency, usage of utilities, material usage, use of resources, power requirements.
Performance indicators:
• Handling of changes in employment levels.
• Usage of formal environmental systems.
• Relationships with planning authorities.
• Staff involvement with voluntary and other local activities.
Key performance results. These are the normal business measures which organizations use to denote their performance:Performance outcomes:
• Financial: Profit and loss, margins, sales, share price, dividends, borrowing, return on capital/assets, cash flow.
• Non-financial: Market share, volume, size of orders, time to market, quotation conversions, product launch date achievement.
Performance indicators:
• Process: Performance/productivity, defect rate, innovations and improvements, cycle times, time to market, late orders, delivery times, project completion rates.
• Suppliers: Prices, quality, performance, late deliveries, joint initiatives
• Financial: Cash flow, working capital requirements, returns on investments made, bad debts, inventory turns, maintenance costs, debtor ratios, creditor ratios, asset utilization, credit ratings.
The assessment process
The EFQM model can be used in different ways to assess an organization’s performance and give pointers for improvement. The initial assessment is normally carried in a self-assessment mode. Ultimately the organization can carry out the detailed award style assessment itself, or it may wish to be formally assessed by external, independent assessors appointed by the BQF.
Initially assessment can be by a series of questionnaires and workshops to determine how an organization’s management determines its performance on the criteria. Figure 1.3.2 demonstrates the BQC Business Improvement Matrix used as a broad-based questionnaire to gauge performance on each criterion.
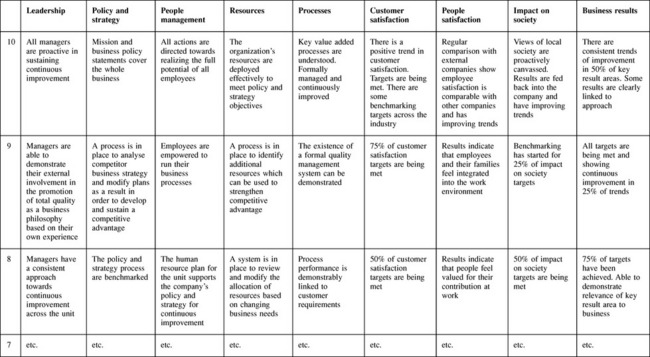
Figure 1.3.2 BQC Business Improvement Matrix. Reproduced courtesy of the European Foundation for Quality and Management
When we come to the detailed award style assessment, we can examine each criterion as a whole, or break it down into its component parts, for assessment. We then use the criterion scores arrived at, and apply their weightings to build up an overall score for the organization. The score can be expressed as a percentage or out of a maximum of 1000 points.
When assessing the enabler criteria, we award each sub-criteria a RADAR card score as shown in Figure 1.3.3, based on the degree of hard evidence available for:
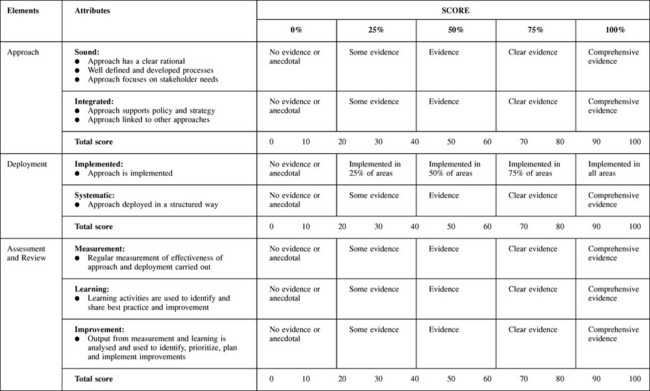
Figure 1.3.3 Scoring enablers against elements and attributes under RADAR. Reproduced courtesy of the European Foundation for Quality and Management
• Approach taken: Is it sound and integrated?
• Deployment within the organization: Is the approach fully implemented in a systematic way?
• Assessment and review: Is the effectiveness regularly measured, and improvements sought?
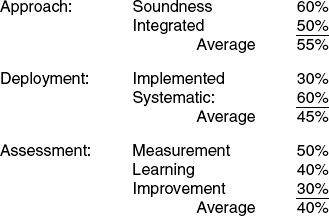
People management overall average of (55% + 45% + 40%)/3 = 47%.
The weighting in the overall score for the people management criterion is 9% or 90 points, therefore the people criterion contribution to the overall score is (9% × 47%) = 4.2%, or 42 points.
When assessing the results criteria, the RADAR card score (see Figure 1.3.4) is determined by:
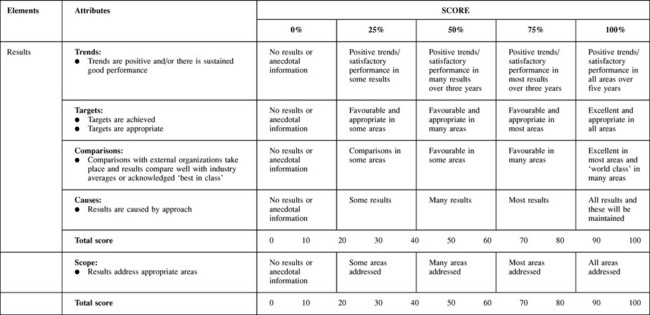
Figure 1.3.4 Scoring results against elements and attributes under RADAR. Reproduced courtesy of the European Foundation for Quality and Management
• Trends: Positive and sustained.
• Targets: Appropriate and achieved.
• Comparisons: i.e. bench-markings against averages and best in class organizations.
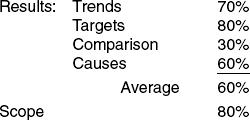
People satisfaction overall average of
The weighting in the overall score for the people satisfaction criterion is 9% or 90 points, therefore the people results criterion contribution to the overall score is (9% × 70%) = 6.3%, or 63 points.
The results for the individual criterion are then summated to give an overall organization score as shown in Table 1.3.2. In the table, the points are awarded out of a total of 1000 overall.
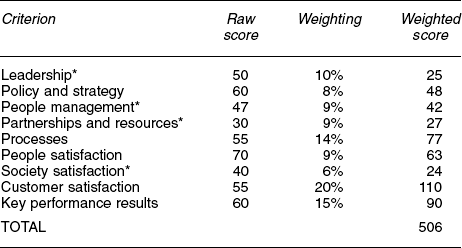
Although an overall score of 506 out of a possible 1000 indicates that there is room for improvement, it is still a reasonable score as even the recognized ‘best’ organizations seldom achieve more than 700 points.
The areas highlighted for improvement are those indicated by an asterisk (*) which are below industry averages.
The Balanced Scorecard
This is a method developed by Robert S. Kaplan and David P. Norton of the Harvard Business School in the 1990s. Its key approach is to ensure all decisions are made on how they contribute towards the main aims of the organization.
The Balanced Scorecard (BSC) has four perspectives tied together (see Figure 1.3.5). These can be common across an organization, but more usually differ within different areas.

• Financial: ROI; value added; profitability; revenue growth and mix; cost reduction; time to pay invoices; risk reduction.
• Customer: Market share; new customers; retaining customers; customer profitability; customer satisfaction.
• Process: Innovations; operations; post-sales – from identifying needs to satisfying them.
• Learning and growth: Employee satisfaction; employee retention; employee productivity.
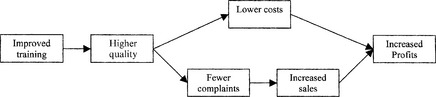
These perspectives enable the organization to identify how each links together to meet strategic aims using a cause-and-effect relationship as shown in Figure 1.3.6. It identifies the performance drivers that will produce the desired outcomes – e.g. on-time deliveries producing customer loyalty, in turn giving profitability.
Financial perspective
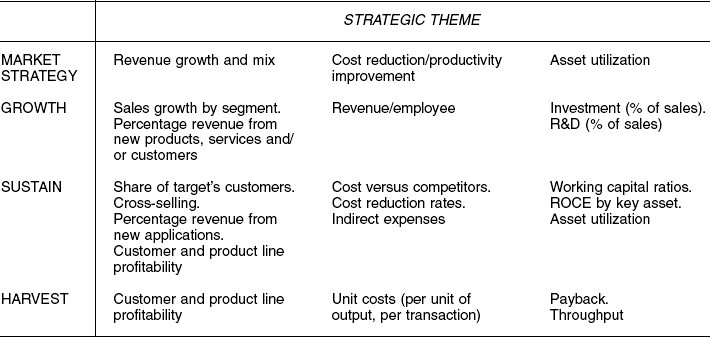
Businesses, or products, can be in various stages of the market life cycle, each of which calls for differing strategies as shown in Table 1.3.3.
In addition, organizations are interested in reducing risk and variability which may guide strategy by broadening markets served.
Customer perspective
Market segmentation. Customers are different and value different product characteristics. Some want low cost, others high value. Matching each segment calls for different strategies.Core measurement:
• Market share: Proportion of business in a given market.
• Customer acquisition: rate of attracting new customers.
• Customer retention: Rate of retaining ongoing relationships.
• Customer satisfaction: Level on specific performance measures.
• Customer profitability: Net profit after allowing for unique expenses required for that customer group (see Table 1.3.4 for strategies).
Measuring customer value propositions:
Internal business process perspective
The internal value chain covers the three principal processes of innovation, processing and post-sales.
Innovation: Important both in short and long product life because it determines the future value creation and even sets the basic costs involved, as these are designed in.
These are achieved by:
• Performing basic research to develop radically new products.
• Performing applied research to exploit existing technology.
• Focusing development to bring new products to the marketplace.
Measures are:
• Percentage of sales from new products.
• Percentage of sales from proprietary products.
• New product introduction versus competitors and plan.
• Manufacturing capability improvements.
• Time to develop next generation.
• Numbers passing through each process stage.
Learning and growth perspective
Employee capabilities: Changes in IT mean that employees no longer need to perform limited work and in fact the organization requires that they deliver ideas for improvement. This requires both reskilling and attitude changes.
Core measurement used to be only:
But now broadens to include:
• Matching of personal goals to company objectives.
• Continuous improvement (half-life – time to reduce defects/errors by half).
Reskilling scenarios:
IT capabilities: Employee skills alone may be insufficient to deliver necessary improvements. They will probably need additional IT systems to give timely and accurate information. This will include expert systems, databases and CAL to quickly bring themselves up to speed on new processes and products.
Linking BSC measures to strategy
Cause-and-effect relationships are the key (see Figure 1.3.7). The BSC shows up the cause-and-effect relationships between outcome measures and performance drivers. Every measure should be an element of this chain.
Outcomes and performance drivers: Outcomes tend to be lagging indicators of performance. Performance drivers are the leading indicators that will deliver the value propositions to customers. BSC requires both and they form the cause-and-effect relationships which can be tested during operations.
Linkage to financials: BSC retains a strong connection to financial outcomes. Each area will have 15 to 25 mixed financial and non-financial measures, grouped into the four perspectives.
BSC can be used by individual SBU to create its own BSC to meet corporate objectives depending on their own circumstances and markets. For example, the various units can be in different growth scenarios or against different aggressiveness in competitors. These can reflect common corporate themes such as safety, environment and innovation. They can also follow mandatory instructions such as cross-selling, sharing technology or using central sources, e.g. group purchasing.
Joint ventures: With the difficulty of serving more than one master, the selection of BSC within the joint venture can create a common purpose that all partners can subscribe to.
Support departments: Corporate staff should contribute added value to their internal customers to give a competitive advantage. Where they do not then their function should either be assumed by the operating department or outsourced to more competitive and responsive suppliers.
Barriers: The barriers to achieving the connections between strategy formulation and implementation are:
• Visions and strategies that are not actionable – no consensus.
• Strategies not linked to departmental, team or individual goals.
• Strategies not linked to long- and short-term resource allocation.
Any strategy, such as BSC, must have top-level management involvement and support, as it is a change to the entire management process, not just measurement.
Many measures only reflect what all companies should be doing – the BSC should throw up unique strategies, targeted customers and critical internal processes and development.
Quality Management Principles in ISO 9004:2000
The ISO 9000:1994 Series on Quality Systems has been augmented by modifying the ISO 9004 standard to include the following Quality Management Principles.
Quality Management Principles
A quality management principle is a comprehensive and fundamental rule or belief, for leading and operating an organization, aimed at continually improving performance over the long term by focusing on customers while addressing the needs of all other stakeholders.
Principle 1 – Customer-focused organization
Organizations depend on their customers and therefore should understand current and future customer needs, meet customer requirements and strive to exceed customer expectations.
Leaders establish unity of purpose and direction of the organization. They should create and maintain the internal environment in which people can become fully involved in achieving the organization’s objectives.
Principle 3 – Involvement of people
People at all levels are the essence of an organization and their full involvement enables their abilities to be used for the organization’s benefit.
Principle 4 – Process approach
A desired result is achieved more efficiently when related resources and activities are managed as a process.
Principle 5 – System approach to management
Identifying, understanding and managing a system of interrelated processes for a given objective improves the organization’s effectiveness and efficiency.
Principle 6 – Continual improvement
Continual improvement should be a permanent objective of the organization.
Principle 7 – Factual approach to decision making
Effective decisions are based on the analysis of data and information.
Principle 8 – Mutually beneficial supplier relationships
An organization and its suppliers are interdependent, and a mutually beneficial relationship enhances the ability of both to create value.
It is possible to see this modification as a move towards the EFQM model with traces of the Balanced Scorecard.
Problems 1.3.1
(1) Do you agree with the 50/50 split into enablers and results in the EFQM model?
(2) What do you think is the most important aspect that affects you as an employee, or student, in your organization?
(3) What factors would you use to measure how your present organization performs against its customers’, or students’, expectations?
(4) What would you say was your present organization’s staff attitude to their organization?
(5) Looking at the financial outcomes, what benchmarks would you use to judge how well your organization is performing?
1.4 Business and society
This section looks at the reasoning behind codes of conduct and the changes in legislation caused by changes in the general public’s perception of what constitutes ethical behaviour by organizations. It looks briefly at health and safety before concluding with environmental policy guidelines.
Codes of conduct
Throughout history society has had rules of conduct for its members. Some of these rules have developed into laws, and some have remained desired norms of conduct rather than laws. There are even actions which are considered wrong in one circumstance and right in another, or perhaps legally wrong but morally right by some members of the public.
Most people would rate lying as being against the general rules of conduct, but no country has yet drafted a law against lying per se. There are, however, laws which cover redressing wrongs arising out of some particular types of lies:
• Perjury, i.e. false evidence.
• Reputations, i.e. slander and libel.
• Contracts under the Trades Description Act and the Misrepresentation Act.
In business, it is easy to determine which actions are illegal, but not so easy to define those which are not ethical. Laws and ethics overlap to some extent, but they should not be thought of as the same – especially when considered on an international basis.
Quite often laws lag behind public perceptions on ethical issues. In addition special interest groups may have their own reasons for launching action, e.g. human rights activists, environmental activists and animal rights activists. In some cases the law may offer a degree of protection and avenues for recovering damage, but public opinion may be persuaded otherwise. This can affect trading or the value of shares.
Historically a business has been thought of as having only one aim -to make money for the owners – and has tended to ignore ethical matters except where they impinged on this duty. They have been accused of almost using a definition of anything that is not illegal, is legal and therefore can be carried out.
Society does not take that view today, and looks for businesses having an ethical dimension. Where businesses do not self-regulate, they find that governments, influenced by pressure groups, are laying down constraints within which organizations must work.
It is therefore in the organization’s own interest that it produces its own code of conduct in many issues. The Code of Conduct (see Figure 1.4.1) of the Institute of Management is a good starting point for any organization.
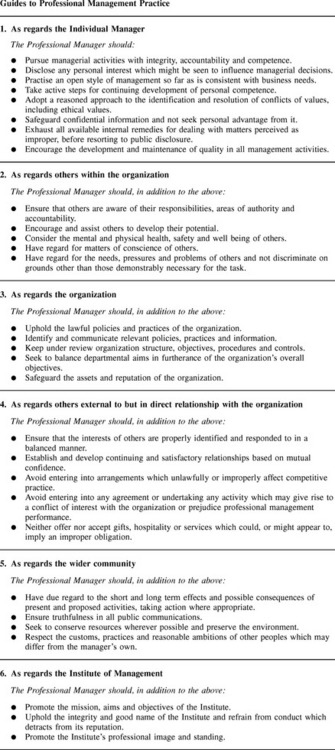
Figure 1.4.1 Institute of Management’s Code of Conduct (reproduced with permission from the Institute of Management)
As you can see the Code covers a wide area, some of which can be linked into legislation and other codes, e.g. the Equal Opportunity Commission’s model for an Equal Opportunity Policy (see page 68) and the Investor in People (IIP) initiative (see page 78). However, that still leaves areas which are not set by laws and may appear difficult to fully determine what action to take.
One problem is that codes of conduct, and laws to a degree, are not the same throughout the world. This means that an organization has to be careful when dealing with people from different cultures.
Ethics
Debates on ethics and moral rights have been going on throughout history. In ancient Greece philosophers such as Aristotle and Plato attempted to define the ideal of virtue and citizenship which many subscribe to still. Yet in their society slave owning was the acceptable norm and women had no rights.
Is there a universal code that can be followed to guide organizations when considering ethical dilemmas? Unfortunately there is not, but we shall examine several codes which may give guidance.
Immannuel Kant (1724–1804) put forward a theory stating that there are three main criteria which should be used to determine the ethical approach:
• Reversibility, i.e. what if someone did it to you?
The problem arises when you have to deal with someone with blatant egoism, i.e. self-interest, who believes in being free to do as he/she pleases. In the short term at least, this type of person often wins but organizations that allow this action to foster set up their own conflicts and often the individual’s self-interest may not coincide with the interest of the organization.
Kant’s criteria are similar to the Four-way Test adopted by the Rotary movement which states that in all business transactions the following questions should be asked:
All these appear to be a little theoretical and idealistic in values. Can this be put into more businesslike terms?
Ronald Green in The Ethical Manager introduces the concept of stakeholders into the equation. He suggests the following sequence:
• Define your self-interest and the interest for other directly involved parties.
• Identify other stakeholders, i.e. others who may be affected, and the minimum rights and duties involved.
• Determine the best outcome for the interested parties only.
• Test that outcome against the other stakeholders’ interests.
• Where conflicts arise determine if the strategic outcome outweighs the morale consequences.
• Where conflict is unresolved attempt to find another outcome more equitable to the direct parties and the other stakeholders.
At the end of the day, you may still be left with an outcome you wish to proceed with and that you feel is in your self-interest but against other stakeholders, although you should have amassed an argument in your favour. However, remember that being legally right does not protect you from public disquiet and attacks from those whose interests you have gone against. The ‘fat cats’ arguments of the 1990s regarding directors’ pay and bonuses are an example of the media attention that you may be subjected to.
Constant disregard of public disquiet by organizations has led over the years to changes in the laws of the UK and other countries.
Trends in laws
Due to changes in public acceptance of various practices, governments during the twentieth century have introduced a series of laws and regulations constraining the freedom of organizations to act as they see fit.
Contract law
The historic position was caveat emptor – let the buyer beware.
This led to unethical behaviour on the part of some organizations where the buyers were not in a position of power, nor had the necessary skills or knowledge, to fully take up their right to examine the contract or the product before buying.
This led to changes to protect the weaker parties such as the Sale and Supply of Goods Act 1994, the Unfair Contracts Act 1977, the Consumer Protection Act 1987 and Unsolicited Goods and Services Acts 1971 and 1975. These are dealt with in Chapter 3.
There are other acts which limit the action of organizations to operate cartels, unfair competition and restrictive practices. There are even laws which protect the interests of minority shareholders in companies.
It is expected that the EC will introduce Europe-wide legislation which will further constrain organizations.
Labour law
In Chapter 2 on human resource management we continually address legislation concerning employment and employee rights that were enacted in the last quarter of the twentieth century. This period has seen changes in legislation that have weakened the trade union organizations, but at the same time have increased individual’s rights and benefits.
The latest of these is the Public Interest Disclosure Act 1998. This gives protection to employees engaged in whistle blowing, i.e. making public information where:
• A criminal offence has been committed, is being committed or is likely to be committed.
• A person has failed, is failing or is likely to fail to comply with any legal obligation to which he is subject.
• A miscarriage of justice has occurred, is occurring or is likely to occur.
• The health or safety of any individual has been, is being or is likely to be endangered.
• The environment has been, is being or is likely to be damaged, or
• Information tending to show any matter falling within any one of the preceding paragraphs has been, is being or is likely to be deliberately concealed.
This means that an employee can make public any illegal action taken by an organization. The problem that can arise is in the grey areas where the general public may consider that although a certain action is legal it is unethical, e.g. the use of child labour by one of your suppliers.
The report from the Nolan Committee clearly states that an organization requires to formulate a procedure for handling this.
Health and safety
There are a multitude of acts controlling the workplace. These apply to offices and factories (see also Chapter 3). The EC has even introduced working conditions which previously came under labour law in the UK, e.g. the Working Time Directive, under the heading of Health and Safety.
The Health and Safety at Work Act 1974 is the main one concerning safety and is rigorously imposed. This Act lays down a general duty on everyone at work – including the self-employed – that is backed by criminal liability. This duty is owed to employees, sub-contractors, customers and other non-employees on site and the general public who may be affected by anything we do.
The duty is ‘To ensure, so far as is reasonably practical, that the process, article or substance is so designed and managed as to be safe and without risk to health when properly used, stored and transported.’ Improper use is further defined as ‘without regard to any relevant information’.
Specific duties laid down are:
• To carry out any necessary testing and examination.
• To provide adequate information for the process operation or the article’s use.
• To ensure that any necessary research is carried out to eliminate, or minimize, any risk to health or safety.
Internally this means that organizations have to take positive steps to protect their employees and the public in general from the risk of injury from a multitude of potential hazards. In 1992, the following specific sets of regulations came into force:
• Management of Health and Safety at Work Regulations: Identify hazards and assess risks to eliminate or control them to an acceptable level.
• Workplace Health, Safety and Welfare Regulations: Lighting, heating, washing and sanitary facilities, traffic, glazing, etc.
• Provision and Use of Work Equipment Regulations: Work equipment must be safe, including use, maintenance and instructions.
• Personal Protective Equipment at Work Regulations: Personal protective clothing selection, use and maintenance.
• Manual Handling Operations Regulations: Avoid heavy handling but, if required, assess the risk.
• Health and Safety (Display Screen Equipment) Regulations: Use of computer workstations, including screen, desk, chair, keyboard, etc. and general environment. Establish eye care programme.
Formal risk assessment checks must be carried out, where risk refers to the likelihood that a harm will arise and the severity of its occurrence:
• Identify all hazards, i.e. the potential to do harm: Noise, dust, electricity, hazardous material, sharp edges, fire/explosion, tripping, handling, vehicle movement, moving machinery, storage, cranes and lifting equipment, etc.
• Identify everyone who could be harmed by these hazards.
• Evaluate risks arising and decide if they can be eliminated (preferred) or reduced with adequate precautions installed.
HAZOP (hazard and operability) studies involve examining all operational plant and processes to determine the possibility of hazards arising and designing procedures to eliminate them, reduce the possibility of them occurring or to reduce the possibility of harm arising to employees or the environment.
There has been a code of practice issued by the Health and Safety Commission covering the Act (1974) and the subsequent regulations. Whereas this has no legal status, if not observed, it would weaken your position in any court proceedings. This code covers:
Health and safety management arrangements
Health surveillance of employees and the general public
Procedures for serious and imminent danger and for danger areas
Co-operation and co-ordination of shared sites
Action on all of these has all to be recorded if you have more than five employees. The health and safety aspects are growing and breaches can have severe consequences such as:
• An order not to use a machine, or process.
• Criminal charges which could lead to a fine, or in extreme cases imprisonment.
You are advised to consult the Health and Safety Commission or the Health and Safety Executive whose inspectors may visit you at any time unannounced.
Environmental management
Nowadays environment aspects are becoming more important to an organization as governments continually expand the legislation dealing with this matter. For example, the following are active in the UK:
Health and Safety at Work Act 1974
Control of Industrial Major Accident Hazard (CIMAH) Regulations
Control of Substances Hazardous to Health (COSHH) 1988
Control of Industrial Air Pollution Regulations 1989
Town and Country Planning Act 1990
Environmental Information Regulations 1992
Council Regulation (EEC) No. 1838/93
Control of Major Accident Hazards Regulations (COMAH) 1995
Landfill Tax – in the Finance Act 1996
Producer Responsibility Obligations (Packaging Waste) Regulations 1997
Integrated Pollution Prevention and Control, EC Directive 96/61
At present the EC and national governments are in discussion with industry with the aim of structuring legislation and setting targets for the recycling of products which, if enacted, will have considerable further impact. It is necessary that an organization carries out an immediate environmental impact assessment and if there is an environmental impact envisaged takes action to reduce or minimize it.
In the UK and the EC, there are four key principles that govern the approach to environmental protection:
• Prevention: Priority should be given to anticipating and preventing environmental harm. This includes worst case scenarios and contingency planning.
• Precaution: Here the concept is to minimize possible regrets, i.e. err on the pessimistic side, when considering possible harm. This has fuelled the debate on genetically modified foodstuff.
• Polluter-pays principle: The producer of any environmental damage has to meet the financial cost of that damage. This has led to problems when the present owner of land that has been contaminated is not the contaminator.
• Integration: Care should be taken that improvements in one area do not lead to reductions in another.
Benefits
There is often a business case to be made for an organization that is concerned with the environment but is unable to have an effect thereon. The case considers:
• Cost savings: Through reduced raw materials, reduced energy used, reduced transport and disposal cost, reduced risk of litigation and lower insurance.
• Marketing benefits: Improved public image, safeguards existing market and offers new opportunities in environmental products.
• Benefits for customer: Increased confidence, competitive pricing, better value, less risk.
• Benefits for employees: Improved working conditions, improvement to health and enhanced personal commitment.
• Benefits to environment: Reductions in raw material extraction, emissions, waste, odours, noise, energy use and the impact on the ecosystem.
Organizations can be registered under various schemes such as BS 7750, ISO 14001 and the EC’s Eco-Management and Audit Scheme (EMAS) – see Figure 1.4.2 for a comparison table between these. They all follow similar stages.
Environment review
The initial review requires top-level commitment through the formation of a team whose task will be to:
• Determine any significant impact on the environment.
• Identify any breaches of existing, or proposed, legislation.
• Quantify the emissions, discharges and wastes presently arising.
A useful initial step is to demonstrate the sources of waste using a process flow diagram (as in Figure 1.4.3) then calculate out a mass balancing calculation (see Figure 1.4.4.), quantifying complaints and summating disposal costs.
Figure 1.4.3 Flow process chart. (GG43 Environmental Management Systems in Foundries. Crown Copyright is reproduced with the permission of the Controller of Her Majesty’s Stationery office)
Figure 1.4.4 Mass balance calculation. (Input − output = losses. All units must be in same value, e.g. weight). (GG43 Environmental Management Systems in Foundries. Crown Copyright is reproduced with the permission of the Controller of Her Majesty’s Stationery office)
Detailed data gathering
The first stage is to gather information on all materials, processes and controls, and appropriate legislation, including present authorizations and complaints. Then it is a matter of carrying out a site survey and measuring all waste and effluent flows:
• Site: Main processes; site history; major incidents; warnings or prosecutions; complaints.
• Utilities: Where used and consumption of steam, water, electricity, gas, oil, etc.
• Raw materials: Amount used, where stored and the storage medium.
• Aqueous effluent: Description, source, quantity, treatment, disposal method.
• Emissions to atmosphere: Description, source, quantity, treatment, disposal.
• Solid waste: Description, source, quantity, treatment, storage, disposal.
Assessing significance
Matrices are available to assess the environment effect of the processes under both operating (Figure 1.4.5) and other conditions (Figure 1.4.6). The process can score a maximum of 30 points under each of normal operations conditions and possible variations aspects giving an overall maximum of 60. The higher the score, the more impact on the environment. These also can be used to prioritize the processes to be tackled – the higher the score the more significant the effect.
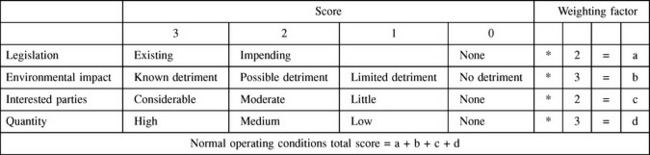
Figure 1.4.5 Matrix to score environmental effects under normal operating conditions. (GG43 Environmental Management Systems in Foundries. Crown Copyright is reproduced with the permission of the Controller of Her Majesty’s Stationery office)
Figure 1.4.6 Matrix to score environmental effects under other operating conditions. (GG43 Environmental Management Systems in Foundries. Crown Copyright is reproduced with the permission of the Controller of Her Majesty’s Stationery office)
Thereafter processes similar to FTA and FMEA should be carried out to determine root causes and preventative measures that can be taken.
Environment policy
Following onto the environment review, a policy should be drawn up listing the organization’s environmental objectives, staff responsibilities and their targets for improvement. An environment management manual listing all the above and associated procedures needs to be drawn up.
The procedures should be subjected to audit at set intervals, a minimum of once each year. Any report of non-compliance should conclude with the action to be taken.
A validated environmental statement is required to be produced and made available to the public under the EMAS scheme.
Certification and/or validation
Under BS 7750 and ISO 14001 an independent certifier certifies the Environmental Management System. Under EMAS an environmental verifier carries out a similar process of accreditation. Being certified to BS 7750 normally suffices for EMAS, but some slight additional work may be required if the certification is under ISO 14001.
The process starts with a report from a desk-top study and is concluded by a site visit by the certifier/verifier.
Problems 1.4.1
(1) Look at the code for your profession and compare it with that for the Institute of Management. Do you see any major omissions in either?
(2) Your company employs over 200 people. It is in severe difficulties and will go out of business if new orders are not gained. You are involved in sales negotiations when it becomes clear that you will win an order that will save the jobs of your employees, if you pay a substantial bribe to the buyer’s main negotiator. What do you do?
(3) Look up details of the Pinto small car made in the USA in the 1970s and comment on Ford’s cost-benefit analysis regarding the fault discovered before its launch.
(4) Who do you think should pay to clean up if an organization owns land that was polluted by another organization which has gone out of business?
(5) Do you think it is ever ethical for an organization to bind its employees in a non-disclosure contract?