
Risk Cost Analysis

Learning Objectives
By the end of this chapter, you will be able to:
• Apply the fundamental risk formula of R = P × I to an actual risk situation.
• Define risk cost analysis, contingency allowance and reserve, and risk premium.
• Identify whether a given risk has a high or low degree of variation and apply the appropriate strategy in preparing to manage it.
• Conduct a risk cost analysis and extrapolate the effect of different risk outcomes, using concepts of standard deviation, secondary risk, residual risk, and black swan events.
• Apply exclusion, capping, and reinsurance as strategies for managing black swan risk and extreme risk fluctuations.
Estimated timing for this chapter:
| Reading | 1 hour |
| Exercises | 1 hour |
| Review Questions | 10 minutes |
| Total Time | 2 hours 10 minutes |
INTRODUCTION TO COST RISK ANALYSIS
The last chapter covered basic concepts in probability and statistics, the foundation for classical risk analysis. Statistics allows you to analyze large amounts of existing data and identify pattern. Probability gives you a glimpse into the uncertainties of the future. It is hard to overestimate the impact of classical risk analysis and risk management in the development of our modern economy. Classical risk analysis provides a rational process for taking—or avoiding—risks.
Risk and cost analysis were joined together at birth. It’s hard to imagine a modern economic civilization without the ability to quantify and price risk. Insurance, for example, is risk management in action. So is safety engineering, as the Titanic designers unwittingly demonstrated.
Risk historian Peter Bernstein is emphatic: “Without a command of probability theory and other instruments of risk management, engineers could never have designed the great bridges that span our widest rivers, homes would still be heated by fireplaces or parlor stoves, electric power utilities would not exist, polio would still be maiming children, no airplanes would fly, and space travel would just be a dream. Without insurance in its many varieties, the death of the breadwinner would reduce young families to starvation or charity, even more people would be denied health care, and only the wealthiest could afford to own a home.” (Bernstein, 63-73)
CLASSICAL RISK
To decide what, if anything, should be done about a given risk, you have to figure out what the risk is worth. As we’ve learned, the fundamental formula is R = P × I: the value of a risk is the probability of its occurrence times the impact if it does occur. When the probability is known and the impact can be quantified financially, valuing a risk is rather straightforward: if there’s a 10% chance of losing $10,000, the value of the risk is $1,000. If the cost of doing away with the risk is less than $1,000, there’s a presumption that this would be a good investment. (Your mileage, as we’ll see, may vary.)
In our gambling thought experiments (and assuming honest dice), we were able to calculate odds and payoffs well enough to estimate the likely return on our playing investment. Classical risk analysis emphasizes the statistical and probability mechanics of large numbers.
As we’ve noted, real life isn’t always cooperative when it comes to providing good data. While we may sometimes know the potential impact of a risk quite precisely (if our new product fails, we will lose the money we have invested in it), in real life measuring its probability (how likely is it that our new product will be a hit?) is not so simple.
We could look at rates of general market acceptance of new products; we could look at our own history of new product introduction; we could look at indicators of economic growth; we could compile consumer survey data; we could look at the quality of our product and marketing plans. All this information could help us develop an estimate of probability. The resulting number might be useful, but it’s hardly solid. We don’t—we can’t—know until the market renders its verdict.
Even worse, if it’s a project we haven’t done before, we may not have any historical data on which to base an estimate in the first place. In addition, there’s unquantifiable uncertainty, the “unknown unknowns,” made famous by former Secretary of Defense Donald Rumsfeld. There are indeed things that we do not know that we do not know. Of course, that’s not nearly the same thing as being helpless to do anything about it.
RISK COST ANALYSIS
For our purposes, risk cost analysis is the process of analyzing the range of potential costs and benefits of particular risks, and using the analysis to calculate a value for that risk. The purpose of risk cost analysis is twofold: to incorporate risk-related costs into estimates and budgets, and to evaluate the financial impact of various strategies to accept or mitigate them. In short, to cost analyze a risk, we have to understand it, decide how much it’s worth, and compare that to the cost of doing something about it. Risk cost analysis doesn’t automatically turn into a decision, but it’s important input.
This discipline has elements of both science and art. The science part consists of the mathematical tools we’ve been studying. The art part is deciding how much weight to give various factors in reaching your decision. If you’re doing the risk cost analysis, it doesn’t automatically mean you’ll be making (or even recommending) the decision; that may belong to someone above you in the organization.
Let’s learn how it’s done. In this chapter, we’ll deconstruct the steps in a risk cost analysis using the tools of classical risk management.
Insurance as a Model for Risk Cost Analysis
In the same way that gambling serves as a useful model to illustrate basic probability, insurance provides a model for the process of risk cost analysis. No matter what your field or what kind of risk you need to analyze, you’ll apply some of the same principles and concepts that an insurance company would use to set its premiums.
We think of insurance as a specific category of financial product, but in a broader sense, insurance describes any money we spend to insulate ourselves from some of the impact of experiencing a particular risk. If we buy insurance against a particular risk, we’re protecting ourselves against part of the impact of the risk—in this case, the financial impact. If we spend money on a safer car, we’re also protecting ourselves against the impact of an accident—this time literally; we are reducing the amount of damage suffered by the occupants of the car. If we spend money to send our children (or ourselves) to driver’s education classes, we are lowering the probability of an accident—which is why your insurance premiums are often lower if you have taken driver’s education classes.
We build insurance into many different kinds of financial transactions. For example, when you borrow money, the price of that money (the interest rate) includes a provision for the risk that you’ll default and not pay at all. If you’re seen as having excellent credit, the risk is lowered, and the interest rate normally reflects that. If, on the other hand, your credit scores are poor, the risk that you won’t pay back your loan increases, and so does your interest rate. You won’t see that number broken out as “insurance,” but in effect, that’s what it is.
Risk, remember, measures uncertainty. Most people with poor credit do in fact pay their bills, and even people with great credit sometimes don’t. The insurance part of your interest rate isn’t about you personally: it’s the law of large numbers. What is the expected default among people whose characteristics are similar to yours? If the pool you’re in has a higher default rate, you get assessed your share of the total risk, no matter how virtuous your own personal attitude toward your obligations.
If groups are not carefully and thoughtfully defined, you can make important mistakes. You may be looking at a secondary factor rather than the actual risk, or failing to see a root common cause.
Contingency Allowance and Contingency Reserve
In project management, an equivalent to insurance is often expressed as a contingency allowance, extra money (or extra time) to compensate for known risks. If the price of raw materials normally fluctuates within an expected range, you may pay more or less depending on what day you place the order. If neither the day you make the purchase nor the price you will have to pay are under your control, you need to build extra money into the cost estimate in case the price that day is on the high side of the expected range.
Some authorities distinguish between a contingency allowance and a contingency reserve, which is money or time set aside for unknown risks. If supplies of the needed material suddenly quadruple in price because a war has broken out where most of the stocks come from, that’s far outside the normal fluctuation. In practice, the terms are often used interchangeably.
Whether your organization distinguishes between the two types or not, it’s a valuable distinction for you to make. Many organizations resist providing a formal contingency allowance, fearing that it will become the project manager’s private slush fund. If you estimate materials costs using a number at the higher end of the normal range of fluctuation, however, it’s more likely to be perceived as a legitimate response to risk.
PRICING INSURANCE RISK
When it comes to insurance, both buyers and sellers have an interest in getting the numbers right. The cost of any insurance includes the following:
• The value of the risk itself (probability times impact)
• The cost of doing business (overhead, cost of marketing and sales, financing costs, salaries)
• The profit the insurer hopes to make
• The value of any investment income the insurer receives from its reserves of cash
Insurance companies each have their own ways of measuring and valuing their risks. There are different sets of data available and different ways to segment a population. One insurance company may be willing to accept more or less risk for itself, or to price more or less aggressively to win business.
If the insurer values the risk incorrectly, there are potential consequences to both parties. If the pricing of the risk is too high, you may go elsewhere for your insurance. If the price is too low, the insurer could end up unable to pay legitimate claims and even go out of business. This does neither the insurer nor the insured any favors.
The professional who prices the risk is known as an actuary, and the discipline of doing so is known as actuarial science. no matter what your discipline, if risk is part of your environment, knowing a little something about actuarial science is important.
Risk Premiums
Because the cost of the risk itself is only one element in establishing the price of insurance, someone who buys insurance always pays a risk premium. The risk premium is the difference between the price of the policy and the underlying value of the risk itself.
Depending on the seriousness of a given risk, it’s not inappropriate to pay a risk premium, but a good risk manager and cost analyst always wants to know how much that premium is going to be. A particular insurance policy may be a very good value, but you don’t know unless you check the loss ratio—how much the insurer pays out in claims for each dollar it takes in. If the loss ratio is too high, the insurer may not be healthy—but if it’s too low, you’re overpaying.
Insurance Risk with Low Variation
Let’s analyze the risk process and risk decision for an insurance company, using the data and assumptions in Exhibit 6-1. For now, we’re only concerned with the base value of the risk, not the additional costs or profit the insurance company will use in calculating the final premium charged to customers.
The accident figures in Exhibit 6-1 are per 100,000 policyholders. With one million policyholders, we expect ten times as many accidents. Our mean, therefore, changes to 1,000. The base value of the risk is the probability (1000/1,000,000) times the impact ($10,000), which works out to 0.1% × $10,000, or $10. To pay the cost of claims (1,000 × $10,000 = $10,000,000), that implies the insurer needs to collect $10 from each policyholder to pay for the risk it is assuming. The base value of the risk is therefore $10.
As Exhibit 6-1 shows (and as our understanding of probability would lead us to expect), the number of actual covered incidents varies each year. In some years, the insurer’s payouts will be higher than expected, and in some years lower. Random fluctuation suggests you may from time to time go through several years in a row with above average payouts.
If you’re the insurer, how do you manage this uncertainty? If it’s small enough, perhaps the ordinary cash flow of your business is enough to cover it. You may have other money you can draw on temporarily. This money may be capital, whether investor-furnished or retained from previous profits; it may be a line of credit, in which you draw money out or pay it down as a way of dampening out the effect of the fluctuation; or you may choose to change the price of the risk.
 xhibit 6-1
Assumptions for Insurance Case Study
Risky Business Insurance Company
| Policy Holders: | 1,000,000 |
| Payout: | $10,000 benefit for each covered occurrence |
| Actuarial Data: |
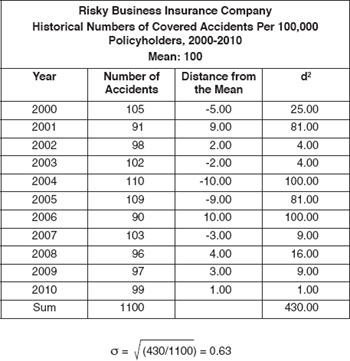
In our example, the standard deviation is very small: 0.63. The total range goes from 90 to 110 events per 100,000, which would affect your payout by a maximum of $100,000, which amounts to only 1% of the total pot. Still, you could easily have two or three down years in a row, meaning you’d have to pay out $300,000 more from your risk pool than you’re collecting in premiums.
Where will you get the money if that happens? If the variance is small related to the company (1% in this case), your cash flow may allow you to pay your claims with no problems. The larger the potential variance compared to your total revenue, the bigger a problem you have.
Insurance companies raise investment capital, obtain lines of credit, and keep reserves on hand. Some categories of insurance companies are regulated, meaning that they are required by law to meet certain conditions to ensure they can pay their claims. Other categories of insurance are not regulated, and the company’s leadership has to decide the desired balance between risk and prudence.
Insurance Risk with High Variation
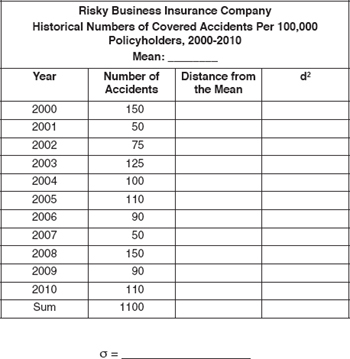
Now let’s imagine what would happen if the range were wider. Instead of a range of 90-110 accidents per 100,000 insured, let’s say we have a range of 50-150. In Exercise 6-1, you’ll refigure the base value of the risk based on changed assumptions. In Exercise 6-2, you’ll use that information to calculate the impact of the wider range on the company’s financial position.
 Exercise 6-1
Greater Accident Variation
Calculate the mean and standard deviation based on the changed data from Exhibit 6-1 as provided.
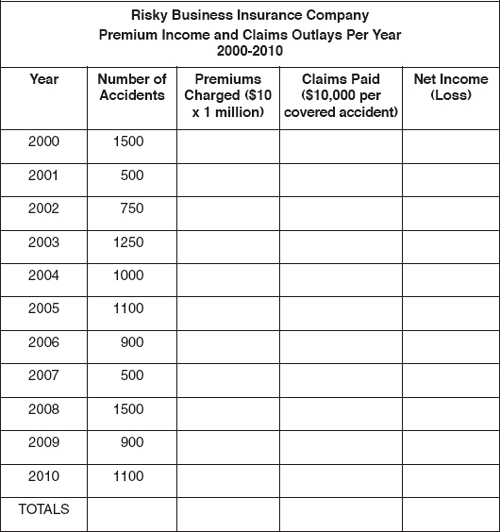
Premium Income and Claims Outlays
Calculate the net income or loss by comparing premiums charged by the insurance company to claims paid by the insurance company.
In doing these exercises, we notice the following. First, the mean (100) is unchanged from Exhibit 6-1, but in a bad year for accidents, the insurer could be on the hook for as much as $15,000,000, with only $10,000,000 in premiums to pay for it! A few years of losing $5,000,000/year could be seriously damaging to your financial health.
In planning for costs and risks, you have to account for this much higher degree of variation. Somehow, you have to make sure you have the cash on hand. You could use capital, either investors or retained profits. You could establish a line of credit. And, of course, you can increase the premium your policyholders need to pay.
Adding Standard Deviation to the Price of a Risk
When the potential range of outcomes is wide, risk managers can add safety margin to a project. The greatest safety would be to charge the maximum value of the risk. In this case, that would mean we use the highest number, 150 per 100,000, in the R = P × I equation. The value of the risk becomes (150/100,000) × $10,000, which reduces to 0.15% × $10,000, or $15.00. You should always be able to pay your bills, and usually make a healthy profit, but you may find your market share eroded by people whose risk premium is less steep than yours.
Alternately, you can use the standard deviation as a framework for determining an appropriate safety margin. As you found in the exercise, changing the range of accidents also increased the standard deviation fivefold, from 0.63 to 3.25.
As noted earlier, there’s about a 68% chance the real number of accidents will be no greater than 1σ above the mean and a 95% chance it will be no greater than 2σ. (Yes, the standard deviation is plus-or-minus, not just plus. In this case, we’re only interested in the higher side, because we can’t afford the risk of paying out an extra $5,000,000 in a bad year.)
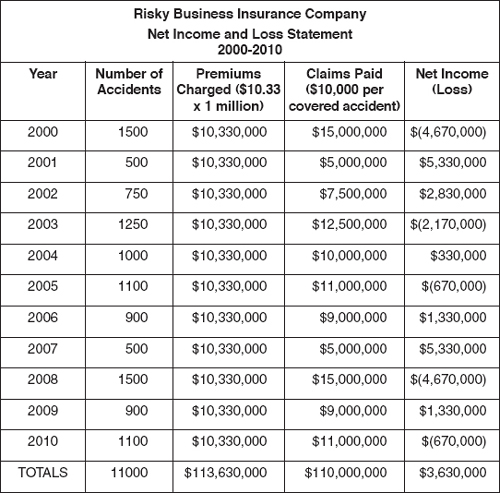
Let’s look at adding 1σ to the base value of the risk. This means you would now value the risk on 103.25 accidents per 100,000 rather than 100, and that changes your premium by 32.5¢. Rounding up, that means a premium of $10.33. That looks much better to the customer than $15. The question becomes, what happens to our expected outcomes?
Exhibit 6-2 updates the information you calculated in Exercise 6-2 showing the effect of the change in pricing. As you can see, this change in risk pricing adds $3.6 million to the bottom line over eleven years and reduces the net impact of bad years. You’re ahead six years out of eleven, and in two of the four losing years, the loss is less than 10%. This corresponds reasonably well to our theoretical value of 68% for 1σ.
Is that good enough? Well, you don’t necessarily have to stop at 1σ. If, say, human life were at stake, you might decide that safety considerations warranted adding margins of 2σ, 3σ, or even 6σ, until you decided that you had done everything appropriate for the specific situation.
Your choices are limited, of course, by the money you have or can get, or the nature and competitive demands of the marketplace in which you operate. To compensate, there’s the benefit you and customers might gain from higher degrees of safety. One size never fits all when it comes to deciding how much safety margin is appropriate. Risk cost analysis merely measures the amount it’s going to cost.
Additional Factors in Risk Decisions
So far, the risks we have discussed are primary risks. The primary risk is the risk that is the subject of our initial concern. What we choose to do about that risk may itself be risky. The risk in our proposed solution is called secondary risk. If we aren’t able to get rid of all the primary risk, what’s left over is known as residual risk.
Secondary Risks
A secondary risk is a risk that comes into existence as a result of your attempt to solve the original risk. The purpose of buying insurance is to transfer some portion of financial risk associated with an event to someone else. But what happens if the insurance company goes bankrupt? That’s a secondary risk, because the harm of the insurer going bankrupt only affects you if you bought insurance in the first place.
Here’s another secondary risk. The insurer, as we’ve mentioned, may invest some part of the pool of insurance premiums in the hope of making additional money. If the investments are successful, the company can lower prices to be more competitive or it can pocket the money as profit, or (often) some combination. On the other hand, if the insurance company loses money on those investments, the company has less money for claims and expenses, and may also be unable to meet its obligations. (This is why insurance companies often have regulatory restrictions on the type of investments they are allowed to make with their cash reserves.)
Like primary risks, secondary risks can be managed. If you’re shopping for insurance, you might look at an independent rating agency like A. M. Best for measures of the risk that an insurer might be at risk of bankruptcy. For the risk that an insurer might make poor investments, governments often regulate and restrict what insurers may invest in, and how much cash they must keep on hand to meet their obligations.
Sometimes, the proposed solution can be worse than the original risk. Unless you pay attention to the secondary risk of your proposed solution, you can make things worse.
Residual Risks
The residual risk is what’s left over after you have taken action on the primary risk. For example, many times when you buy insurance, you select a deductible. The deductible is the part of a covered event the insurer won’t pay for. Because the number of small accidents is often greater than the number of big accidents, the insurer is often willing to provide you with a discount for choosing a higher deductible, because they save money in two ways, by not paying (or paying less) for some events, and by avoiding the cost of processing the claim, which can be considerable.
If you have a deductible, it’s still insured—by you. You are retaining the residual risk. If you do nothing, all the risk is residual risk. If you are able to eliminate the risk altogether, you have no residual risk. Usually, you end up somewhere in between.
Black Swan Events
In Exhibit 6-2, we identified that the fewest number of accidents in any year was 50 in 100,000, and the greatest number of accidents in any year was 150 in 100,000. In 11 years of measurement, no value has gone outside that range—but that doesn’t mean it’s not possible. If there’s a “100 Year Event,” there’s a good chance it won’t appear at all in the records we have.
Imagine what would happen if in a given year, our hypothetical insurance company was confronted with not 150, but 1,500 accidents per 100,000? No one expects it; it’s highly improbable—but for all we know, it could happen. That’s known as a black swan event.
As it applies to risk, the term originates with financier-philosopher Nassim Nicholas Taleb in his book of the same name (Taleb, 2010), and refers to events that are high-impact, hard to predict, or rare. The term “black swan” goes back to the Roman poet Juvenal, referring to something that does not exist, because in the Western world, all known swans were white. In 1697, much to the surprise of European ornithologists, Dutch explorer Willem de Vlamingh discovered black swans in western Australia. From that point on, “black swan” no longer meant “impossible,” but suggested that perceived impossibility might turn out to be true.
One kind of black swan event, then, involves a flaw in our knowledge. Other black swan events involve things that are known to happen, but are extremely rare. There’s not much chance you’ll win the lottery, but it’s certain someone will.
A third category of black swan events include those that are completely unexpected, but were not considered impossible. On September 12, 2001, one of the authors of this book was scheduled to speak at a project management conference in Chicago. In the aftermath of the 9/11 attacks, there was of course no way the conference could go forward, at no doubt great expense to its organizers. Of course, no one in the management of that conference would have put “terrorist attack” on its list of risks to be managed, and even with 20-20 hindsight, no one would suggest that was somehow a failure to exercise due diligence. Unfortunately, that didn’t save them from the consequences. In planning for risk, you can’t afford to ignore the possibility of something completely upsetting all your assumptions.
Three basic strategies for managing black swan risks are exclusion, capping and reinsurance.
Excluding Risks
Under what circumstances would we see a tenfold increase in accidents? We might think of natural disasters, wars, or other circumstances that would dramatically change our risk landscape.
Because of the magnitude of such events, insurance companies often exclude them. Categories of exclusion often include natural disasters, terrorist attacks, or wars. In a legal sense, an “act of God” is something so overwhelming and uncontrollable that it excuses one or both parties from an obligation they otherwise would have to fulfill. In effect, the policyholder is now self-insuring that extreme risk, because he or she will have to pay the cost of loss personally.
Contract negotiation often involves substantial risk management because many important contract issues involve allocation of risks. What if the customer wants to change something in the statement of work? What if the product doesn’t perform as expected? What if unexpected problems crop up?
Capping Risks
Another strategy is capping risks. In the conditions of an insurance policy, the insurer agrees to pay $10,000 per covered event. Perhaps an individual policyholder’s losses are greater; perhaps they are less. Either way, however, the policyholder gets $10,000. By limiting the amount the policy is going to pay, the insurer caps its risk exposure on an individual claim. The policyholder, by definition, self-insures any excess risk.
If you ask an insurer for a $1 million policy rather than a $10,000 policy, the insurer may be unwilling to write the policy for fear of not being able to pay the potential losses. Instead, the insurer might accept the premium and share it with other investors, each assuming one piece of the risk (known as treaty insurance). If the insurer has to pay the claim, it will collect from all the other investors. (The originator of the treaty usually pockets an extra share of the money for the work involved in selling and managing the treaty.)
When you buy insurance, you’re also capping your risk. If you have a $500 deductible on your car insurance, you are capping your personal out-of-pocket costs at $500 per occurrence.
Reinsurance
Insurance companies almost always buy insurance themselves. The practice is known as reinsurance, and it’s a way to offset risk. Treaty insurance—offsetting your risk by bringing in additional insurers—is one kind of reinsurance.
Adding 1s to the value of the risk lowers the probability of negative years and the cost of negative years by a slight amount, and increases the probability that over time, the company’s profits will increase. That still may not be enough to cope with the potential loss of $4.7 million in a given year, and it’s definitely not enough to cope with a black swan event disaster.
Depending on our cash reserves and the cost of the reinsurance, we might offset some or all of that risk. For example, if we felt we could handle losses of up to $750,000 (a bit less than 8%) ourselves, we could buy reinsurance that paid the difference whenever claims in a given year exceeded $10,750,000.
What’s a fair risk price for the reinsurance? In Exercise 6-3, your job is to figure out the base price of the risk for the reinsurer.
Exercise 6-3
Pricing Risk
Use the estimates from the table to answer the questions.
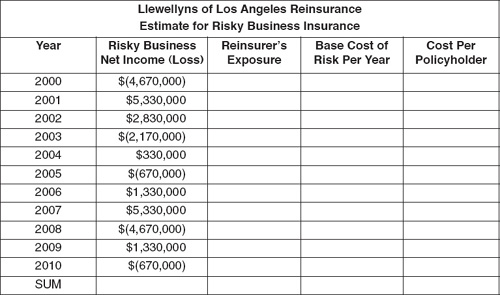
a. Reinsurer will pay the excess if total outlays for any given year exceed $10,750,000, with a maximum payout of $5,000,000 in any year. What will the reinsurer need to charge to cover the base value of the risk according to the information we have about the last 11 years?
b. What additional factors can you think of that the reinsurer would need to consider in establishing a fair value for the risk it is taking on?
1.
2.
3.
4.
5.
c. If we want a policy in which the reinsurer covered losses up to $10,000,000 rather than $5,000,000, how would you price the excess risk?
d. If the reinsurer’s overhead and sales costs equal 25% of the value of the risk, and the reinsurer has a profit target of 15%, how would you estimate the premium for the $5,000,000 and the $10,000,000 policies?
Recommended Risk Price
| Risky Business Insurance Company Premium Charge Worksheet | |
| Base Cost of Risk | $10.00 |
| 1σ of Base Risk | $0.33 |
| Cost of Reinsurance ($10 million cap) | $1.32 |
| Overhead (50%) | $5.83 |
| Sales Commissions (15%) | $1.75 |
| Profit Target (15%) | $1.75 |
| Cost of Policy | $20.97 |
Developing a Final Risk Price
The person doing the cost risk analysis has the responsibility for making a recommendation, but not necessarily for making the decision. The decision of what a risk is worth and what we should do about it are not automatically the same thing.
In Exhibit 6-3, let’s develop a recommended price for our insurance policy by rolling together the various considerations to date.
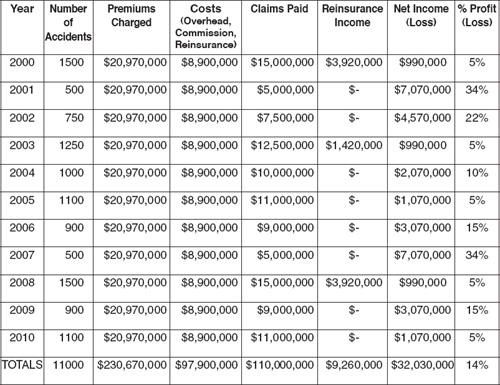
Exhibit 6-4 summarizes the effect of this policy cost on the company’s financial position.
Adjusting a Risk Price Based on Market Conditions
A cost of $20.97 keeps the insurer solvent enough to pay all the claims and provides an estimated profit of 14% over eleven years, very close to the 15% target. Here, the company stays profitable each year, but only because of the reinsurance.
As a customer, you should note that you are paying a markup of 110% of the base cost of the risk. The extra $10.97 is, as we noted, the risk premium. Whether that’s a good price for you depends on what the competition offers, how much the protection against a $10,000 loss is worth to you, and the effect of spending $20.97 on this when you could spend it on something else.
If market conditions don’t allow the insurer to charge $20.97, how can you manage the risk? First, look at controllable costs. Overhead in our current example costs 50% of the risk costs. If we can reduce our costs by 10%, the price of the insurance policy drops by 58¢ with no increase in financial risk and no impact on profitability. If we are willing to accept 10% profit rather than 15%, we save another 58¢, and so on. Interestingly, cutting the reinsurance maximum from $10 million to $5 million only saves a dime, so that may not be the best place to cut.
In any cost-related risk situation, the same considerations apply: what is the value of the risk and what is the cost of responding to the risk? When the cost of responding is less than the value of the risk itself, you have a powerful financial argument for acting on the risk. If it is the other way around, you have to consider whether other (noneconomic) factors justify paying the necessary risk premium.

To decide what, if anything, should be done about a given risk, you have to figure out what the risk is worth. The fundamental risk formula R = P × I provides the basis for a risk cost analysis.
While in the theoretical world of gambling, probability and impact are known, in real life you may not have full or accurate information. In addition, “unknown unknowns”—risks you don’t even know you have—can complicate the situation. Risk cost analysis is the process of analyzing the range of potential costs and benefits of particular risks, and using the analysis to calculate a value for that risk. The purpose of risk cost analysis is twofold: to incorporate risk-related costs into estimates and budgets, and to evaluate the financial impact of various strategies to accept or mitigate them.
Risk cost analysis often involves weighting different factors, including market conditions that determine whether costs can be passed through to you own customers. In the same way that gambling serves as a useful model to illustrate probability, insurance serves as a useful model for risk cost analysis. In a practical sense, insurance can be thought of as any money you spend to protect yourself against risk.
In project management, an equivalent to insurance is often expressed as a contingency allowance, extra money (or extra time) to compensate for known risks. A contingency reserve is extra money (or extra time) set aside for unknown risks.
Only by assessing a risk’s proper value can you evaluate the cost-effectiveness and appropriateness of different strategies and options for responding to it. If you value a risk too high or too low, there may be serious consequences to you and to your customers.
Because an insurer has costs, the charge for insurance is normally greater than the base cost of the underlying risk. The difference between the base cost and the charge is known as a risk premium. Depending on the seriousness of the risk and the amount of the premium, it may be a good investment—but not in every case.
When the expected variation is low, normal fluctuation in actual values is not serious. When the expected variation is subject to wild swings, you may require additional layers of protection against risk. You can absorb these swings if your financial condition permits. You can charge a higher premium to cover the risk. Adding one or two standard deviations to the base cost of the risk reduces the risk to the insurer.
In addition to primary risk, you may also need to account for secondary risk (new risks brought on by your proposed response to the primary risk) and residual risk (the risk left over after your proposed response). There are also black swan events, risk events that are high impact, hard to predict, or rare.
Three strategies for managing excess risk, whether black swan, secondary, or residual are:
• Exclusion. When you exclude a risk, you refuse responsibility for paying for it. Contract negotiation often involves deciding which risks are outside the contract or require renegotiation and additional payments.
• Capping. When you cap a risk, you identify a maximum amount you are willing or able to pay, and if the actual costs are greater, your responsibility stops at the maximum.
• Reinsurance. You can transfer certain of your risks to other entities so that your maximum payout obligation is limited.
The person doing the cost risk analysis has the responsibility for making a recommendation, but not necessarily for making the decision. The decision of what a risk is worth and what we should do about it are not automatically the same thing. Nevertheless, the decision needs to rest on a foundation of good data.
 Review Questions
1. The difference between the price charged for covering a risk and the base cost of the risk is known as a:
(a) risk premium.
(b) secondary risk.
(c) black swan risk.
(d) reinsurance risk.
1. (a)
2. If the standard deviation for occurrences of a particular risk is higher 2. (b) than the standard deviation for occurrences of a different risk, what conclusion can be fairly drawn?
(a) The first risk is more likely to happen.
(b) The range of the first risk has a greater variance.
(c) The second risk is less important.
(d) The second risk is more expensive to cover.
2. (b)
3. The difference between a contingency allowance and a contingency 3. (d) reserve is that the contingency allowance is a provision for:
(a) unknown risks
(b) residual risks.
(c) black swan risks.
(d) known risks.
3. (d)
4. If the secondary risk is greater than the primary risk, what should you do? 4. (c)
(a) Accept a greater amount of residual risk.
(b) Accept the secondary risk.
(c) Try to reduce the secondary risk to an acceptable level, and if you can’t, consider using a different strategy.
(d) Purchase reinsurance.
4. (c)
5. How does risk management apply to contract negotiation? 5. (c)
(a) The seller must accept risks of non-performance.
(b) The buyer must offer additional money to cover expected risks.
(c) Ownership of specific risk events may be allocated to buyer or seller.
(d) The contract requires purchase of insurance or reinsurance.