
Tools for Qualitative Risk Analysis

Learning Objectives
By the end of this chapter, you will be able to:
• Identify research needs and strategies for qualitative risk analysis.
• Implement qualitative risk analysis tools to define the level of current knowledge available to determine probability and impact, establish range scales for risk probability and impact, and define risk thresholds for different categories of risk.
• Establish a risk scoring system using either words or numbers, and rank risks according to either.
• Measure overall project risk for a project using three different techniques.
• Update risk register data showing disposition of all identified risks and prepare a risk information sheet for significant project risks.
Estimated timing for this chapter:
| Reading | 40 minutes |
| Exercises | 1 hour 40 minutes |
| Review Questions | 10 minutes |
| Total Time | 2 hours 30 minutes |
QUALITATIVE RISK ANALYSIS TOOLS
As you filter the risks using qualitative risk analysis, you need to establish a common set of terminology and process to ensure consistency and good results. In this chapter, we’ll go into additional depth about common qualitative risk analysis tools for assessing risk probability and impact.
A common thread through this process is the importance of research. Since our goal is to establish measurements of probability and impact, at least in rough terms, the obvious questions are (1) how do we figure out the probability and (2) how do we figure out the impact? The latter is often easier than the former. We may not know how likely it is that a machine will malfunction, but we do know the replacement cost if we have to put in a new one. At the same time, some aspects of impact are not so clear: damage to reputation, for example.
Where can you go to learn more about a given risk? depending on the risk, the possibilities are numerous, and include:
• Lessons learned files and historical data from previous projects
• Test and evaluation results
• Interviews with people who have knowledge or experience related to the risk
• User surveys and customer satisfaction data
• Industry data
• Scenario analysis or simulations
Of course, there’s often no end to how much investigation you can do, but there’s a definite limit to how much you should do. For the (hopefully) large percentage of risks classified as “probably accept” (low in some combination of probability and impact), all you need to do is to review them to see if there are any that deserve reclassification. Even when risks are important, you may already have all the information you need readily available. Save your maximum energy and effort for risks that are potentially very serious and not well understood.
 Think About It …
What specific sources of information can you think of that will help you learn more about the risks you have to manage on your projects?
ASSESSING PROBABILITY AND IMPACT
Because projects are notoriously “temporary and unique,” we often don’t have detailed information to help us judge the critical questions of how likely a given risk is, and how serious its consequences would be, should it occur. The information you have, of course, can change over time. That’s why research is so important.
You can’t always find out everything you ideally want to know, however, no matter how deep you’re willing to dig. That’s not necessarily a fatal problem when it comes to risk management. We can live with uncertainty. What we can’t afford is to get ahead of our actual knowledge and pretend to a level of certainty that just isn’t real.
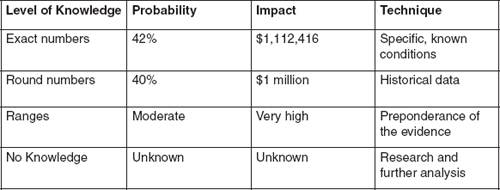
Exhibit 4-1 defines the different levels of information you may have about the probability and impact of a given risk at a given point in time. You will certainly learn more in the future. Through research and systematic analysis, you can often know more now.
It’s more common to have an exact figure for impact than probability, because many costs are known and fixed. Unless you’re dealing with a very small number of known possible outcomes (heads or tails, for example), probability estimates usually describe a range more than a single point.
Establishing Ranges
Project managers frequently use a range scale rather than numerical values because that more often reflects the honest level of knowledge available. To avoid confusion and misinterpretation (Is 40% “moderate”? Is $1 million “very high”?), make sure you establish and use standard terminology. Here are some considerations for establishing a scale for your risks.
 xhibit 4-1
Levels of Knowledge
1. How many levels in the range? Having more levels creates finer distinctions among risks. Do you have enough information to support those distinctions, and if so, will the extra levels help you prioritize risks more usefully? (Examples: Range of 1 (low) to 6 (very high); range of Low, Medium, and High.)
2. Midpoint, or high/low? When you use an odd number of levels, one level represents the middle—probability around the 50/50 point. When you use an even number of levels, risks have to be pushed into higher or lower categories because there’s no middle. (Examples: A range of 1–6 does not have a midpoint; Low/Medium/High does.)
3. Equal or skewed distribution? The most logical approach might be to divide the range equally. With four categories, each would represent 25% of the total probability. But that doesn’t always draw the best picture. If probability and impact are lopsided, a lopsided scale might be more useful. (Example of skewed distribution (Probability): Low = 1-25%, Medium = 25%-50%, High = over 50%. Skewed distribution (Impact): Minor = Under $1 million; Moderate = $1 million-$1.5 million; High = over $1.5 million.)
4. Numbers or words? numbers make it easier to calculate a risk score, but sometimes mislead people into thinking they’re more precise than they really are. You can create a probability grid using words, but words can also mislead because we hear the same words in different ways. In teaching risk management classes, we often ask people to say what number comes to mind when they hear the phrase “moderately probable.” Student answers have ranged from 18% to 87%. This means you should always define your terms.
Think About It …
Do you currently use a risk scale? How does it relate to the criteria above? How does it work in practice?
If you don’t currently have a risk scale, how would you apply these criteria to develop one?
Risk Thresholds
Risk can be both relative and absolute. Relatively speaking, it’s worse to lose $1 million than to lose $100,000. But if your affordable loss threshold is only $50,000, then in one fundamental sense, both risks are identical—that is to say, they’re both unacceptable.
A risk threshold is a maximum level you’re willing to suffer for a particular type of impact: financial risk (how much we’re willing to risk losing), safety (chance of physical harm to workers or users we’re willing to accept), legal liability (vulnerability to lawsuits or other accusations), image (risk that public perception will suffer), or career (chance that our personal advancement and job security will suffer). You may need additional risk thresholds for the specific risk categories that most affect your project or environment. If you’re in the nuclear power business, there’s a standard for allowable risk of radiation leakage (very low). If you’re in the airline business, there’s a threshold for acceptable flying weather.
Risk thresholds help the organization control its projects. If a risk violates a risk threshold in a particular category, it’s automatically on the list of risks that must be managed. If the risk can’t be reduced enough to fall safely below the threshold, it’s up to the organization—not the project manager—to decide whether the risk should be accepted, or whether the project should be modified or cancelled instead.
 Exercise 4-1
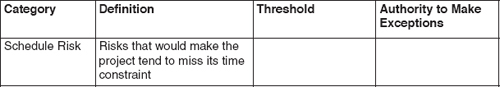
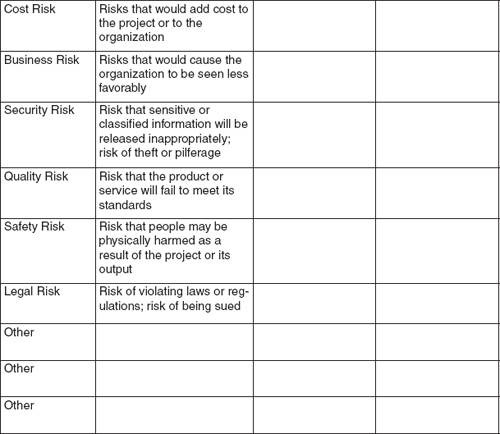
Establishing Risk Thresholds
For each of the following risk categories, develop a risk threshold appropriate for your organization and your projects. Who would have the authority to make any exceptions?
Your projects and your organization often have specialized risk thresholds. What additional categories would you consider adding, and how would you define them?
COMBINING PROBABILITY AND IMPACT
The risk formula, Risk = Probability × Impact (R = P × I), calculates the risk score, a measurement of the value of a risk.
If there’s a 40% chance of $1 million lost (or, for that matter, gained), the risk score is 40% of $1 million, or $400,000. If the risk is losing $1 million, the implication is that if you can get rid of the risk for less than $400,000, it’s probably wise.
If the risk is a 40% chance to gain $1 million, the same logic applies: if the opportunity costs less than $400,000, the numbers are in your favor. (The opposite is, of course, not necessarily true. Sometimes it’s wise to spend more than the raw value of the risk when other factors are at stake.)
When you move away from numbers, the risk score no longer provides a clear guide to how much money you should consider spending, but it still has value.
Calculating Risk Scores with Non-Numerical Information
The two ways to calculate risk scores without reasonably accurate probabilities or firm dollar amounts for impact are (1) using words and (2) using a numerical scale.
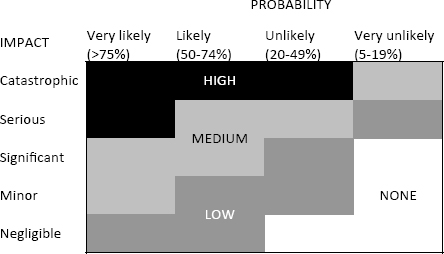
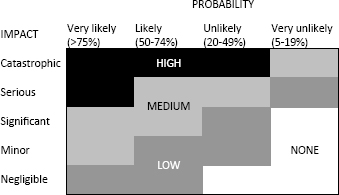
Exhibit 4-2 shows how to combine word descriptions of probability and impact into a matrix grid. The intersection of the probability and impact estimates tells you whether the risk should be considered high, medium, or low. You can, of course, use different words, more or fewer words, or different ranges for each word, depending on your preferences.
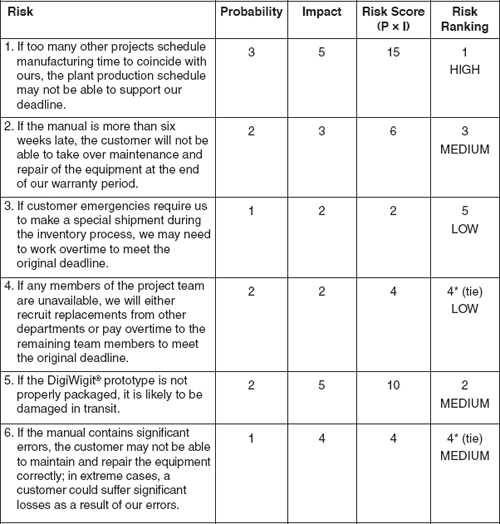
Exhibit 4-3 shows how to apply a numerical scale to create risk scores and rank risks. We’ve used a scale of 1-5 for both probability and impact, with higher numbers representing greater values. You can, of course, use more or fewer numbers in the scale, or weight the results differently.
Note that we rank risks two ways in Exhibit 4-3, by descending order of risk score (highest risk 1, second highest 2, and so forth), and separately by High, Medium, and Low. Both metrics have value; you aren’t restricted to a single way to look at risk severity.
xhibit 4-2
Risk Matrix
Rating Scale
Scale (Probability and Impact): 1 (lowest) to 5 (highest)
Risk Score: Probability × Impact = 1 (1 × 1, lowest) to 25 (5 × 5, highest)
High risks: scores of 3 to 5 in both probability and impact
Medium risks: scores of 3 to 5 in either probability or impact, but not both
Low risks: scores under 3 for both probability and impact
Risk Ranking: From highest risk score to lowest risk score
Ranking Risks
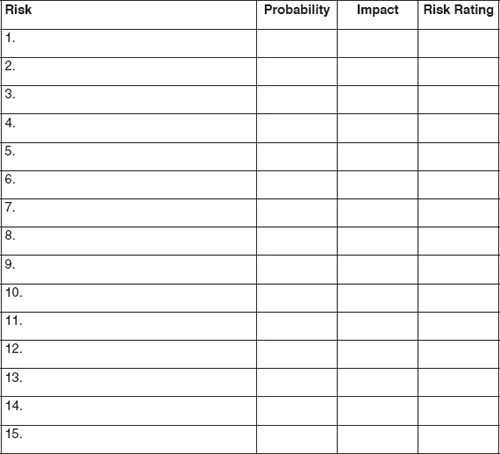
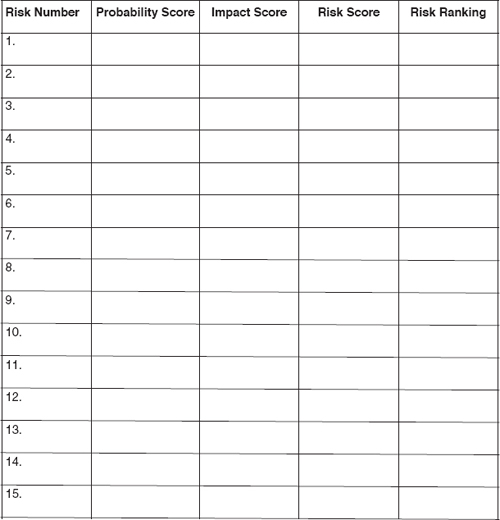
Use the risks you identified in Exercise 1-1 and rank them using the two methods illustrated in Exhibits 4-2 and 4-3.
Are there any significant differences in how you rated the same risk in the two parts of Exercise 4-2? Describe the difference and why you think you chose different ratings. Which score do you think more accurately describes the value of the risk?
DEVELOPING A RISK RANKING FOR A PROJECT
Valuing and scoring individual risks is obviously important, but what about the overall risk ranking of a project? often, that’s what customers and senior management really want to know.
Total risk exposure can be measured in several different ways, and each of these ways may provide you with a different answer. One simple method is to determine the overall risk exposure. To do that, add up the risk scores. In Exhibit 4-4, we’ve done that using the information from Exhibit 4-3. Notice that the answer (41) doesn’t tell us anything unless we compare it to the numbers for other projects. If total risk exposure for most projects were in the range of 30-50, we’d call this a moderately risky project. If the number for most projects were, say, 10, we’d call this high risk. And if the average score were closer to 100, the same project would be low risk.
An organization could also measure project risk by determining the maximum possible loss (or gain) or by the presence or absence of risks that are above the risk threshold levels in a given category.
Risks can also be measured by category and phase using a risk table approach. One such approach is illustrated in Exhibit 4-5. Again, the number produced by this process is only meaningful when you compare it to the number for other projects.
xhibit 4-4
Total Risk Exposure
| Risk | Score |
| 1 | 15 |
| 2 | 6 |
| 3 | 2 |
| 4 | 4 |
| 5 | 10 |
| 6 | 4 |
| TOTAL | 41 |
Measuring Total Project Risk
In creating the following spreadsheet, we used a scale of 1 (lowest) to 5 (highest) for the total risk in each category for each phase of the project. The maximum possible score (risk of 5 in every category and phase) is 350. Here, the actual score is 162.
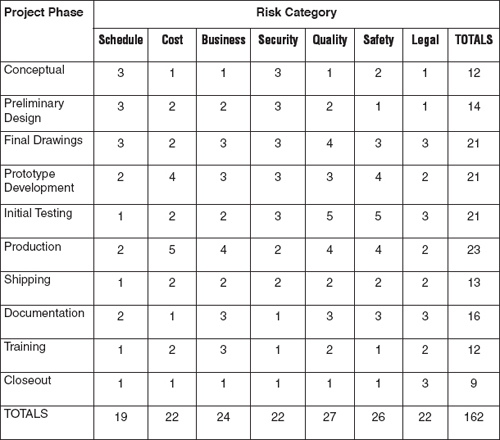
| HIGHEST POSSIBLE SCORE | 350 |
| ACTUAL SCORE | 162 |
| RISK RATIO | 162/350, or 46% |
UPDATING THE RISK REGISTER AND DEVELOPING A RISK INFORMATION SHEET
At the end of this process, you’ve reviewed the risks in each of the risk triage categories, assessed probability and impact, rated the risks more fully, and estimated the total risk exposure for the project.
Now update the risk register you started preparing during the risk identification phase (Exhibit 2-1) by adding the disposition of each risk: accept it, transfer it, or act on it. For risks you accept, you’re done—for now. The risk register serves as a “parking lot” for identified but accepted risks. From time to time, it’s a good idea to review the risk register to see if there are any risks that ought to be revisited because of changes in knowledge or circumstances.
For risks you transfer, the question becomes how much involvement do you still need to have with the risk? If it’s entirely out of your hands, and you neither have to help manage the risk nor furnish information, then you just need to make a note on the updated risk register. If you will be involved with the risk, or need to manage responses to the risk, then treat it as a risk you are going to act on.
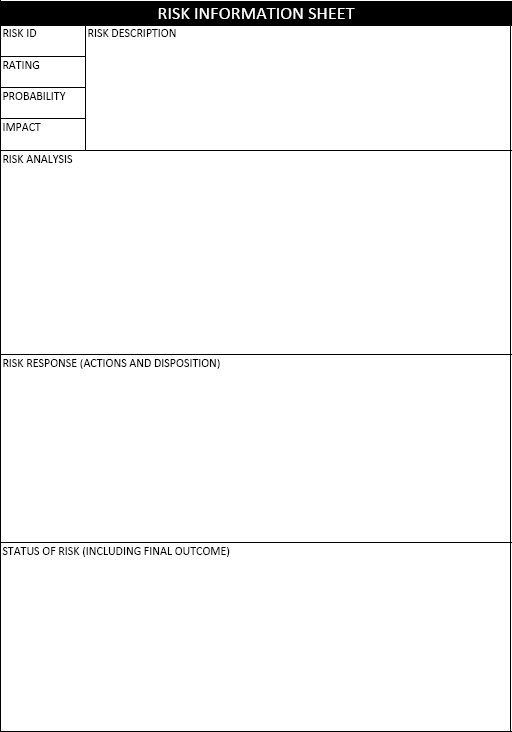
For all risks you are going to act on, you need more space than the risk register provides. A risk information sheet allows you to document a risk in more detail and helps you manage it actively. Exhibit 4-6 provides an example of a Risk Information sheet.
The top section of the risk information sheet repeats information from the risk register: risk ID, probability, impact, risk rating, and risk description. Simply copy what you’ve already written elsewhere.
The second section captures information from both qualitative and quantitative risk analysis and provides background and understanding of the risk and its wider context. The risk response section (which we’ll get to later) is the detailed description of what you plan to do about the risk. As the project moves forward, you’ll update the risk information sheet when its status changes, and end up with a final disposition for the risk.
If you get past the point in which it’s possible for the risk to occur, and it doesn’t, the risk is closed. For example, if there’s a risk the product won’t pass testing, and it does indeed pass testing, that particular risk no longer exists. If, on the other hand, the project does fail testing, then you have to do whatever is necessary to respond to that failure. When you have done everything you can do, and the risk has done all the damage (or benefit, if it’s an opportunity) it’s capable of doing, the risk is also closed.
In Exercise 4-3, you’ll prepare a risk information sheet of your own.
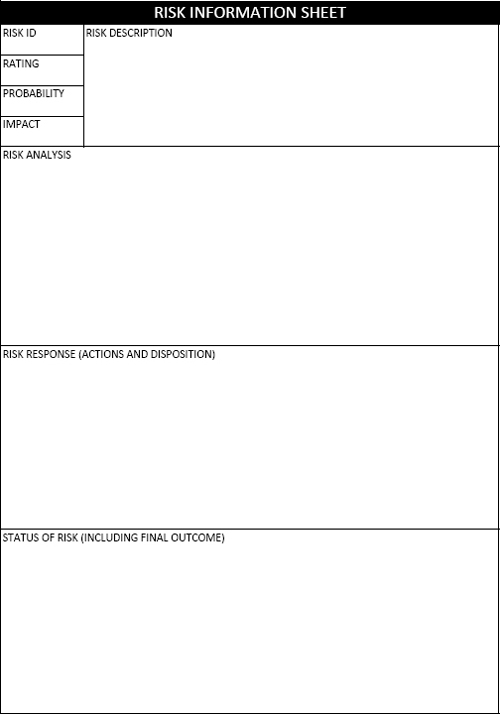
Prepare a Risk Information Sheet
Using one of the risks you originally identified in Exercise 2-1 and developed in subsequent exercises, prepare a risk information sheet using the form provided.

How much do you know about the risk? Levels of knowledge range from certainty to completely unknown. The information you have at the outset, however, is not the same as the information you will have after you do research.
Establish ranges for probability and impact when you don’t have actual numerical values. Establish risk thresholds—the maximum level of allowable risk in a given category (financial, safety, image, and so forth). You can calculate risk scores and rate the risks with words or with numbers.
To determine the overall risk ranking for an entire project (as opposed to an individual risk), you can use the total risk exposure (sum of the risk scores), the maximum possible loss or gain, the presence or absence of risks above the threshold level in any category, or use a spreadsheet to compare risks in each category to each phase of the project.
Update the risk register with the final disposition of each risk (whether you accept it, transfer it, or decide to act on it). For risks that require significant action, prepare a risk information sheet. Keep the risk register and review the risks on it from time to time in case circumstances or new knowledge cause you to reassess the potential seriousness of a given risk. You’ll update the risk register with risk response information and updated risk status as the project moves forward. At the end, you will close risks, either because they did not occur (and can no longer occur) or because they did occur and all the outcomes of the risk and risk response have happened.
 Review Questions
1. You should close a risk under the following conditions.
(a) When the risk exceeds an allowable risk threshold
(b) When you have decided to accept the risk and take no further action
(c) When the risk register has been successfully updated
(d) When the project has reached the point the risk can no longer happen, or when all its effects are finished
1. (d)
2. You need to establish a risk threshold when:
(a) there are a large number of risks in a given category.
(b) the potential cost of the risk exceeds the budget of the project.
(c) there is a maximum level of risk exposure that the organization is willing to accept in that category.
(d) the risk involves legal exposure or safety.
2. (c)
3. When it comes to determining the level of knowledge available about a given risk, you should:
(a) use exact figures for impact and ranges for probability.
(b) establish levels based on the preponderance of the evidence, rated as low, medium, or high.
(c) wait until quantitative risk analysis results are available before documenting any risk.
(d) put down what you know right now, even if it’s little or nothing, and research more later if necessary.
3. (d)
4. To assess total risk exposure, you should:
(a) review all risks that exceed risk thresholds.
(b) count the total number of risks.
(c) add up the individual risk scores.
(d) determine the maximum potential amount that can be gained or lost.
4. (c)
5. If there is a 25% chance that a given event will cost the project $100,000, what can you conclude?
(a) If the cost of eliminating the risk is less than $25,000, it’s probably wise to do so.
(b) If the cost of eliminating the risk is greater than $25,000, you should not take any action.
(c) The risk exceeds the risk threshold for the project category.
(d) The risk requires development of a risk information sheet.