
Answers to Exercises and Case Studies
EXERCISE 1-1. MANAGING IMPORTANT RISKS
One all-too-common strategy for dealing with risk is denial. We sometimes ignore risks because it can be uncomfortable to think about them, especially when the risks are potentially very serious and our options to do something about the risk are limited.
The purpose of this exercise is to make you more conscious of the risks in your environment—and the fact that you are doing something in response to many (albeit not all) of those risks.
You may find that actually writing down a particular risk and thinking about the best response causes you to take action you might not otherwise have taken, or at least refocus on an action you have already taken. Studies showed that random messages provided to bus drivers suggesting they be more careful on a particular day reduced accidents. It’s not that the drivers were otherwise unsafe, it’s that the reinforcement caused them to pay more attention for a short period.
We don’t judge you for the risk on which you have surrendered on the grounds that our own list of surrenders is embarrassingly long. However, there have been cases in which we postponed action for a long time, but eventually did do something about it. Awareness doesn’t always translate into action, but it’s usually a necessary precursor.
With that in mind, we encourage you to become more conscious of the risks in your environment. Continue the exercise over the next week, adding additional risks as you think about them. Try to add at least one risk each day; more is better. Through practice, this will make it easier for you to see risks in any environment—and to act upon them.


EXERCISE 1-2. YOUR CURRENT RISK MANAGEMENT PROCESS
The purpose of this exercise is not to criticize anything you or your organization may be currently doing with respect to risk management. Depending on the seriousness of the risks, the extent to which you have good information about those risks, and the cost of addressing those risks, some organizations have a very high need for formal risk management while others have a comparatively low need.
When thinking about informal risk management, be aware that risk management activities don’t always get labeled as risk management. For example, as authors, we check our spelling and grammar before sending our manuscripts to our editors, and our editors check them again. No one in publishing refers to proofreading as part of a book’s risk management plan, but if authors were incapable of error, then there’d be no need for poofraeding…er, proofreading…at all. Editors perform an unlabeled risk management function. So do many other professionals.
The two important questions in the exercise concern what works and what could be improved in your current process. We urge you to keep those ideas uppermost in your mind as you continue to work through this self-study course so that you can identify the most appropriate lessons to apply from these pages.
EXERCISE 1-3. WHAT YOU SPEND ON RISK MANAGEMENT
What’s valuable in this exercise is increasing your awareness of risk expenditures currently taking place, not how precise or comprehensive your estimate. As we move forward in this self-study course, consider these estimates as you identify other opportunities and tools to manage project risks. Are you spending the right amount on the right targets? What would be the benefit of additional risk expenditures? Where should they be targeted?
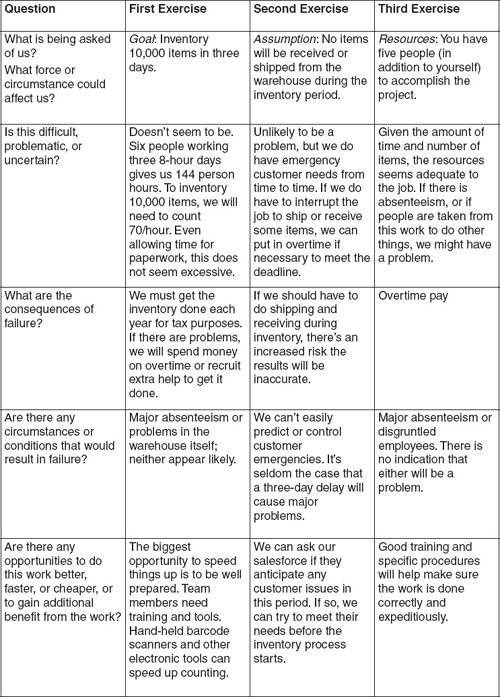
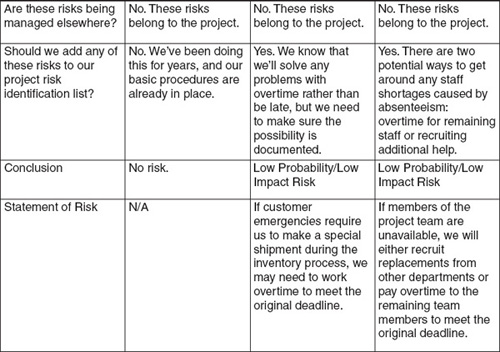
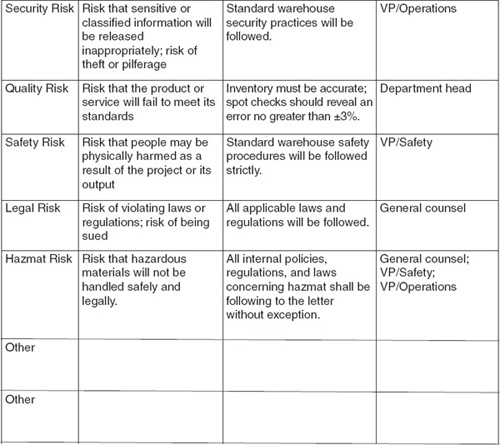
EXERCISE 2-1. RISK IDENTIFICATION PRACTICE
Depending on your own experience, you may have answered some of these questions in a different way. Your answers are right as long as they correspond to your experience in your own work environment—they don’t have to be the same as ours.
EXERCISE 2-2. SWOT ANALYSIS
Depending on your own organizational experience, you may have answers different from ours that are equally correct. Telling helpful from harmful is usually easy; check to make sure you’ve separated internal from external.
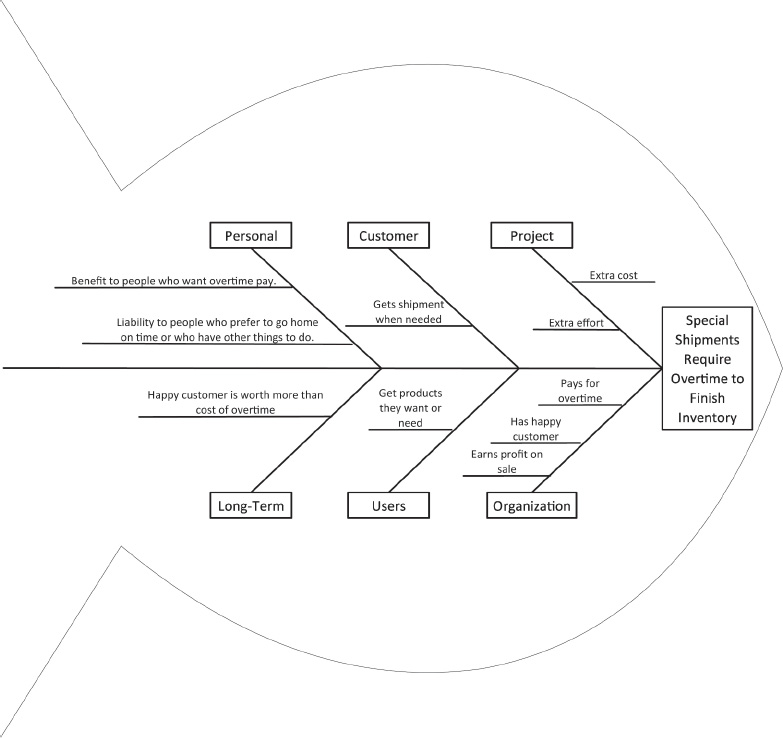
EXERCISE 3-1. CAUSE-AND-EFFECT DIAGRAM
Here’s one answer for the risk: “If customer emergencies require us to make a special shipment during the inventory process, we may need to work overtime to meet the original deadline” from Exercise 2-1. Notice that in this case, the costs are charged to the project (overtime) but substantial benefits accrue to the organization.
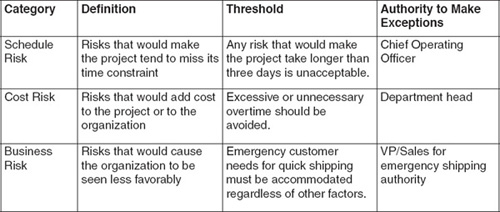
EXERCISE 4-1. ESTABLISHING RISK THRESHOLDS
To provide a comparison guide, we’ve developed risk thresholds based on the imaginary project from Exercise 2-1. Your thresholds are likely different.
EXERCISE 4-2. RANKING RISKS
One reason to consider using more than a single method of ranking risks is what happens when you do get different results. If you found that you ranked a risk differently, it may be because of a different scale. In the word exercise, there are four grades of probability (no “in the middle” choice) and in the number scale, there are five (all risks must be rated higher or lower). Sometimes you find yourself putting more emphasis on impact than probability, as opposed to considering both equally.
When this happens, we don’t have a bias in favor of one approach over the other. Instead, we view this as a reason to look at a given risk more deeply; based on our greater understanding, sometimes we end up choosing a higher risk rating or a lower one.
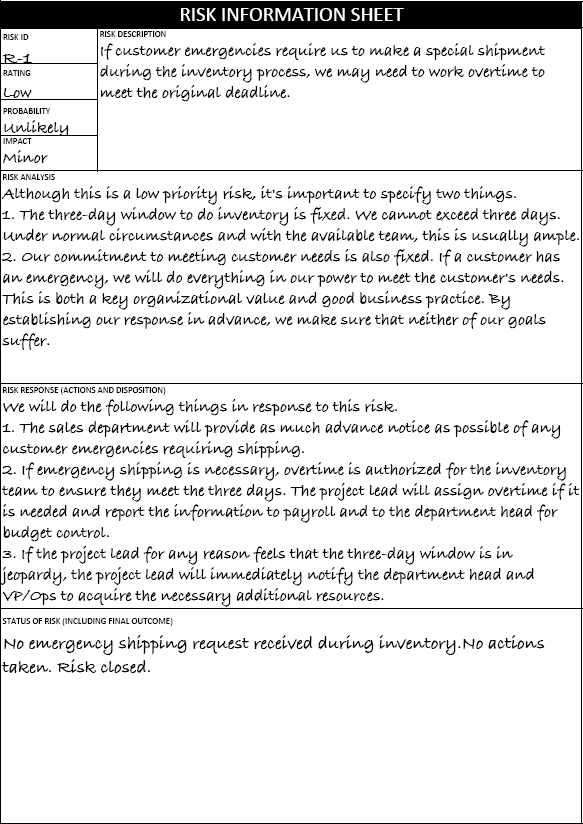
EXERCISE 4-3. PREPARE A RISK INFORMATION SHEET
This is a risk information sheet for “If customer emergencies require us to make a special shipment during the inventory process, we may need to work overtime to meet the original deadline” from Exercise 2-1 and Exercise 3-1.
In order to provide a complete example, we’ve filled in the “Status” section of the form. In real life, that won’t get filled in until there are actual project events to report. Notice in this case, the risk turned out to be a non-event.
EXERCISE 5-1. PROBABILITY PRACTICE
The basic probability of rolling a given number on a six-sided die is 1/6. That’s true no matter what number you pick. The probability of not rolling a given number is 1 minus the chance of rolling it, or 5/6. The odds, remember, are not the same as the probability, but the ratio of favorable to unfavorable outcomes.
| Probability | Odds | |
| a. Roll a 4 | 1/6 | 1/5 |
| b. Roll a 2 | 1/6 | 1/5 |
| c. Not roll a 4 or a 2 | 4/6 | 4/2 |
The probability of one event and another independent event happening is the product of the two probabilities: 1/6 × 1/6 = 1/36.
It’s easier to figure out the probability of not rolling a 4 on either die: 5/6 × 5/6 = 25/36. Since the probability of p(A) = 1 – p(not A), figure out the probability of rolling a 4 on at least one die by subtraction: 1 – 25/36 = 11/36. Yes, rolling a double 4 counts as “at least” one die.
| a. Roll two 4s | 1/36 | 1/35 |
| b. Roll a 4 and then a 2 | 1/36 | 1/35 |
| c. Roll a 4 on at least one die | 11/36 | 11/25 |
| d. Not roll a 4 on at least one die | 25/36 | 25/11 |
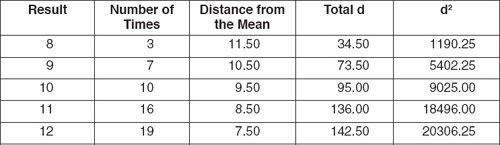
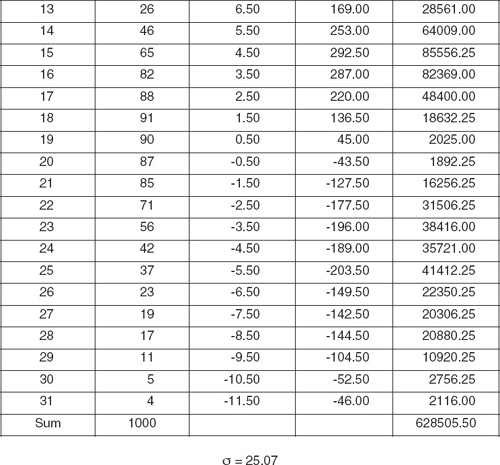
EXERCISE 5-2. CALCULATE A STANDARD DEVIATION
The answer key to this exercise is in two parts, both assuming you’ll use a spreadsheet to develop your answer. The first line contains the formulas that tell you what information should go in each empty cell from the exercise.
To determine the mean, add up the entries in the Result column and divide by the number of entries.
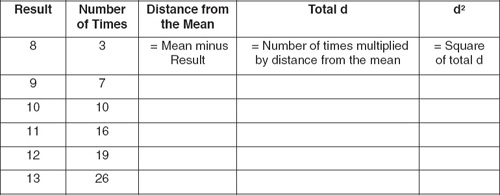
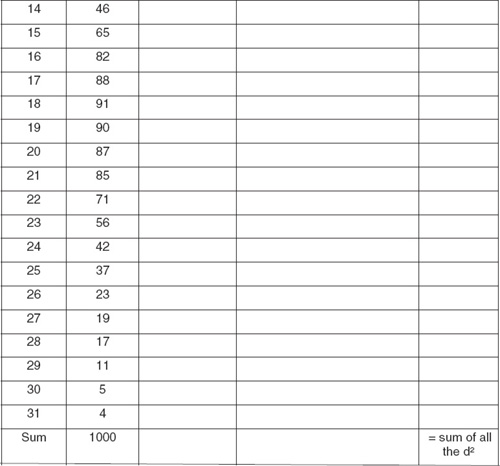
To calculate the standard deviation, first divide the sum of the d2 column by the total number of cases (1,000), then take the square root of your answer.
Armed with that information, let’s fill in the rest of the cells.
Mean = 19.5
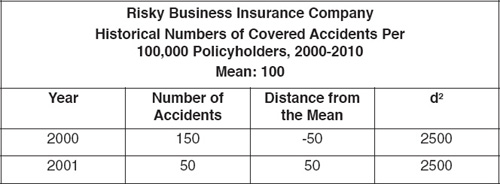
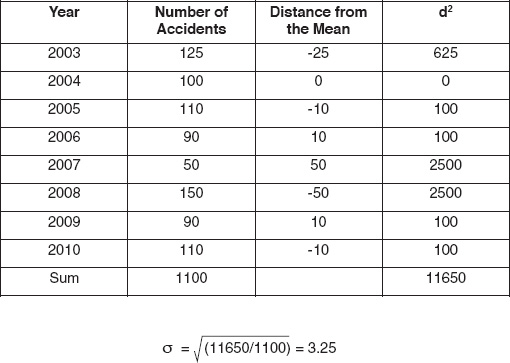
EXERCISE 6-1. GREATER ACCIDENT VARIATION
The formulas and process for completing this exercise are identical to the ones in Exercise 5-2 above.
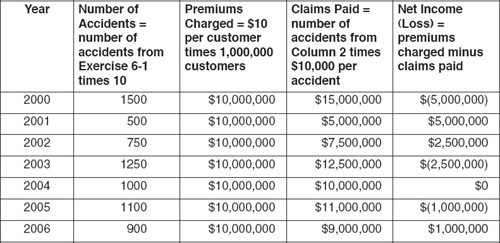
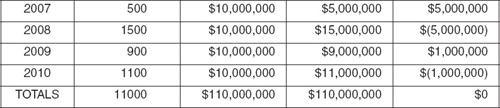
EXERCISE 6-2. PREMIUM INCOME AND CLAIMS OUTLAYS
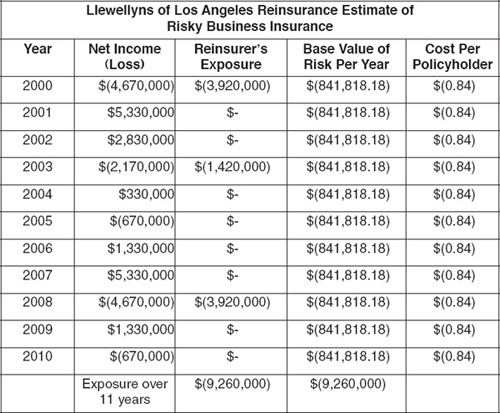
EXERCISE 6-3. PRICING RISK
a. Llewellyns of Los Angeles is responsible for Risky Business Insurance losses whenever those losses in a given year are greater than $750,000 over the premium income. That means Llewellyns writes three checks during the eleven years of coverage. Without considering any other factors, this works out to a premium of 84¢ charged to each Risky Business policy.
b. There are many other factors to consider in coming up with the final premium. Your list may vary, but these are some items we would consider.
1. The costs of doing business. Like all businesses, Llewellyns of Los Angeles has overhead, sales costs, cost of money, and desired profit.
2. Risk that the actual payouts over 11 years might be greater than premium charged. If Risky Business has one more bad year than the track record suggests, the reinsurer is on the hook for as much $5 million in additional payouts.
3. Risk that the maximum potential payout is $5 million, not $4.67 million.
4. The cost of the capital necessary to underwrite the insurance.
5. Surprises and black swan events.
c. Covering excess risk up to $10 million rather than capping the policy at $5 million is an exercise in judgment. We have no cases on record in which total losses have even hit the $5 million mark, our current maximum. One possibility is to do additional research. Are other insurance companies around the world in the same line of business? If so, have any of them experienced years in which covered events were dramatically more frequent than normal? If we can glean a pattern from our investigation, we can use that to price the additional risk. If you discovered, say, that the circumstance in which you’d have to pay an additional $5 million occur about 2% of the time, that suggests adding $100,000/1,000,000 to the premium cost, or another 10¢ per policy.
What if you can’t find any evidence whatsoever that such an event has ever happened? That doesn’t mean it’s impossible, but it’s fair to say it’s unlikely. At this point, risk managers end up having to make an assumption. In this case, we might say we were unwilling to underwrite the risk for less than 5¢ per policy, which equates to an assumed risk of 1%. Given the minor difference, we’ll use the 10¢ figure.
d. Pricing the cost of the reinsurance, as you can see, involves some judgment. Here’s our answer:
| $5 million cap | $10 million cap | |
| Base Cost of Risk | $0.84 | $0.84 |
| Additional Exposure (assuming 2% chance of catastrophic event) | $- | $0.10 |
| Overhead (25%) | $0.21 | $0.24 |
| Profit Target (15%) | $0.13 | $0.14 |
| Total | $1.18 | $1.32 |
Llewellyns of Los Angeles might well add safety for itself by rounding up these numbers, and charge a premium of $1.25 for a $5 million cap and $1.40 for a $10 million cap. For the purposes of our example, however, we’ll use $1.32 as the cost of reinsurance for Risky Business (we thought an extra 5¢ for protection against the larger loss was a bargain).
Your analysis may yield a different number, but as long as you considered the same basic issues and used a similar process, consider it equally valid. As we’ve noted, pricing risk involves judgment as well as analysis.
EXERCISE 7-1. DETERMINISTIC OR PROBABILISTIC?
| Number | Deterministic | Probabilistic |
| Make 100,000 new widgets per year with the new equipment Rated capacity is under specified conditions. Actual number will vary. If 100,000 is a guarantee, it’s the minimum number. |
||
| Sell the additional 100,000 widgets to customers Sales forecasts and estimates of customer demand are never exact. |
||
| Buy a widget maker for a price of $100,000 to $250,000 Advertised prices are usually good for a certain period of time. If we plan to act within that margin, the advertised price for the unit we select should be as predicted. |
||
| Make a gross profit of $5 to $7 per widget Cost of raw materials, labor, overhead, maintenance, and other factors can change cost; market conditions can change price. |
||
| Incur overhead costs of $3 per widget sold Unless these costs are unusually solid, there’s probably uncertainty here as well. |
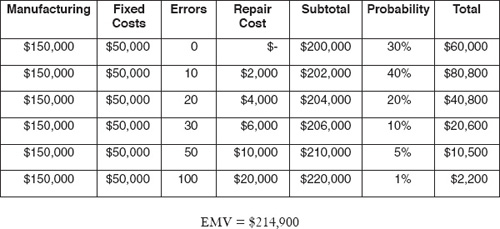
EXERCISE 7-2. CALCULATING EXPECTED MONETARY VALUE (EMV)
Create a spreadsheet with the following formula:
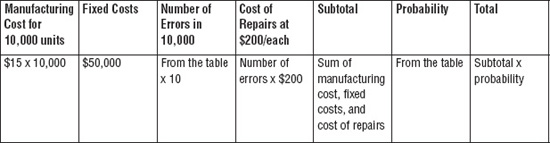
The EMV is the sum of the numbers in the final column. That’s the combined probability times the impact of each of the states of nature.
Now, let’s plug in the actual numbers.
THINK ABOUT IT … (DECISION TREE)
The difference between the EMV for Investment A and Investment B is $5,750 minus $2,800, or $2,950. Subtract that amount from the asking price for Investment B and you get $9,050.
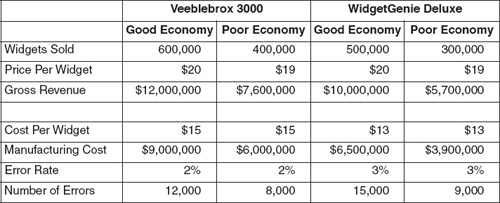
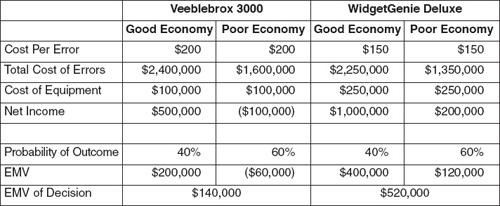
EXERCISE 7-3. DECISION TREE
Here’s a spreadsheet containing all the net income data, and the filled-in decision tree follows.
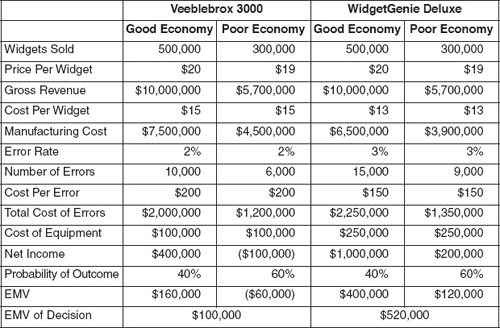
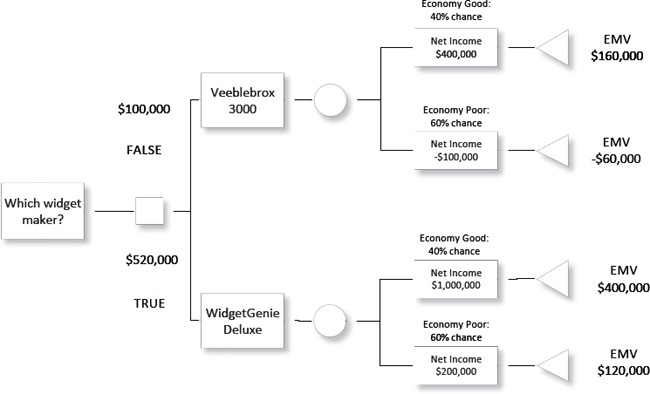
The more expensive WidgetGenie is a better investment, even considering its higher error rate.
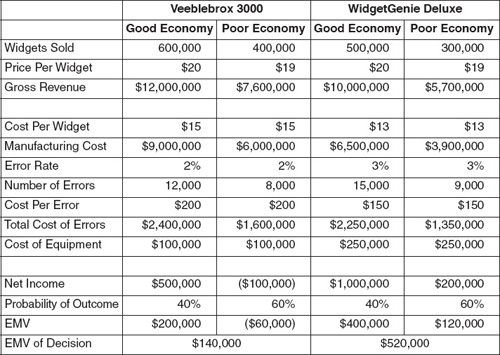
EXERCISE 7-4. SENSITIVITY ANALYSIS
Scenario: Veeblebrox defects only 1%.
Advantage: Veeblebrox by $240,000. Even though Veeblebrox has a lower defect rate, the higher cost of repairs is a huge drag on net income.
Scenario: Veeblebrox produces an additional 100,000 widgets.
Advantage: WidgetGenie by $380,000. At a price of $19 per widget, the company can’t make money no matter how many widgets they make.
Scenario: Veeblebrox errors only cost $100 to fix
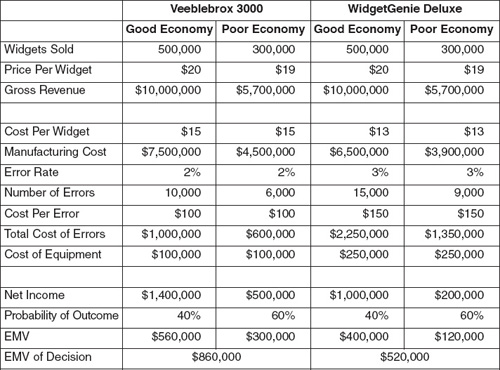
Advantage: Veeblebrox by $340,000. The lower cost per error takes $1 million out of costs.
Scenario: WidgetGenie doubles its price.

Advantage: WidgetGenie by $170,000. A $500,000 price tag is a bit high, because that means the WidgetGenie loses money in a bad economy. It could easily charge $400,000, however, and still be a better value.
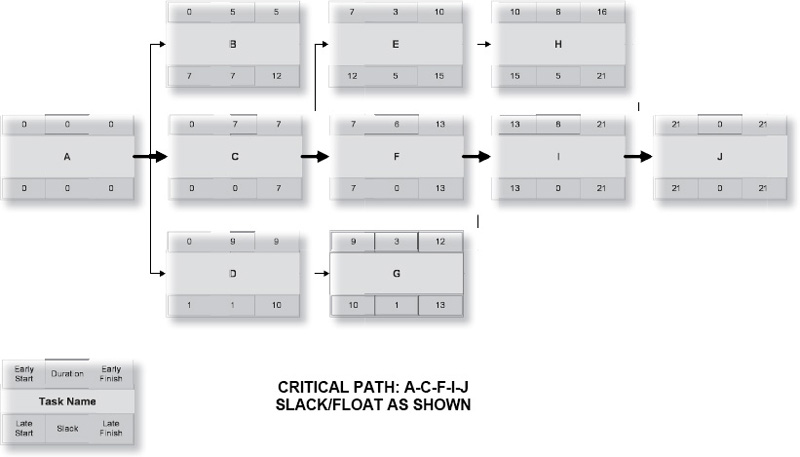
EXERCISE 8-1. CRITICAL PATH
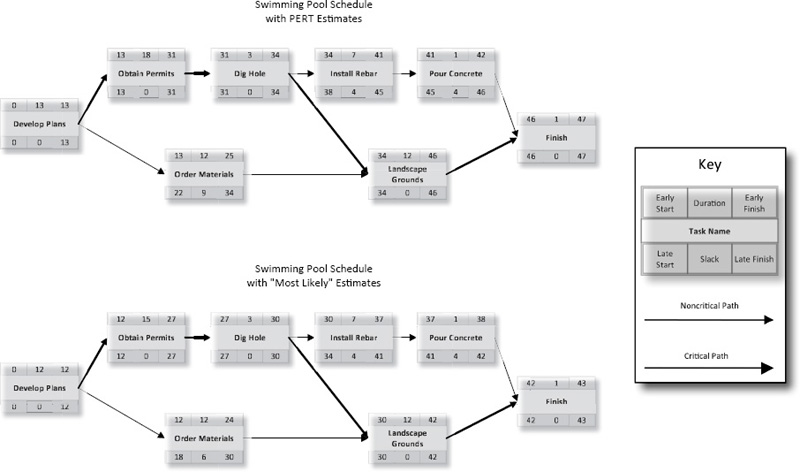
EXERCISE 8-2. SCHEDULING WITH PERT ESTIMATES
Step 1 Answer:
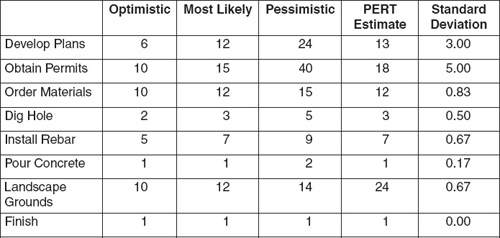
Step 2 Answer:
EXERCISE 8-3. CALCULATING STANDARD DEVIATION FOR A PATH OR NETWORK
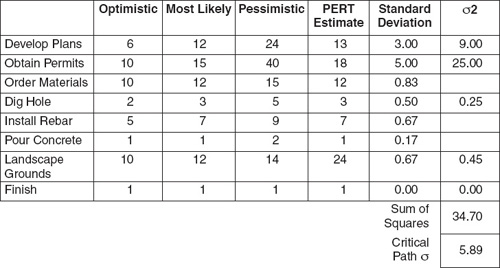
Critical path tasks are shown in bold. Only the standard deviations of those tasks are used in the root sum square. The basic project duration using PERT estimates, as you recall, is 47 days. To that we add the following (rounding our answers to the nearest whole day):
| 80% confidence | = | 47 days + (1.28 * 5.89 days) | = | 55 days |
| 90% confidence | = | 47 days + (1.64 * 5.89 days) | = | 57 days |
| 95% confidence | = | 47 days + (1.96 * 5.89 days) | = | 59 days |
EXERCISE 9-1. RISK RESPONSE PLANNING
Your answers, of course, will vary based on the risks you chose. We will take an existing risk response strategy from Exercise 4-3: “If customer emergencies require us to make a special shipment during the inventory process, we may need to work overtime to meet the original deadline.”
The proposed risk response was: “We will do the following things in response to this risk:
1. The sales department will provide as much advance notice as possible of any customer emergencies requiring shipping.
2. If emergency shipping is necessary, overtime is authorized for the inventory team to ensure they meet the three days. The project lead will assign overtime if it is needed and report the information to payroll and to the department head for budget control.
3. If the project lead for any reason feels that the three-day window is in jeopardy, the project lead will immediately notify the department head and VP/Ops to acquire the necessary additional resources.”
EXERCISE 9-2. RESIDUAL AND SECONDARY RISK
What level of residual risk will remain after the risk response has been implemented? Perhaps more than one emergency order will come in; perhaps people will be sick or unavailable when we need them for the overtime, or perhaps the emergency order will come too late in the process to allow action. These seem unlikely enough not to require separate action, and if they happen, the solution is more of the same: more people, more overtime.
How about secondary risk? Well, the obvious secondary risk is that if these orders come in, the cost of doing the project (overtime, in particular) will increase. We’ve explicitly accepted that the additional cost is superior to the consequences of failing to meet a customer emergency.
EXERCISE 9-3. TYPES OF RISK RESPONSE
The particular risk strategy we’ve selected is a contingent response. We think it’s unlikely that this risk is going to happen, and so we don’t want to spend money on it unless it’s necessary to do so. There are other potential responses. Let’s see how we’d approach the same risk using the other available strategies.
Avoidance. To avoid the risk of a conflict between the inventory and customer emergencies, we could decide to skip the inventory or ignore the customer. Either avoids the risk at hand, but both have substantial negative secondary consequences.
Transfer. We could hire an outside contractor to perform the inventory and hold the contractor responsible for the risk. This might cost a lot more money, and it could have other undesirable consequences as well. We could also make the sales department pay for our overtime out of its budget, meaning they would be more likely to check if this was indeed a true emergency.
Mitigation. Instead of waiting until we see if an emergency order arrives, we could go ahead and schedule extra resources to make sure we were enough ahead of schedule so that any delay would not matter. This certainly reduces the risk (but does not completely eliminate it for the reasons previously discussed), but costs a lot more money.
Acceptance. Because the situation is improbable, we could simply take our chances and try to cope in case the feared order arrives.
Exploitation. We could make sure our customers knew we were open for business even during inventory, and try to reap additional goodwill. We might also make the possibility of that emergency order more likely.
Enhancing. If we can find ways to speed up the time it takes to do the inventory, we save money long-term and at the same time lower the potential impact of emergency orders.
Sharing. The extra work in this case falls to the project team, but the benefit goes to the organization as a whole in the form of improved customer relationships. If that translates into extra sales, the sales force is likely to reap some additional reward in the form of increased commissions.
EXERCISE 10-1. EARNED VALUE METHOD (EVM) PERFORMANCE INDEX RATIOS
Today, the schedule says you should be completely done with Task A ($7,500) and Task B ($5,000), and half done with Task C (total cost of $10,000). You have completed 75% of Task A, spending $6,000 to date; all of Task B at a cost of $6,000; and you are completely done with Task C, having spent $12,000. How are you doing?
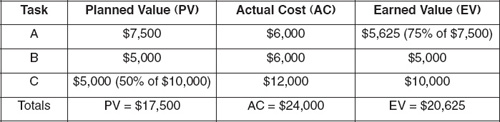
SPI = $20,625 / $17,500 = 1.18 (118%)
CPI = $20,625 / $24,000 = 0.86 (86%)
We’re probably ahead of schedule because we’re paying for it. This is not necessarily unreasonable, if the value of a speeded-up project is greater than the cost of the additional resources you may need.