
Chapter 4
Identifying Project Schedule Risk
“Work expands so as to fill the time
available for its completion.”
—C. NORTHCOTE PARKINSON, PARKINSON’S LAW
Although Parkinson’s observation was not backed up with any empirical data, its truth is rarely questioned. It seems particularly appropriate for technical projects, because in addition to all the obvious reasons that people have for using up the time available to complete their work, on technical projects there is an additional reason. Most people who are drawn to technical projects are analytical, and they like to be precise, accurate, and thorough. If there is time available to attempt to make something perfect, most engineers will try.
Projects, however, are rarely about perfection. They are about pragmatism, delivering a result that is “good enough.” Practicality is not particularly motivating, and it is rarely much fun, so technical projects often diverge from the direct path and out into the weeds. Thoroughly identifying schedule risks requires awareness of this and disciplined use of project management planning tools to create appropriate schedules that avoid overengineering.
In the previous chapter, we considered factors that can make projects literally impossible. In this chapter, and in Chapter 5 concerning resource risks, our focus is on constraints—factors that transform otherwise reasonable projects into ones that will fail. Project processes for scheduling and resource planning provide a fertile source for discovery of project risks that arise from these constraints.
Sources of Schedule Risk
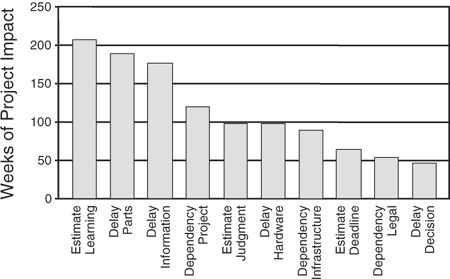
Schedule risks are second-most numerous in the PERIL database after scope risks, representing almost a third of the records. They fall into three categories: delays, estimates, and dependencies. Delay risks were most numerous; these are defined as schedule slips due to factors that are at least nominally under the control of the project. Estimate risks were on average the most damaging of the schedule risks; these are cases of inadequate durations assigned to project activities. Schedule dependency risks, also significant, relate to project slippage due to factors outside the project. (These dependencies all relate to timing—dependency problems primarily caused by deliverable requirements are grouped with the scope change risks.) Each root-cause category is further divided into subcategories, as demonstrated by the following table.
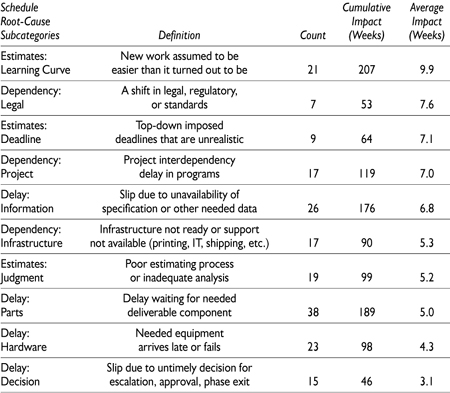
The overall impact of these schedule risk subcategories is summarized in Figure 4-1. The subcategory with the largest total impact was estimating new work, but several other subcategories were not far behind.
Figure 4-1. Total project impact by schedule root-cause subcategories.
Delay Risks
Delay risks represent over half of the schedule risks and nearly a sixth of all the risks in the PERIL database. Impact from delays had the lowest average of any other subcategory in the database, but it was still more than one month. Types of delay risk in the PERIL database include parts, information, hardware, and decisions.
Parts that were required to complete the project deliverable were the most frequently reported source of delay, with an average schedule impact of five weeks. Delivery and availability problems were common sources for this delay, but there were also quite a few issues involving international shipping, including customs, paperwork, and related concerns. Delays also resulted from parts that arrived on time but were found to be defective. The time required to replace or repair components that did not work properly was a significant source of project slip.
Information needed by the project represented over a quarter of the cases of in the delay category. These were also the most damaging on average, representing an average of nearly seven weeks of project slip. Some of the information delay was due to time differences between parts of distributed global teams. Losing one or more days on a regular basis due to communication time lags and misunderstandings was common. In other cases, access to information was poor, or delivery of needed reports was interrupted.
About one-quarter of the delay risks was caused by hardware needed to perform project work, including systems and other equipment, that was late. Risks in this subcategory averaged more than one month for delay.
Slow decisions also caused project slippage. Roughly one-sixth of the delay examples were due to managers or other stakeholders who did not act as quickly as necessary to keep the project on schedule. Sometimes the cause was poor access to the decision makers, or their lack of interest in the project. For other projects, delays were the result of extended debates, discussions, or indecision. Projects facing these issues lost nearly three weeks on average waiting for a response to a project request.
Potential delay risks may be difficult to anticipate, and many of them seem to be legitimately “unknown” risks. Thorough analysis of the input requirements at each stage of the project plan, however, will highlight many of them.
Estimating Risks
Of all the types of schedule risk found in technical projects, estimating is the most visible. When you ask project managers what their biggest difficulties are, estimating is high on, if not on top of, the list. Despite this, the number of incidents in the PERIL database is not too large, about 8 percent of the records, and only about a quarter of the total schedule risks. The average impact of the estimating risks is only slightly above that of the PERIL database as a whole. One frequently cited issue with estimating in technical projects is the relatively rapid change in the work. The standard advice is that good estimates rely on history, but when the environment is in constant flux, history may not seem all that useful (more on this later in the chapter). The estimating risk subcategories relate to learning curves, judgment, and imposed deadlines.
Learning curve issues were the most common type of estimating risk. Their impact was well above the average for the database, nearly ten weeks. The quality of the estimates when new technology or new people (or even worse, both) are involved is not good. The portions of project work that require staff to do things they have never done before are always risky, and although thorough analysis of the work can show which parts of the project plan are most exposed, good estimating is difficult.
Judgment in estimating was the next most common estimating problem in the PERIL database. For most of these cases, the estimates were overoptimistic. Some of these estimates were too short by factors of three or four. Dealing with this source of estimating risk requires thorough planning, with appropriate understanding and decomposition of the work, so that the effort and steps required are known. It also requires good record keeping. Metrics and project data archives are invaluable in creating future estimates that are more consistent with reality than past estimates have been, even for projects where things change rapidly. Having some data always beats having to guess. Another powerful tool in revealing and combating optimistic estimates is worst-case analysis. The answer to the question “What might go wrong?” will not only reveal something about the likely duration, it will also uncover new potential sources of risk.
Imposed deadlines were the third subcategory of estimating risks. Although these estimates were poor, the root cause was outside the project. Technical projects frequently have aggressive deadlines set in advance with little or no input from the project team. Even when the project plan shows the deadline to be unrealistic, the objective is retained. These projects are often doomed from the start.
Dependency Risks
Dependency risks were about a fifth of the schedule risks. The impact from schedule dependency risks is a bit below the average for the PERIL database as a whole, averaging more than six weeks of slip per incident. There are three dependency risk subcategories: other projects, infrastructure factors, and legal issues.
Other projects with shared dependencies not only were the most numerous of the dependency risks, they also are quite damaging, with an average of seven weeks. In larger projects (often classified as programs), a number of smaller projects interact and link to each other. In addition to providing each other with information and deliverables that meet well-defined specifications (which is a scope risk exposure), each project within a larger program must also synchronize the timing of schedule dependencies to avoid being slowed down by (or slowing down) other projects. Managing all these connections is difficult in complex programs, and the amount of damage increases with time; many of these risks in the PERIL database were noticed only late in the project. Even for the interfaces that were defined in advance, delay was fairly common due to the uncertainty in each project and the high likelihood that at least one of the interconnected projects would encounter some sort of difficulty. With so many possible failure modes, it is all but certain that something will go wrong. Analysis of the connections and interfaces between projects is a key aspect of program management, and many of the risks faced by the projects become visible through interface management techniques.
Infrastructure dependencies also interfered with project schedules in the PERIL database. The frequency of these problems was equal to the project dependencies, but the impact was less on average, at slightly more than five weeks. These situations included interruption of technical services, such as computer systems or networks required by the project, and inadequate access to resources such as help desks, system support, and people who understood older but necessary applications. Several projects were delayed by maintenance outages that were not known to the project team, even though they had been scheduled in advance.
Legal and regulatory dependencies were also problematic. Though the number of cases was less than 20 percent of the dependency risks, the average impact was highest for this subcategory, at almost eight weeks. Legal and paperwork requirements for international shipments can cause problems when they change abruptly. Monitoring for planned or possible changes can forewarn of many potential regulatory problems.
Black Swans
The worst 20 percent of the risks in the PERIL database are deemed “black swans.” These “large-impact, hard-to-predict, rare events” caused at least three months of schedule slip, and 30 of these most damaging 127 risks were schedule risks. As with the black swans as a whole, the most severe of the schedule risks account for slightly more than one-half of the total measured impact. The details are presented in the following table.
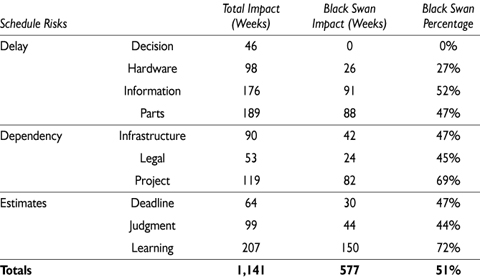
As can be seen in the table, the black swan schedule risks were distributed relatively evenly, with a slight edge to estimating risks. There were thirteen estimating risks, with eight related to learning curve issues. The learning curve category of estimating risks also was dominated by these sizable impact risks. Well over two-thirds of the learning curve risks were caused by cases such as the following:
• Complexity of new software was significantly underestimated.
• Development team was staffed with no regard for business knowledge.
• Neophyte project staff was inexperienced and had inadequate training.
• Key developer proved to be incompetent.
• Remote team did not have the expertise for key intermediate testing.
There were three cases of major project slippage due to estimating judgment, all related to inordinately optimistic assessment of project work.
Two black swan risks were caused by imposed deadlines:
• Adding project staff failed to cut the schedule in half.
• Commitments for a construction project were based on promises to customers, not planning.
Schedule delays in the PERIL database accounted for another ten black swans. Half of them were caused by late information, including these:
• Merging of multiple standards was required for reorganization, and lack of common definitions delayed the data conversion project.
• Software was developed in a country where a war broke out, limiting travel and inhibiting teleconferencing, so that needed information was always late.
• Poorly defined procedures for acceptance, quality, and communications inhibited distributed development.
• Legacy application that was to be modified had no documentation; reconstructing the original code was time consuming.
Four more significant risks were due to delayed parts:
• A component ordered was too long for international shipment, so it was cut and shipped in pieces. What arrived was useful only as raw material and replacing it was expensive.
• The required quantity of a new integrated circuit chip was unavailable, resulting in a major delay in delivery.
• A critical software component was delivered late.
• Insufficient material was sent to the contract lab to complete testing.
One black swan was hardware related, caused by a shipment of required servers that got stuck in customs. None of the black swan risks was due to tardy decision making, showing that even the slowest managers can eventually make up their minds.
Black swan dependency risks were even less numerous, with a total of seven. There were four black swan risks associated with programs in the PERIL database:
• The manager of a related project allowed stakeholders to make frequent scope changes, causing ripple effects and delay.
• Interdependencies in complex programs were detected late.
• The scope of work between related projects was poorly coordinated.
• Firmware needed for key project component was dropped by another project.
The two most significant infrastructure examples were:
• Development platforms had six-month validations; when a project slipped, required recertification delayed it further.
• The operating environment was upgraded to a new version, requiring rework and significant overhead.
There was also one project that encountered regulatory delay because of a process change that required an unexpected lengthy recertification.
Additional examples of schedule risks from the PERIL database may be found in the Appendix.
Activity Definition
Building a project schedule starts with defining project work at an appropriate level of decomposition. Both estimating and sequencing of work in a project are easier and less risky using small parts of the project. Although the entire project may be big, complicated, and confusing, the principle of “divide and conquer” allows for independent consideration of each little piece of work, and lets the project team bring order out of chaos. The starting point for schedule development (as well as for resource planning) is the project work breakdown structure (WBS), discussed in Chapter 3. If the work described at the lowest level of your WBS is consistent with the guidelines of “2 to 20 days duration” or “80 hours of effort,” the lowest-level items may be used as the foundation for scheduling. If your WBS decomposition is not yet to that level of granularity, hidden risks and questionable estimates will remain until you do further analysis and decomposition. Managing risk depends upon knowing what “going right” looks like, so it’s best to work with small, self-contained, deliverable-oriented bits of your project that you can competently estimate, schedule, and monitor.
The lowest level of the WBS hierarchy is the basis for developing a schedule, but the terminology used varies. Some call the items work packages, scheduling tools often use the term tasks, and agile software methodologies such as XP refer to stories. In “Project Time Management,” the PMBOK® Guide refers to these pieces of work as activities, the term adopted in this book.
Creating a project schedule requires both duration estimating and activity sequencing. Which of these planning tasks you undertake first is largely a matter of personal preference. The PMBOK® Guide shows these two processes in parallel, which is realistic. Both estimating and activity sequencing are iterative processes, and there is a good deal of interaction between the two when building a project plan. If starting to sequence project activities prior to estimating them seems more natural for your projects, use the material in this chapter in that order. What is essential for risk management is that you do both thoroughly, as each reveals unique schedule risks.
Estimating Activity Duration
Estimating risk provides a substantial number of the entries in the PERIL database and represented the highest average impact, at nearly two months. A good estimating process is a powerful tool for identifying this type of schedule risk. When the estimates that are precise can be separated from those that are uncertain, the risky parts of the project are more visible. When estimates are “top down” or based on guesses, the exposures in the project plan remain hidden. Quite a few failed projects are a consequence of inaccurate estimates.
In the dictionary, an estimate is “a rough or approximate calculation.” Projects require approximations of both time and cost. The focus of this section is on the risks associated with time estimates. All project estimates are related, though, and a number of concepts introduced here will be expanded in Chapter 5 and used there to identify resource risks through the process of estimating effort and cost. Estimates of varying accuracy are derived throughout a project, from the “rough-order-of-magnitude” estimates used to initiate projects to fairly precise estimates that are refined as the project runs to control and execute project work. Single-point estimates imply accuracy that is rarely justified in technical projects. Estimates that make risk visible are therefore stated as ranges, or with a percentage (plus or minus) to indicate the precision, or by using a probability distribution for expected possibilities.
Estimation Pitfalls
Estimating project work is challenging, and most people admit that they don’t do it well. Understanding the factors that make accurate estimating hard to do for technical projects provides insight into sources of project risk and helps us to improve future estimates. Four key impediments to estimating well are:
1. Avoidance
2. Optimism
3. Lack of information
4. Granularity
Probably the most significant problem with estimating is that people who work on technical projects do not like to estimate, so they avoid it. The appeal of technical projects is the work—designing, programming, engineering, building, and other activities that the analytical people on these projects like to do. People avoid estimating (and planning in general) because it is seen as overhead, or boring “administrivia.” Estimates are done quickly and only grudgingly. Most technical people have little estimating experience or training for estimating, so their skill level is low. Few people like doing things they do poorly. To make matters worse, because the estimates provided are so often inaccurate, most of the feedback they get is negative. It is human nature to avoid activities that are likely to result in criticism and punishment.
Too much optimism is another enemy of good estimates. In the PERIL database, the most common causes for poor estimating are learning curves and judgment, both of which may be symptoms of excessive optimism. Estimates that are too short create many additional project problems including severe increases in late-project work and deadline slippage. Optimistic estimates are often based on best-case scenario analysis (each activity is scheduled assuming that nothing goes wrong), assumptions about the amount of time that people will have available to do project work, and overconfidence in the talent and speed of the project team. The third kind of estimating risk in the PERIL database is top-down deadline pressure. When sponsors and stakeholders are inappropriately optimistic, they impose unrealistic time constraints on the project, forcing the project team to create estimates in their plans based on the time available (“schedule to fit”), not based on the reality of the work.
A third issue is a lack of information. Initial project estimates are the product of early analysis, when the amount and quality of available project information is still low. Often, scope definition is still changing and incomplete, and significant portions of the work are poorly understood when these estimates are made. Compounding this, on most technical projects there is little (or no) historical information to use in estimating, and there are no defined estimating processes used. The estimating method used far too often is guessing.
A fourth factor contributing to poor estimates is the granularity of the work. Early estimates are often done for projects based on descriptions of the work and the deliverables while lacking much detail. Estimates are chronically inaccurate when they are based on high-level project deliverables without details or acceptance criteria. The quality of estimates for long-duration project activities is also poor. Guidelines for project activities at the lowest level of the WBS—roughly two weeks’ duration, or eighty hours of effort—enable better estimating. When the activity duration extends beyond a month, duration assessments are generally inaccurate.
To recap, metrics, well-defined estimating procedures, clear scoping, disciplined planning, and periodic review of the project are all instrumental in improving estimates and decreasing estimation risk.
Estimating Techniques
Most of the estimating risks in the PERIL database are categorized as judgment and learning curve problems. The projects affected by these risks all had significant delays due to unrealistically short estimates. Many projects failed to account properly for the increasing complexity or new technologies in their work. Other projects chronically underestimated time for shipping and other commonplace project dependencies. Better processes and more attention to performance data will at least identify many of these risks, if not eliminate them.
Effective estimating techniques all rely on history. The best predictor of effort or duration for work on a project is the measurement made of the same (or similar) work done earlier. Project estimating either uses historical data directly or applies processes that have history as a foundation. Sources of appropriate data are essential to estimating well and reducing estimating risk. Good estimating relies on:
• Finding and using historical data
• Experts and expert judgment
• Experience-based rules and parametric formulas
• Delphi group estimating
• Further decomposition
For cases where none of these methods prove useful, there will be estimating risk.
Historical data The simplest estimating technique is to “look up the answer.” The most useful historical information, for projects of all types, is solid empirical data, collected with discipline and care during earlier work. Unfortunately for most project leaders, project metric databases are still fairly rare for technical projects, so such information is sparse. Potential sources of activity effort and duration information for projects can be found by reviewing data from:
• Postproject analysis and “lessons learned” reports
• Personal notes and status reports from recent projects
• Notes from team members
• Published technical data (either inside your organization or public)
• Reference materials and engineering or other standards
• The Web (offering data of wildly varying reliability)
Anecdotal historical information is often plentiful. Discuss the project with others and probe their memories. Written historical data tends to be more reliable, but anecdotal information is easier to get. Memories may not be as trustworthy, but any historical information can serve as a good foundation for preliminary estimating, especially if the data is recent, relevant, and credible.
A lack of documented history is a problem that is easy to fix. Measurement and productivity analysis are essential to ongoing management of estimation risk, so resolve to begin, or to continue, collecting actual activity data at least for your own projects. Metrics useful for risk management are covered in detail in Chapter 9.
Experts Historical information need not be personal to be useful. Even when no one on the project has relevant experience or data, there may be others who do, outside of your project. Look to peers, managers, and technical talent elsewhere in your organization. Seek out the opinions of colleagues in professional societies who do similar work for other companies. Outside consultants in technical or management fields may have useful information that they will share for a fee. Even quotations and proposals from service suppliers may contain useful data that you can use for estimating project work.
Rules and formulas When a type of work is repeated often, the data collected over time may evolve into useful formulas for effort or for duration. These formulas may be informal “rules of thumb” providing approximate estimates that relate to measurable aspects of activity output, or they may be elaborate, precise (or at least precise-looking) analytical equations derived by regression analysis using data from past projects. One often-referenced parametric formula in the software development world is the Constructive Cost Model (COCOMO), developed several decades ago by Barry Boehm at TRW. If your organization supports such size-based estimation methods, use them, and contribute data from your projects to improve their accuracy and keep them current.
Delphi estimates What individuals can’t tell you, groups sometimes can. The Delphi process uses inputs from several people (a minimum of four or five) to establish numerical estimate ranges and stimulate discussion. This method relies on the fact that although no one person may be able to confidently provide reliable estimates, a population of stakeholders can frequently provide a realistic prediction. Delphi is a “group intelligence” process to tap into information that would otherwise be unavailable, and because it is collaborative, it contributes to group buy-in, ownership, and motivation.
Further decomposition Another approach you can use when you lack historical data is to create some. Begin by breaking the activity to be estimated into even smaller pieces of work, and choose a representative portion. Perform this part of the work and measure the duration (or effort) required to complete it. Extrapolate from the actual measurements of the portion of the work to estimate the whole activity. Some activities can also be better estimated if thought of as small projects, with phases such as investigation, analysis, development, documentation, and testing
For activity estimates where none of these methods prove useful, you will face estimating risk.
The Overall Estimating Process
Good project estimating requires many inputs, starting with a comprehensive list of project activities. Another is a resource plan, information about the people and other resources available to the project. The resource plan is part of the “Project Resource Management” segment of the PMBOK® Guide and is a major topic in Chapter 5. One key reason for the resource information was mentioned in Chapter 3: You need to know the owners for activities at the lowest level of the project WBS. The activity owner is generally responsible for initial activity duration estimates. Whether the owner is the only contributor, or leads a team, or serves as a liaison to another group where the work will be done, the estimate is ultimately the owner’s responsibility.
Accurate estimates require clear, specific information about each activity. Document the constraints on activity durations or project assumptions that might affect the estimates. Activities with more than one deliverable may be easier to manage and have less risk if they are broken down further, creating new, smaller activities for each deliverable. Acceptance criteria and unambiguous, measurable requirements also contribute to accurate estimates. If specifications are unclear, clarify them or note the project risks.
There are three types of project estimates:
• Duration estimates, measured in active work time (usually workdays)
• Effort estimates, measured using a combination of people and time (person-days or something similar)
• Calendar estimates, measured in elapsed time (calendar days)
Each type of estimate has its place in the planning process. Duration estimates are used as input to computer scheduling tools and for schedule analysis. Effort estimates are resource based and part of project costs. Calendar durations relate to project deadlines and support accurate tracking. Project planning requires all three types of estimate, generally starting either with duration estimates or effort estimates. The other estimates follow, ultimately generating calendar estimates that are used to define the project timeline. Whatever estimating sequence you prefer, good planning and risk management depends on estimates derived from bottom-up project analysis. Avoid “pegged-date” or arbitrary, politically specified estimates. Building a plan with unrealistic estimates creates risk and undermines your ability to negotiate necessary project changes.
Some project leaders prefer to derive duration estimates first, and then develop the effort estimates when other planning data, such as activity sequencing information, is available. Effort estimates are then used to validate and adjust the duration estimates, based upon the accumulating project information. This process is summarized in Figure 4-2. Other methods begin with effort estimating, but whatever sequence you use the same issues, factors, and risks are involved.
Figure 4-2. Estimation process.
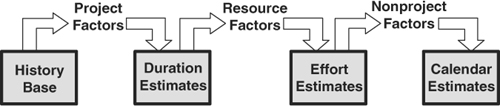
Project-specific factors and duration estimates As mentioned above, project estimating methods (including guessing) start with information derived in some way from history and experience. Beginning with the best available historical data for each activity, develop duration estimates. Use project-specific information to adjust these initial assessments, based on differences between the current project and earlier work. Project-specific factors include:
• Clarity of the project specifications
• Likelihood of significant specification change
• New resource requirements
• Longer overall project duration
• Unusual technical complexity
• New required technology
• Extreme requirements for reliability
• Geographic separation and cultural diversity on the project team
• Infrastructure and environment differences
• Training requirements
Every lowest-level activity in your WBS requires a duration estimate, measured in workdays (or some suitable units). In addition to providing input for adjusting historical data, these project-specific factors may also reveal significant project risks. If so, list them.
The estimates themselves may also reveal risks. Any activities with uncertain estimates are risky. However, lack of confidence in an estimate is a symptom of risk, not the risk itself. Whenever any of your project estimates seem untrustworthy, probe for why, and note the root cause as the risk. Two common sources of low-confidence estimates are lack of experience with the work and activities that may have several different outcomes, such as an investigation.
Resource factors and effort estimates Duration estimates, combined with project information on people and teams, provide the basis for effort estimates. Initial resource plans provide information on resource factors, such as:
• The amount of time each day each team member has for project work
• The number of people contributing to each activity
• The skills, experience, and productivity of each team member
• Training and mentoring requirements
• Nonproject responsibilities for each person
• Communication lags and other consequences of distributed teams
• Expected turnover or attrition of staff during the project
• The number and duration of project (and other) meetings
• The amount of project communication and reporting
• Travel requirements
• The number of required people not yet assigned to the project
The first factor in the list, the number of project hours in a day, is a common cause of underestimation. Not every hour that people work is available for project activities. Meetings, communication (both formal and informal), breaks, meals, and other interruptions take time. Even the common assumption of “five to six” hours per day for project activities is significantly higher than the reality available to many projects. Productivity is also a source of variation, and for individual team members it can vary wildly. Any estimates of effort or duration made in advance of assigning the specific people who will do the work are risky. These and other resource-related risks will be discussed in greater detail in Chapter 5.
By considering the effort required by each activity in light of the resource factors, you can determine activity effort in person-hours (or contributor-days or some other combination of staffing and time).
Nonproject factors and calendar estimates The final stage of estimation is to translate duration estimates into calendar estimates. To translate workday duration estimates into elapsed-time estimates, you need to account for all the days that are not available for project work. Computer scheduling tools simplify this process; many of the following factors can be entered into the calendar database, allowing the software to do the calculations. Some nonproject factors include:
• Holidays
• Weekends
• Vacations and other paid time off
• Other projects
• Other nonproject work
• Lengthy nonproject meetings
• Equipment downtime
• Interruptions and shutdowns
• Scheduled medical leave
Calendar estimates account for all the days between the start and end of each activity. Specific dates for each activity are derived by combining duration estimates, nonproject factors, and the activity sequencing information that we discuss later in this chapter. One particular risk common for global projects is a result of differences in scheduled time off for geographically separate parts of the project team. Frequent loss of some of the project team to various national and religious holidays is disruptive enough, but all too often these interruptions come as a surprise to the project leader, who may not be aware of all the relevant holidays.
Applying Estimating Techniques
Figure 4-3 summarizes estimation techniques that are applicable in various situations. For each project activity, the team either has experience or does not. For the type of work involved, relevant metrics will either be available or not.
Highest estimating risk is found in the worst case, lower right quadrant: no experience and no data. This case is far from unusual; on technical projects, it may be true for a number of activities you need to estimate. The most frequently used estimating methods involve guessing, sometimes with arcane rules, and in this situation a guess may be your best option. You can also consider alternatives such as getting someone who does have experience to consult on your project or even replanning the work to use an approach where your team does have experience.
Figure 4-3. Estimating techniques.
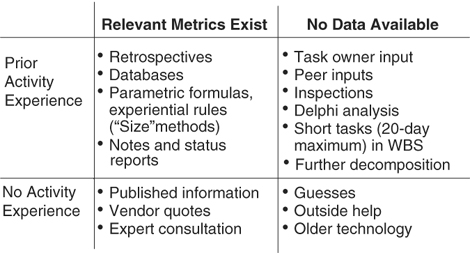
Only slightly better than this is the case where you have no experience, but you have found some external information. Estimates based on someone else’s measurements are better than nothing, but unless your project is similar to the project where the measurements were made, the data may not be relevant. In either of these cases, when a project activity requires work for which you lack experience, estimation risk is high, and your activity duration estimates belong on the project risk list.
The upper right quadrant is for activities that have been done before but for which no data exists. Although this should not happen, it is fairly common on technical projects. Thorough analysis and estimating methods such as Delphi may provide adequate estimates, but the results of these processes still contain estimation risk. Over time, more disciplined data collection will help you better manage these risks.
The best case is the upper left quadrant. The existence of both experience and measurements should provide credible, reliable estimates for project activities. Eventually, proactive risk management and disciplined application of other project processes will move many, if not most, activities here, even on high-tech projects.
One other significant source of estimation risk arises from the people who are assigned to do the work. “Good” estimates need to be believable, which means that they are derived from data and methods that make sense. This is a good foundation, but even the best estimating techniques yield unreliable estimates unless the project team buys in. To be accurate, estimates also must be believed. No matter how much data goes into creating estimates, if the people who will do the work do not agree with them, they are risky. Good estimates are both believable and believed.
Estimates Adjusted for Uncertainty
All the techniques just discussed generate deterministic, single-point estimates for project activities. This type of estimate implies a precision that is far from reality. To better deal with uncertainty and risk, the Program Evaluation and Review Technique (PERT) methodology was developed during the late 1950s by the U.S. military. The earliest forms of PERT used three-point range estimates for each activity: an optimistic estimate, a most likely estimate, and a pessimistic estimate. (PERT may be used for both time and cost analysis. This discussion concerns only time analysis.) Traditionally, PERT assumed a bell-type distribution that could skew toward either the optimistic or pessimistic estimate, similar to the Beta distribution in Figure 4-4. The three estimates were used to define a distribution of outcomes as in the figure, and calculations predicted an expected activity duration using the formula:
te = (to + 4tm + tp)/6, where
te is the calculated “expected” duration—the mean
to is the “optimistic” duration (the “best case”)
tm is the “most likely” duration (the peak of the distribution)
tp is the “pessimistic” duration (the “worst case”)
Figure 4-4. Duration estimates for PERT analysis.
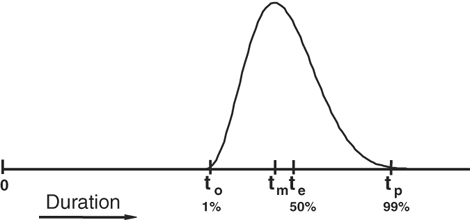
In addition to the “expected” estimate, PERT is also used to quantitatively assess estimation risk. For PERT, the range of possible outcomes allows you to approximate the standard deviation for each activity duration estimate, where:
One standard deviation = (tp–to)/6
The theory behind PERT was a step in the right direction, but in practice PERT analysis does not always prove to be useful. The three most common problems people have with PERT are the time and effort required for the analysis, data quality, and misuse of the information.
PERT requires more data—three estimates. This requires more time to collect, enter, and analyze. The collection process is annoying to the project team, and the three estimates are not easily integrated using common project management tools. Because of this, the cost of PERT analysis may exceed the apparent value of the results.
Also, as discussed earlier, the quality of even one estimate can be problematic. The accuracy of the two additional estimates is usually worse. Definitions of optimistic and pessimistic can be inconsistent, arbitrary, and confusing. PERT initially defined the range limits as “1 percent tails.” It was suggested that people imagine doing an activity 100 times and select estimates so that only once would the duration fall below the optimistic estimate and only once would it lie above the pessimistic estimate. For most activities, these estimates were generally wild guesses, or fixed plus/minus percentages. Because of this, PERT is often the victim of “garbage in, garbage out.”
Probably the biggest reason that PERT is not more widely used for technical projects is the potential for misuse of the information involved. Many organizations experiment with PERT for a time before this issue surfaces, but it eventually does. Everything starts out well. Project teams do their best to figure out what the three estimates might be for each activity, using difficult-to-understand definitions involving Beta distributions and 1 percent tails (or 5 or 10 percent tails—there are many variants). Project PERT analysis proceeds for a time, and some insight into project uncertainty begins to emerge. This continues until some bright midlevel manager notices the optimistic estimates. Because the project teams have admitted that these estimates are not actually impossible, managers begin to insist that schedules be based only on these most aggressive estimates, which are used to define the project deadlines. The statistical underpinnings of PERT predict that such schedules have essentially no chance of success, and experience invariably proves it. If any interest in PERT remains after this, the battered project teams in self-defense start to use different definitions for optimistic estimates.
Although PERT methodology can be troublesome, especially in its traditional form, three-point estimates can be useful. “Optimistic” estimate analysis is an important tool for exploring project opportunities, and in Chapter 6 we will explore using this “best-case” analysis for project opportunity management.
Even more important, pessimistic (or worst-case) estimates are a particularly fertile source of project risk information. After collecting activity estimates, investigate worst cases using questions such as:
• What might go wrong?
• What are the likely consequences should any issues arise?
• Is the staff involved experienced in this area?
• Have we had problems with this kind of work before?
• Does this activity depend on inputs, resources, or other factors we don’t control?
• Are there aspects of this work that we don’t understand well?
• If you were betting money on the estimates, would they change?
The responses to these and related probing questions will provide two pieces of important project risk data. The potential consequences you uncover, including slippage, additional costs, and other information, will be useful for later project risk assessment. Even more revealing, the sources of the potential slip (or other significant impact) are project risks that belong on your risk list.
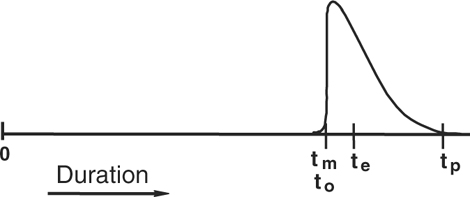
Schedule impact information can also be used for a simplified variation on PERT that provides insight into schedule risk. This analysis uses the initial activity estimates for both the optimistic and most likely PERT estimates, which Parkinson’s Law, the quotation that opened this chapter, predicts anyway. The worst-case information that you collect on any activity durations provides data for your pessimistic estimates. The distribution this implies will be essentially triangular and similar to Figure 4-5. The formula approximating the expected duration is te = (5tm + tp)/6.
Although PERT techniques such as three-point estimating relate to activity estimating, PERT analysis and more sophisticated simulation techniques are really tools for project risk assessment. This use of PERT and related tools is explored in Chapter 9.
Activity Sequencing
Additional scheduling risks become visible as you develop your project schedule by combining sequencing information with the activity estimates. Activity sequencing requires you to determine the dependencies for each project activity, and these linkages reveal many potential sources of project delay. Delay and other dependency risks were responsible for most of the scheduling risks in the PERIL database.
Figure 4-5. “PERT-like” estimating.
One effective method for minimizing schedule risk related to sequencing is to break long, complex projects into a series of much shorter ones. This principle is fundamental to evolutionary, or cyclic, software development methodologies. If the cycles are sufficiently short—two to four weeks are a common cycle in methodologies such as XP—the dependencies either become irrelevant or are sufficiently simple that managing them is trivial. For the most part, XP ignores dependencies except as special cases within each iteration. The same principle applies generally; the shorter the overall arc of a project is, the fewer complications and risks there will be because of activity dependencies.
In more complex projects, there are many possible types of dependencies that may connect project activities, but most are linked by finish-to-start relationships—once one activity or a collection of activities is complete, other project activities can begin. Occasionally, some activities might need to be synchronized by either starting or finishing at the same time, and the logic of project work may also depend on interruptions and lags of various kinds. Although project plans may include some of these more exotic dependencies, the majority of the dependencies in a typical project network are finish-to-start linkages, and it is these sequential-activity dependencies that are most likely to cause work flow problems and delay risk.
Discovering risks arising from schedule dependencies requires all project activities to be linked both to predecessor and to successor activities. Schedule development requires a logical network of project activities (and milestones) that has no gaps. Establish a logical flow of work for your project so that each project activity, without exception, has a continuous path backward to your initial project milestone and a continuous path forward to the final project deadline. Project analysis and risk identification will be incomplete (and possibly worthless) if there are gaps or dangling connections. For project planning using a computer tool, avoid the use of features such as “must start on” and “must end on” pegged-date logic. The software will generate a Gantt chart that looks a lot like a project plan, but you will not be able to perform schedule analysis, do proper project tracking, or effectively identify schedule risk.
Critical Path Methodology
Critical path methodology (CPM) analysis combines duration estimates with dependency information and calculates the minimum project duration based on this data. For larger projects, the analysis is best done using a computer scheduling tool. Once all your activities, duration estimates, and dependencies are entered into the database of a scheduling tool, the software automatically analyzes the project network. The set (or sets) of activities that make up the longest sequence is the project critical path, which is generally highlighted using an appropriately scary red color. Each of the red activities carries schedule risk, because if it exceeds its duration estimate, everything that follows in the project can also be expected to slip, including the project deadline.
CPM also calculates “float” or “slack” for “noncritical” activities, revealing any flexibility available. If the float is small, even though the activity might be colored a soothing blue, it’s also risky. Even project activities that have a large amount of float can be risky when their worst-case estimates exceed the calculated float. The other noncritical activities, those with significant float and reliable-looking estimates, are also relevant to risk management. They could represent opportunities for keeping the project on track.
Computer scheduling tools make it is easy to do “what if” analysis and reveal risky activities in addition to those on the project critical path. The first step is to make a copy of the database for the project (so you can manipulate the copy to identify additional schedule risks and leave your initial schedule intact). By deleting all the critical activities in your copy (relinking any resulting broken dependencies as you go), you can see what the resulting project looks like and generate a list of the next tier of risky activities to watch out for.
It’s even more illuminating to replace all your initial estimates with worst-case estimates to see what happens. When you do this one activity at a time, you discover how sensitive the overall project is to each potential problem. If you enter all of your worst-case estimates, you get a version of the plan that shows a far longer schedule than is probable, but the end point displays just how bad things might get if everything goes wrong. (And remember, your analysis is based on only known risks; if there are significant unknown project risks, even your worst-case schedule could be optimistic.)
In reality, every activity in the project represents at least a small level of schedule risk. Any piece of work in the plan could be the one that causes a project to fail. CPM analysis is a useful technique for determining which schedule risks belong on your risk list.
Multiple Critical Paths
Projects can and often do have more than one critical path. Multiple critical paths further increase schedule risk. To see why, consider the simple network in Figure 4-6. Both paths “A-D-J” and “C-H-L” are marked as critical, and for this analysis we will assume “expected” durations where the probability of an activity finishing early (or on time) is the same as the chance of the activity finishing late. For a project with a single critical path, the project as a whole has identical probabilities—50/50. (This assumes all events and activities are independent—more on this later.) What can we say about the project in Figure 4-6, with two critical paths?
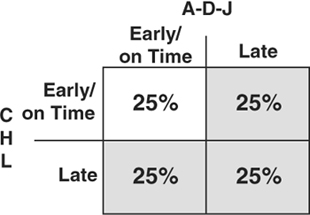
The expectation for each path being on time or early is the same as for the activities, 50 percent, but there are two of them. If the risks associated with the two paths are independent, the matrix in Figure 4-7 shows the probabilities for each possible outcome. The project has only one chance in four of finishing early or on time because this requires both paths to be early or on time, which is expected 25 percent of the time.
Figure 4-6. Project with two critical paths.
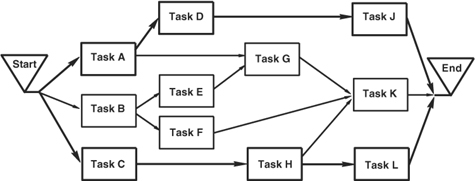
Figure 4-7. Result matrix for a project with two critical paths.
If there are more than two critical paths, the situation gets worse. With three critical paths, the chances fall to one in eight, and the fraction shrinks by a factor of two with each additional critical path. The more potential failure modes there are, the more likely it is that the project will be late. Although this picture is bleak, most technical projects face even higher risk. Few projects are planned using estimates that are equally likely to be slightly early or slightly late. Aggressive estimates are common on technical projects for all the reasons discussed earlier in the chapter, including overconfidence, lack of experience, and political pressure. If the estimates are actually 10 percent likely to be early or on time and 90 percent likely to be late, a matrix similar to Figure 4-7 for two critical paths will calculate only one chance of success in a hundred.
In addition, this analysis assumes statistical independence for all events. Although the assumption of independence may be valid for some project work, on most projects the work is all done by the same small team of people, and much of the work is interrelated. Assuming that the outcome of a given activity will have no effect on succeeding activities is unrealistic. Project problems tend to cascade, and there is often significant positive correlation between project activities. The upshot of all this is that schedule risk increases significantly when there are multiple parallel failure modes.
Scheduling Risky Work
The timing of activities may also increase project risk. Whenever an activity has high uncertainty, it is human nature to schedule it to start late in the project. If an activity requires the invention of something new, or the specifics of the work are far from obvious, you may be tempted to defer the work until later in the project, reasoning that the delay might give you a chance to figure it out. Also, scheduling risky work toward the end of your project will allow you to write at least a few weekly status reports that are not filled with bad news about troubled activities.
Tempting though this is, don’t do it. Deferring riskier activities until late in the project can lead to both increased project risk and cost. By scheduling risky activities earlier, you can learn faster, and frequently with less effort, whether there are any show-stoppers—activities that make your whole project impossible. When you discover the problems earlier, project decision makers have more options, including shifting the objective, using the time still available to seek alternate ways to proceed with the project, or even abandoning the work altogether. If a risky activity is deferred until late in the project, changes may be impossible or much more costly, and there will be little or no time left to find another approach. Perhaps the worst case of all is discovering that the project is not feasible and canceling it after months (or even years) have elapsed. When risky work is scheduled earlier, a decision to cancel can be made after spending only a small portion of the project budget instead of nearly all of it. In addition to being a waste of time and money, late cancellation is demotivating for the project team and will make it difficult to find enthusiastic staff for future projects.
Schedule Path Convergence
Another project risk is due to “fan-in.” Most places in a project network that have a large number of predecessor dependencies are milestones, but any point of convergence in a project network represents schedule risk. Because project work stops at a milestone or activity whenever any of the preceding activities are incomplete, each additional path in represents an additional failure mode, and increases the probability of delay. Milestones, phase exits, stage gates, and other life-cycle checkpoints are often delayed in large programs because of a single missing requirement; even when all the other work is satisfactorily completed, work may halt to wait for the final dependency.
The largest fan-in exposure for many projects is the final milestone, which usually has a large number of predecessor activities. Even in the simple project network in Figure 4-6, there are three predecessor dependencies for the finish milestone.
Interfaces
Dependency risks outside the project are also substantially represented in the PERIL database. Dependencies of all kinds may represent schedule risks, but interfaces—dependencies that connect one or more projects—are particularly problematic; the impact of these risks was among the highest for all schedule risks in the PERIL database, averaging seven weeks per project. Connections between projects are most common for projects that are part of a larger program. As each project team plans its work, dependencies on other projects are discovered and must be planned and managed. Dependencies that are wholly within a project carry schedule risk, but interfaces are even riskier. For a schedule interconnection, each project contains only half of the linkage, either the predecessor or the successor activity. The deliverables can be components, services, information, software, or almost anything that one project creates that is required by another project team. The project that expects to receive the deliverable potentially faces both schedule and scope risk. If the handoff is late, the dependent project may slip. Even when it is on time, if the deliverable is not acceptable, the project (and the whole program) may be in trouble. Interfaces are particularly important to identify and manage because of the limited visibility of progress in the project responsible for the deliverable.
The process for managing these interfaces and the risks related to them is best managed at the program level, and it is described in Chapter 13 in the section on program risk management.
Interface management requires agreement and commitments in writing between each involved project, and even then it’s risky. Add each interface dependency for your project to your list of project risks.
Planning Horizon
Yet another source of schedule risk relates to project duration. When you drive an automobile at night on a dark road with no illumination other than your headlights, you can see only a limited distance ahead. The reach of the headlights is several hundred meters, so you must stay alert and frequently re-examine the road ahead to see things as they come into view.
Projects also have visibility constraints. Projects vary a good deal in how much accurate planning is possible, but all project planning has a limit. For some projects, planning even three months in advance is difficult. For others, the planning horizon might be longer, but technical project planning is rarely accurate more than six to nine months into the future. Uncertainty inherent in work planned more than a few months out is a source of significant schedule risk on any long duration project. Make specific note of any unusual, novel, or unstaffed activities more than three months away. On a regular basis, include explicit activities in the project plan to review estimates, risks, assumptions, and other project data. Risk management relies on periodic recommendations for project plan adjustments based on the results of these reviews.
Project reviews are most useful at natural project transitions: the end of each life-cycle phase, a major milestone or checkpoint, a significant change to the project objective, whenever key contributors leave or are added to the project team, or following business reorganizations. At a minimum, schedule reviews for longer projects at least every three to six months. A process for project review is detailed in Chapter 11.
Documenting the Risks
Schedule risks become visible throughout the planning and scheduling processes. The specific instances discussed in this chapter are all project risks:
• Long-duration activities
• Significant worst-case (or pessimistic PERT) estimates
• High uncertainty estimates
• Overly optimistic estimates
• All critical path (and near-critical path) activities
• Multiple critical paths
• Convergence points in the logical network
• External dependencies and interfaces
• Deadlines beyond the planning horizon
• Cross-functional and subcontracted work
Augment the list of project scope risks, adding each schedule risk identified with a clear description of the risk situation. The list of risks continues to expand throughout the project planning process and serves as the foundation for project risk analysis and management.
Panama Canal: Planning (1905–1907)
Early in his work in Panama, John Stevens spent virtually all of his time among the workers, asking questions. His single-minded pursuit was thorough project planning. Stevens put all he learned into his plans, establishing the foundation he required to get the project moving forward.
The primary tool for construction was one Stevens was familiar with: the railroad. He recognized that digging enormous trenches was only part of the job. Excavated soil had to be moved out of the cut in central Panama where someday ships would pass, and it had to be deposited near the coasts to construct the required massive earthen dams. In the rain forests of Panama at the turn of the twentieth century, the railroad was not only the best way to do this, it was the only practical way. Much of the planning that Sevens did centered on using the railroad as a tool, and by early in 1906, he had documented exactly how this was to be done. When excavation resumed, his elaborate, “ingeniously elastic” use of the railroad enabled progress at a vigorous pace, and it continued virtually nonstop until the work was complete.
Once Stevens had broken the work down into smaller, easily understood activities, the canal project began to look possible. Each part of the job was now understood to be something that had been done, somewhere, before. It became a matter of getting it all done, one activity at a time.
For all his talents and capabilities, John Stevens never considered himself fully qualified to manage the entire project. His experience was with surveying and building railroads. The canal project involved building massive concrete locks (like enormous bath tubs with doors on each end) that would raise ships nearly 30 meters from sea level and lower them back again—twelve structures in all. The project also required a great deal of knowledge of hydraulics; moving enormous amounts of water quickly was essential to efficient canal operation. Stevens had no experience with either of these types of engineering. These gaps in his background, coupled with his dislike of the hot, humid climate and the omnipresent (and still dangerous) insects, led him to resign as chief engineer after two years, in 1907.
This did not sit well with Theodore Roosevelt. Losing such a competent project leader was a huge risk to the schedule. Both of his project leaders had now resigned before completing his most important project, and Roosevelt was determined that this would not happen again. To replace John Stevens, Roosevelt chose George Washington Goethals, an immensely qualified engineer. Goethals had been seriously considered for the job twice previously and was ideally qualified to complete the Panama Canal. He had built a number of similar, smaller projects, and he had a great deal of experience with nearly all the work required at Panama.
Theodore Roosevelt wanted more than competence, however. For this project, he wanted “men who will stay on the job until I get tired of having them there, or until I say they may abandon it.” He was safe in his choice of a new chief engineer and project leader: George Goethals was a major (soon to be lieutenant colonel) in the U.S. Army Corps of Engineers, and if he tried to resign, he could be court-martialed and sent to jail.