
Conductometric biosensors
S. Dzyadevych, National Academy of Sciences of Ukraine, Ukraine
N. Jaffrezic-Renault, University of Lyon, France
Abstract:
Biosensors could be a useful tool to compete with often tedious, complex and expensive standard methods. Conductometric biosensors have important advantages: they do not need the use of a reference electrode; they operate at low-amplitude alternating voltage, thus preventing Faraday processes on electrodes; they are insensitive to light; and they can be miniaturized and integrated easily using a cheap thin-film standard technology. This chapter describes and summarizes some examples of enzyme, whole cell and DNA-based conductometric biosensors with their advantages and disadvantages, and perspectives on their application for different human domains, such as biomedicine, environmental monitoring, agriculture and biotechnology.
Key words
conductometric biosensor; enzyme; cell; DNA; microorganisms
6.1 Introduction
The requirements and regulations in the fields of environmental protection, control of biotechnological processes, and certification of food and water quality are becoming more and more stringent. At the same time, stricter requirements regarding human and animal health have led to a rising number of clinical and veterinary tests. This means that highly sensitive, fast and commercial methods of analysis need to be developed. Analytical devices of the new generation – mainly biosensors – can be useful tools to compete with often tedious, complex and expensive standard methods (Coulet, 1991; Hall, 1988; Thevenot et al., 1999).
A biosensor converts the modification of the physical or chemical properties of a biomatrix, which occurs as a result of biochemical interactions, into an electrical or optical signal whose amplitude depends on the concentration of defined analytes in the measuring medium. Functionally, the device consists of two parts: a biomatrix, i.e. a detecting layer of immobilized material (enzymes (Bartlett and Whitaker, 1987/88; Mizutani et al., 1985), antibodies (Morrison, 1988; Lee and Morgan, 1993), receptors (Buch and Rechnitz, 1989), organelles (Lewis, 1989) or microorganisms (Wiseman, 1992; Karube and Sode, 1991)), and a transducer (potentiometric (Dumschat et al., 1991; Bergveld, 2003), impedimetric (Jossinet and McAdams, 1991; Macdonald, 1992), amperometric (Bartlett and Whitaker, 1987/88; Lorenzo et al., 1998), conductometric (Kell and Dave, 1990; Cullen et al., 1990), acoustic (Fawcett et al., 1998), optical (Roef, 1987; Smardzewski, 1988) or colorimetric (Luong et al., 1988; Dittmar et al., 1992)).
Numerous reviews (Dzyadevych, 2002, 2004, 2005) and books (Hall, 1991; Tran Minh, 1993; Kress-Rogers, 1997), as well as a lot of experimental research concerning various types of biosensors, have been published. However, only some works are devoted to the development of conductometric biosensors, including those used for chromatography and chemical sensors for the determination of air moisture and the concentration of certain gases (Fluitman, 1996; Zinner, 1995; Abraham et al., 1998).
This rather insignificant attention paid to conductometric biosensors in comparison with other transducers can be explained by the fact that the fundamental mechanisms of such devices have not been well studied. Yet conductometric biosensors have important advantages, as they do not need the use of a reference electrode; they operate at low-amplitude alternating voltage, thus preventing Faraday processes on electrodes; they are insensitive to light; and they can be miniaturized and integrated easily using a cheap thin-film standard technology.
The liquids analysed are mostly considered to have significant background conductivity, which is easily modified by different factors; therefore the selectivity of this method is presumed to be low and consequently its potential use for different applications is rather doubtful (Dorokhova and Prokhorova, 1991). However, in the case of an integral microbiosensor, most of these difficulties can be overcome by using a differential measuring scheme that compensates for changes in background conductivity, the influence of temperature variations and other factors (Gopel et al., 1991; Kell, 1987).
6.2 Conductometry in enzyme catalysis
The conductometric measuring method can be used in enzyme catalysis to determine substance concentration and enzyme activity, selectivity in this case being provided by the enzymes, which catalyse only certain reactions. As a matter of fact, the subject under consideration is not a biosensor as such but an application of this method in enzymology.
In 1961 one of the first researches in this field was published, showing how it might be possible to determine urea concentration in solutions (Chin and Kroontje, 1961). This method is based on the difference between the electrical conductivity of urea solution and that of a solution of ammonium carbonate formed as a result of urea hydrolysis by urease. In the experiments a bridge measuring scheme was used. The urease activity was shown to decrease in the presence of heavy metal (Ag, Hg, etc.) ions in the solution. Such electrolytes as NaCl or KCl do not influence urease activity, but if their concentration in the solution is high it can lead to an incorrect result, especially at low urea concentrations. At low electrolyte concentrations in experiments without buffer solution, during urea hydrolysis themedium pH gradually changed from 7.0 to 9.0. However, this causes only an insignificant change in the urease activity, while the solution conductivity during the reaction varied substantially. The urea concentration was determined within the 0.1 μM–2 mM range, at optimal pH 7.0. A comparison of the conductometric method with other methods of urea analysis carried out in that work has shown that the former is characterized by high accuracy, speed and simplicity. Besides, in contrast to optical methods, the measurement accuracy of conductometry does not depend on solution colour.
However, conductometric methods have some limitations. The ratio between the signal and noise level should not be lower than 2 %. For this reason, the concentrations of buffer and some other ingredients, which can be added to the reaction mixture, are important. The method sensitivity is reduced in the presence of non-reacting ions in solution. Buffers with low ionic strength can be used, though, to measure low concentration until the signal/noise ratio is of proper value. Another disadvantage of conductometry is its low specificity – it is incapable of distinguishing between simultaneous reactions, which can cause an artefact. The capacity of the double layer and the electrode polarization during reaction can also be sources of method error.
In conductometric enzyme biosensors, enzymatic reaction is confined close to the interdigitated electrode (IDE) surface, because the enzyme is cross-linked in contact with this surface. The IDEs allow the measurement of the change of conductivity in the region defined by field lines. The involved thickness is of the order of the interdigit distance (a few tens of μm) (Panke et al., 2008). As it has been modeled (Sheppard et al., 1996), the observed steady-state response of the conductometric enzyme biosensor is the result of the reaction rate-limited kinetics of the enzymatic reaction and the diffusive flux of urea hydrolysis products away from the transducer surface, in the boundary layer.
In subsequent sections, both conductometric enzyme biosensors based on direct analysis and conductometric enzyme biosensors based on inhibition analysis will be considered.
6.3 Conductometric enzyme biosensors based on direct analysis – I: Biosensors for biomedical applications
6.3.1 Glucose biosensors
The glucose sensors undoubtedly dominate among the biosensors developed by scientific laboratories, since glucose, a vital metabolite of living organisms, is the most frequently determined in biological media (Schmid and Karube, 1988). Besides, glucose is widely used in the food industry and biotechnology, since it is the actual source of carbon in numerous microbial fermentation processes and in growth of cell cultures. Moreover, the glucose sensor was the first to be described(Clark and Lyons, 1962), its development has attracted the greatest attention, and glucose, together with the enzyme glucose oxidase, has been used in further development of novel biosensor prototypes as a model system.
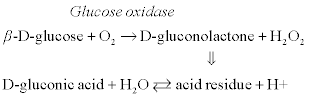
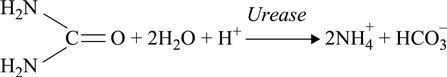
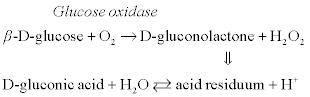
The principle of operation of conductometric biosensors for glucose determination is based on the following enzymatic reaction:
[6.1]
 [6.1]
[6.1]
The first conductometric biosensor for glucose determination has been described in Shul’ga et al. (1993, 1994). Conductometric transducers based on thin-film interdigitated metal (Au, Cr, Cu, Ni) electrodes were studied, and enzyme glucose oxidase was immobilized on the gold electrode-based chips. The influence of ionic strength and buffer capacity of the samples on the biosensor’s response in kinetic and steady-state modes of measurements was thoroughly tested.
The typical calibration curves for conductometric glucose biosensor are presented in Fig. 6.1. It is distinctly seen that the dynamic ranges of the biosensor towards glucose are quite narrow (up to 1.5–2 mM) and do not depend on the buffer capacity of the solution. The biosensor sensitivity is highly dependent on buffer concentration. The detection limit of glucose concentration was 0.01 mM.
Limitation of the enzymatic reaction by oxygen, a co-substrate of this reaction, is the reason for a narrow dynamic range of glucose biosensors. The use of potassium ferrocyanide as the oxidizing agent in biocatalytic glucose oxidation results in a higher level of solution acidity inside the enzymatic layer, because three protons per glucose molecule are generated compared with one proton per molecule in the case of the natural oxidizing co-substrate, oxygen. Depending on the potassium ferrocyanide concentration, 10–100 times higher biosensor response and a remarkably wider dynamic working range were revealed, as well (Dzyadevich et al., 1998).
Further study was mainly focused on the use of different additional membranes deposited on top of the enzymatic membrane for the sensor modification. In this case, a diffusion barrier is formed to membrane penetration by glucose molecules, while oxygen diffuses through the membrane easily (Dzyadevich et al., 1995). Utilization of additional membranes allowed a wider (up to 10 mM) operation dynamic range with a minor decrease in sensitivity. Similar results were received for polytetrahydrofuran membranes, facilitating an increase in the dynamic range of up to 15 mM without any decrease in sensitivity. Lower sensitivity of conductometric biosensors towards changes in buffer capacity and medium ionic strength was also shown to be the result of usage of the additional membranes.
6.3.2 Urea biosensors
Urea determination in biological liquids is an important diagnostic test, as the increase in urea concentration in blood and its decrease in urine are evidence of renal dysfunction of the organism (Kerscher and Ziegnhorn, 1983).
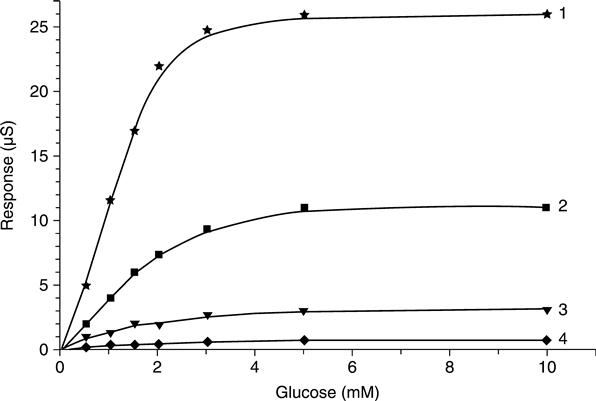
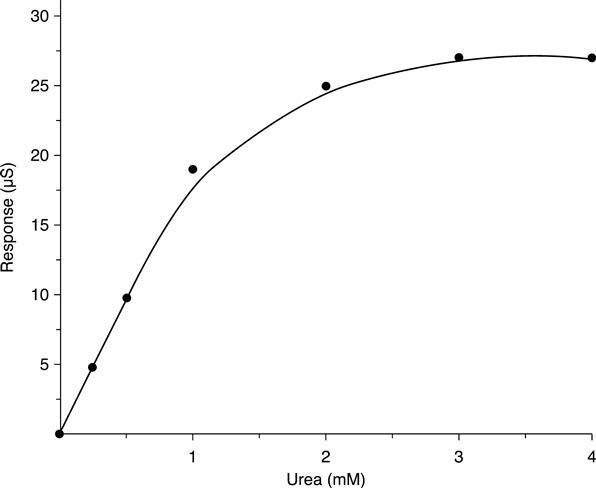
Fundamentally, urease biosensors are based on the enzymatic reaction:
 [6.2]
[6.2]
This reaction results in proton consumption as well as in generation of additional ions (NH+4 and HCO−3); thejoint effect causes changes in conductivity inside the membrane.
The first conductometric biosensor for urea determination was described in Watson et al. (1987/88). It was a device consisting of a silicon substrate with a pair of gold interdigitated and serpentine electrodes. The experiments were carried out in both a laboratory and clinics; the biosensor response to urea was in the range of 0.1–10 mM in imidazole buffer, pH 7.5. The Km of immobilized enzyme was higher than that of the native enzyme; the authors explained this as a result of diffusion limitation. A comparison of the data obtained by the biosensor in the laboratory with the results of conventional clinical tests showed good agreement (the correlation coefficient was higher than 0.99).
Similar conductometric biosensors have also been used as a multisensor (Cullen et al., 1990). Urease was immobilized on the surface of the first electrode pair in a gel layer; on the second pair there was L-asparaginase; on the third pair a three-enzyme system –‘urease–creatinase-creatininase’. This sensor was used for the determination of urea, L-asparagine and creatinine, respectively. The sensor was tested separately with each of the substrates, and in multi-substance mode the kinetic and calibration curves were determined.
The multisensor described in Hin et al. (1990) consisted of a conductometric biosensor for urea analysis combined with an amperometric biosensor for glucose determination. It was highly selective and simple to operate, and was used in clinics.
Mikkelsen and Rechnitz (1989) characterized conductometric biosensors for urea and D-amino acids determination. The enzymes urease and D-amino acid oxidase were used. The minimum detection limit for urea concentration was 5 μM; the linear dynamic range was of three orders. The dependence of response on buffer capacity was studied. While the sensor for D-amino acid analysis was being developed, the D-amino acid oxidase was co-immobilized with catalase, since hydrogen peroxide, being the product of the enzymatic reaction, is the inhibitor of D-amino acid oxidase. A comparative analysis of using copper and platinum electrodes, as well as different buffer solutions, showed that platinum electrodes and glycine buffer were preferable. An optimal pH of the sensor for D-amino acids and its selectivity towards various amino acids were determined. The sensor showed stable results during 33 days’ operation.
Bilitewski et al. (1992) described two types of thick-film conductometric biosensors for urea determination. The first type was manufactured by printing two IDEs onto an Al2O3 substrate using platinum paste, while the second one, consisting of four silver–palladium electrodes in parallel, was manufactured by the ‘green tape’ technology. Urease was immobilized by covalent binding in albumin gel. The response time for both biosensors was about 10 min. The dynamic ranges for the first biosensor were 0.1–50 mM urea, with the linear part 0.1–4 mM, and for the second 10 μM–5 mM urea, with the linear part 10–350 μM. These biosensors were shown to be suitable for medical analysis.
Typical calibration curve of conductometric urease sensors for urea are presented in Fig. 6.2. The response value was shown to depend on medium conditions, i.e. buffer capacity, pH and ionic strength (Dzyadevich et al., 1996), which is a disadvantage, since it requires taking these parameters into account in the analysis protocol.
The screen-printed thick-film IDE has proved to be an excellent conductometric transducer in which the admittance signal is dominated by the conductance signal and the resulting dynamic range is wide enough to be employed for the construction of a conductometric urea biosensor (Won-Yong et al., 2000). The sol–gel–derived urea biosensor exhibited a lower detection limit of 0.03 mM and a dynamic range two orders of magnitude wide, thus suggesting that the biosensor could be used in routineurea assays in real samples such as urine and serum. Measurements in serum were satisfactory. Although the current urea biosensor is far from completely optimized, it is comparable to other urea sensor systems, and it exhibits the advantages of a simple fabrication procedure, good sensor-to-sensor reproducibility, relatively good storage stability, wide dynamic range, easy control of biosensor performance by changing the alkoxide/water ratio in the stock sol–gel solution in the construction of the biosensor, and no chemical modification of the substrate or enzyme.
It has been shown recently (Nouira et al., 2012) that the use of gold nanoparticles for the immobilization of urease allows increased sensitivity of detection (from 10 μS/mM to 107 μS/mM) due to the decrease of the thickness of the probed zone, the gold nanoparticles behaving as nanoelectrodes. A detection limit of 100 μM of urea is obtained when cross-linked urease is directly immobilized on top of the IDEs (interdigitated distance: 20 μm), whereas a detection limit of 2 μM is obtained when urease functionalized gold nanoparticles are deposited on the top of the IDEs.
6.3.3 Biosensors for arginine determination
Nowadays there is a considerable demand for the determination of L-arginine in clinical practice and the pharmaceutical industry. The level of L-arginine, the most basic natural amino acid, is of great interest in the life sciences due to thefact that L-arginine and its metabolic derivatives, such as urea, ornithine, creatine, nitric oxide and citrulline, are involved in a wide range of biological activities, including energy metabolism, vasodilation, the urea cycle, immune response and neurotransmission in mammals.
The conductometric biosensor for L-arginine detection is based on the arginase–urease system, in which an excess of urease is added in order to ensure complete and prompt conversion of all the urea formed to ammoniacal nitrogen (Saiapina et al., 2012).
[6.3]
[6.4]
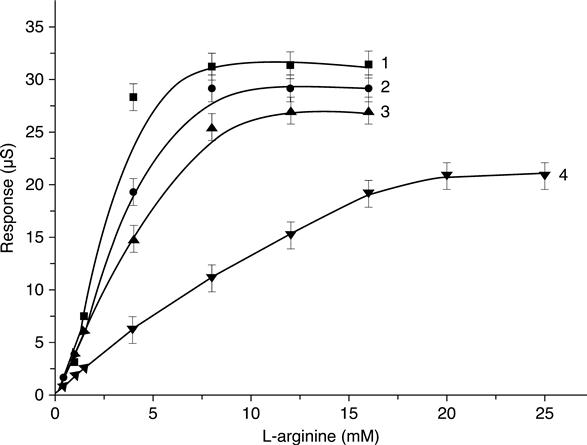
The dependence of the responses of L-arginine biosensors on buffer capacity was obtained in 2.5 mM, 5 mM, 10 mM, and 20 mM phosphate buffer (pH 6.0). According to the results, the sensitivity of the biosensors for L-arginine determination had an inversely proportional dependence on the concentration of phosphate buffer (Fig. 6.3).
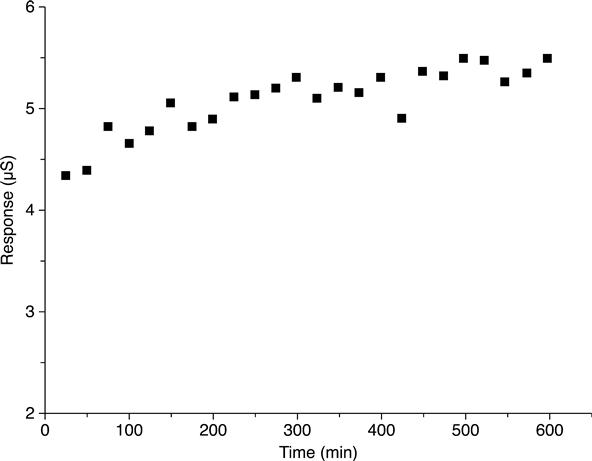
To estimate the operational stability of an L-arginine biosensor, continuous measurements of its sensitivity were carried out for 10 h. The relative standard deviation of the measurements was 4–5 %. The dependence ‘Response–Number of analysis’ (Fig. 6.4) showed that L-arginine biosensors had high operational stability. An increase in the biosensor response observed with time might be related to the variation of the local pH due to NH+4 accumulation within the bioselective membrane.
6.3.4 Biosensors for testing protein denaturation
Proteomics technologies are a useful tool for the identification of disease biomarkers. Many cellular changes in protein expression as response to an external stimulus or mutation can be expressed directly in protein sequence and structure. The amino acid sequence constituting a protein is the exact expression of the DNA sequence; a mutation in the encoding gene can induce the appearance of new protein properties or a change in protein activity. One of these changes can be the appearance or the disappearance of a protease cleavage site. The number of cleavage sites characteristic of a known protein can be used in these cases as a mutation marker.
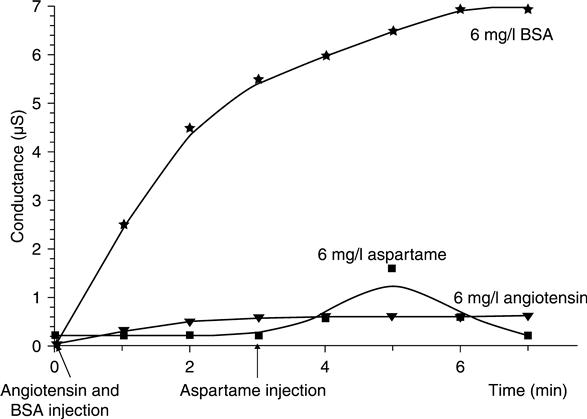
Conductometric microelectrodes were used (Hnaien et al., 2009) as a transducer to develop an enzyme biosensor based on proteinase K to quantify the number of the hydrolysis sites of different peptides and proteins. Aspartame was used for a negative test: there is no specific cleavage site for proteinase K (aspartame presents a short peptide sequence, ≥4 amino acids). Angiotensin, with only one cleavage site, allows the conductivity induced by the cleavage of only one site to be estimated. Bovine serum albumin (BSA), with many cleavage sites, allows us to show the cumulative induced conductivity as response to the enzyme action for many specific sites.
Aspartame injection does not induce any signal variation (Fig. 6.5). This peptide is resistant because it does not have any proteinase K cleaving site. This result allows us to form conclusions about the efficiency of the sensor to screen the presence or the absence of a cleaving site on peptide sequences. Figure 6.5 also shows the significant difference between angiotensin and aspartame response at an equal concentration, 6 mg/ml. At the steady-state equilibrium, conductometric responses were 0.18 μS in the case of aspartame and 0.6 μS in the case of angiotensin. The aspartame response does not follow the shape of a kinetic response. The rapid increase in the conductometric signal is related to the injection but not to proteinase K action.
The results obtained for native and denatured BSA show the potentiality of this proteinase K conductometric biosensor to be able to detect changes in protein conformation. A sample of BSA was denatured by heat at 100 °C for 20 min. Themonitoring of the induced conductivity as response to non-native BSA demonstrates that, for the same concentration of native and non-native BSA, the obtained conductivity is three times more important for non-native BSA (for a concentration of 8 mg/ml we obtained 8.72 μS in the case of native BSA and 28 μS in the case of non-native BSA).
Such a system could be applied for the study of some therapeutic proteins with the limitation of a short half-life. Microencapsulation of proteins and peptides improves the therapeutic efficiency of these bioactive materials, protects them against degradation and enhances sustained drug release. This method can modify the fragile nature of proteins. The control of the proteins’ properties constitutes an important objective. This can be controlled by conductometric biosensors; it is possible to monitor the properties and release kinetics as a function of time (Hnaien et al., 2011).
6.4 Conductometric enzyme biosensors based on direct analysis – II: Biosensors for environmental applications
6.4.1 Biosensors for formaldehyde determination
Formaldehyde determination in food, the environment and biological fluids is also essential, since it is one of the most widespread commercial products due to its chemical activity, technological prerequisites of high purity, and rather low cost (Gerberich and Seaman, 1994). The challenge has become stronger recently due to the realization of formaldehyde’s high toxicity (Schechter and Singer, 1995), mutagenicity and carcinogenicity (Feron et al., 1991). This has been ascertained by experiments with microorganisms (mutagenic effect), mice and rats (cancer development) (Squire and Cameron, 1984).
A conductometric enzyme biosensor for determination of formaldehyde in aqueous solutions has been developed using interdigitated thin-film planar electrodes and immobilized alcohol oxidase (AOX) from Hansenula polymorpha (Dzyadevych et al., 2001). The enzymatic reaction was:
[6.5]
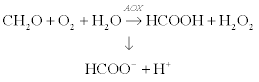 [6.5]
[6.5]
The calibration curves obtained in buffer solutions of various buffer capacities (Fig. 6.6) demonstrate identical upper, but different lower, measurement limits. The biosensor steady-state response was reached after about 1 min. The lower measurement limit in 1 mM phosphate buffer was 0.05 mM (0.15 ppm) formaldehyde concentration, which is adequate for Occupational Safety and Health Administration standards (EH40/94, 1994).
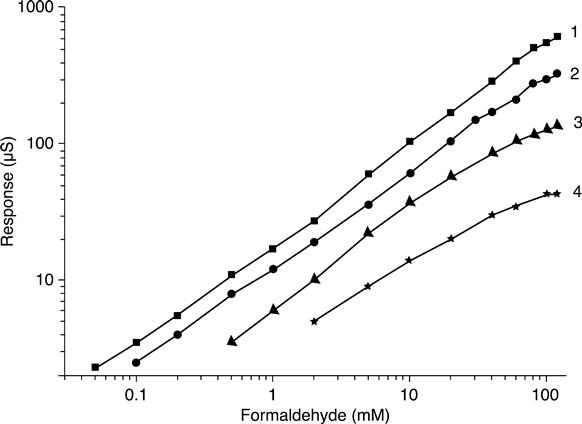
For different durations of alcohol oxidase immobilization (Fig. 6.7), a shift of calibration curves towards both low and high formaldehyde concentrations was observed.
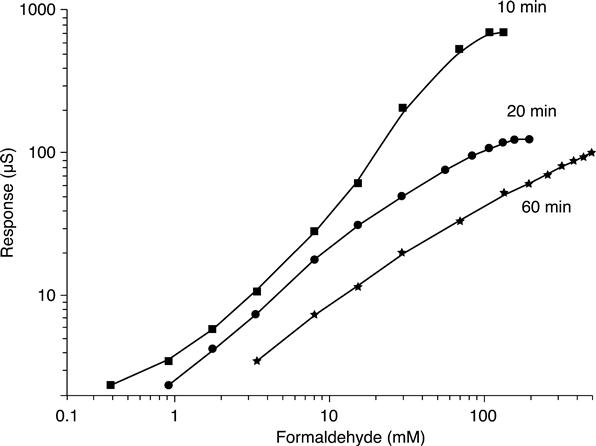
In the case of long immobilization, decrease in the response value as well as wider operation range for high substrate concentrations can be the result of formation of numerous covalent bonds between glutaraldehyde and enzyme molecules, which cause partial blocking of the enzyme active centres. Besides, such a dense membrane is capable of diminishing diffusion of the substrate and of products of the biochemical reaction, and thus obtaining a wider range of measurable formaldehyde concentrations – up to 500 mM. On the other hand, in the case of a short immobilization time, the sensor demonstrated higher sensitivity and ability to measure low concentrations.
Therefore, the linear range of alcohol oxidase-based conductometric biosensors covers a formaldehyde concentration of 0.05 mM to 500 mM, and can be adjusted to actual practical needs by modifying both options of enzyme immobilization and measurement protocols.
The biosensor developed was not absolutely specific and selective. It demonstrated no response to primary alcohols and other substrates alone. Unfortunately, the response of this biosensor in a mixture of formaldehyde and methanol was decreased in comparison with the one observed for pure formaldehyde, even if no response was obtained with the interfering species alone. The operational stability was not less than 20 h and the relative standarddeviation appeared to be about 3 %. Moreover, the storage stability was more than 1 month.
6.4.2 Biosensors for proteins determination
As proteins constitute more than 30 % of total chemical oxygen demand (COD) in the effluents, they seem to constitute a good indicator of the organic matter content. However, the most widely used methods for protein analyses are based on classical laboratory methods using colorimetric procedures, which are not convenient for in situ monitoring of organic matter content.
Conductometric biosensors for protein determination were developed based on the enzyme proteinase K (Marrakchi et al., 2005, 2007). Proteinase K hydrolyses proteins into different ionic amino acids, which results in local conductivity changes. In this work, the biosensor response using BSA as standard protein was optimized.
The dependence of the steady-state responses of the proteinase K-based conductometric biosensor on the concentration of BSA is shown in Fig. 6.8.
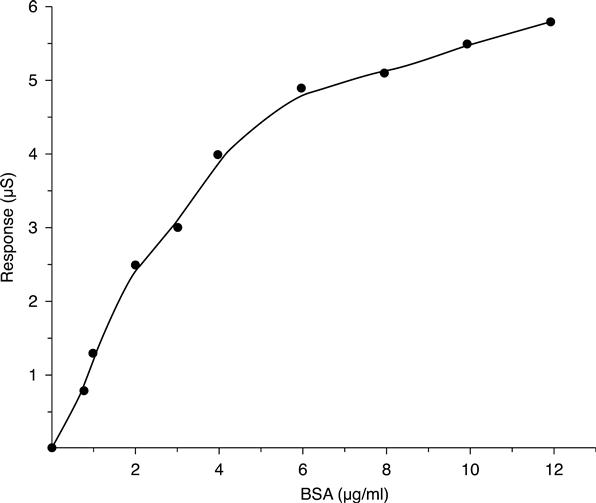
The linear range for BSA determination was from 0.8 to 6 μg/ml with good sensitivity. After 6 μg/ml we have a saturation phenomenon. This range of response obtained with the biosensor is in adequate agreement with the values of the real concentrations of proteins in river water. Then, the response of thebiosensor was tested with samples of river water. Good correlations between conductance changes and values given by standard methods (COD and protein concentration evaluated by microBCA protein assay) were shown. Correlation coefficients of 0.89 and 0.92, respectively, were obtained.
In the next work (Khadro et al., 2009), two enzymes, proteinase K and pronase, were used for creation of conductometric biosensors for protein detection. The biosensor with a mixture of proteinase K and pronase gave a higher signal and a response in close agreement with the variations in total organic carbon and organic nitrogen concentrations. This biosensor was selected and compared with the first conductometric biosensor for protein detection (Marrakchi et al., 2005, 2007). In fact, the pronase composition (endo- and exopeptidases, in particular chymotrypsin, trypsin, carboxypeptidase and aminopeptidase) and the association with proteinase K conferred on the biosensor the capability to catalyse the hydrolysis of all the different proteins contained in the water samples.
The optimum conditions for the preparation of the biosensor increased the sensitivity and gave a limit of quantification of 0.583 μg.l−1 for total organic carbon and of 0.218 μg.L−1 for organic nitrogen in water samples. This sensor shows good reproducibility (2.28 %), the capacity to be used at temperatures varying between 10 and 30 °C (temperature depending on the season), and a long lifetime (5 weeks).
6.4.3 Biosensors for phosphate determination
Phosphate is an essential nutrient for the growth of aquatic plants. Because of its widespread presence in detergents and fertilizers, increased phosphate concentration can lead to eutrophication of lakes and rivers. In clinical diagnosis, the determination of phosphate levels in body fluids can provide useful information about several diseases, the energetic state of cells and bone function. Additionally, an excess diet of phosphate in food products will affect human health. Thus, phosphate determination is also relevant to food quality control.
A conductometric biosensor for phosphate determination was reported, using maltose phosphorylase with the following reaction sequence (Zhang et al., 2008):
[6.6]
The conductometric biosensor has two linear ranges, one from 1.0 μM to 20 μM phosphate with a detection limit of 1.0 μM, and the other from 20 μM to 400 μM phosphate (Fig. 6.9). For the first linear section, the regression equation is AS (μS) = 0.182 + 0.298 [phosphate] (μM), R2 = 0.994, and forthe second section, the equation is ΔS (μS) = 3.820 + 0.133 [phosphate] (μM), R2 = 0.999.
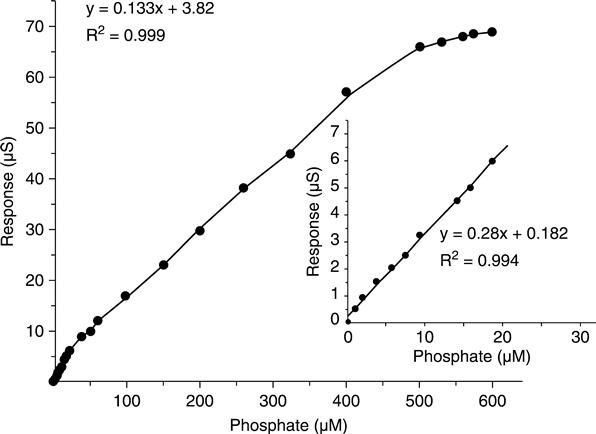
No interference from other anionic species was detected. Moreover, the conductometric biosensor presented here has long-term storage and operational stability as well as a good thermal stability. The practical use of this biosensor in determination of phosphate in real samples (wastewater, river water, etc.) is being investigated.
6.4.4 Biosensors for nitrite determination
Water containing a high concentration of nitrite can create serious problems, such as eutrophication and potential hazards to human health. Eutrophication in rivers, lakes and coastal waters has become one of the most prevalent environmental problems. On the other hand, with many potential hazards to human health, nitrite has been considered to be a major toxic agent. Nitrite promotes the irreversible oxidization of haemoglobin to methaemoglobin and reduces the blood’s capacity to transport oxygen. In addition, nitrite in the body can be converted into carcinogenic N-nitrosoamine compounds. Consequently, there is a growing demand to detect nitrite in food, drinking water and environmental samples.
Zhang et al. (2009) presented a conductometric nitrite biosensor based on the co-immobilization of cytochrome c nitrite reductase (ccNiR), BSA, Nafion®, methyl viologen (MV) and glycerol with saturated glutaraldehyde vapour on an IDE. ccNiR is usually purified and stored in an oxidized form. However, this enzyme will only be active in a reduced state, which can be achieved using an artificial electron donor such as MV in the reduced state (MV•+). MV’s electrochemical behaviour involves reduction of the oxidized state (MV2+). With sodium dithionite, MV2+ can be reduced to MV•+, which further reduces ccNiR to the active state.
In addition, since viologens are highly water-soluble, any practical device containing the electron mediator should be based on immobilized viologens. The structure of MV2+ contains a hydrophobic part, which is capable of hydrophobic–hydrophobic interaction with Nafion®, and two cationic pyridinium groups that undergo ion exchange with the sulphonate sites of Nafion® polymer chains, according to the following reaction:
[6.7]
This interaction results in MV2+ accumulation in the membrane. In the presence of sodium dithionite as electron donor, the biocatalysed reduction of NO−2 to NH+4 is stimulated. The reaction is as follows:
[6.8]
A calibration curve of the optimized nitrite conductometric biosensor is shown in Fig. 6.10.
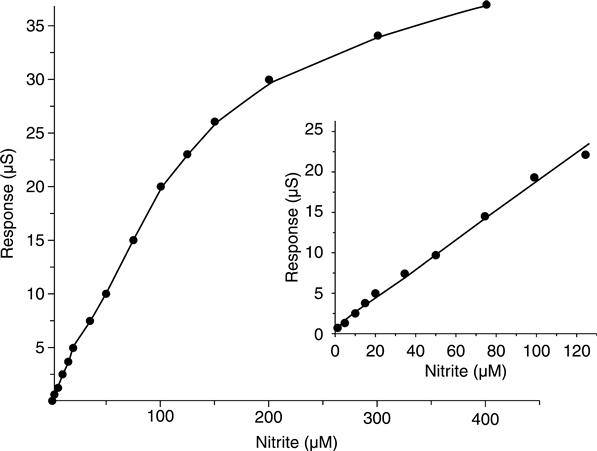
From this figure, the linear regression equation is: ΔS (μS) = 0.1250 + 0.1972 [NO2−] (μM), R2 = 0.9993. The optimized biosensor exhibited a rapid response tonitrite (about 10 s), a linear range of 0.2–120 μM nitrite, a sensitivity of 0.194 μS/μM [NO−2], and a low detection limit of 0.05 μM.
The conductance response of the sensor was found to be fairly stable during the first week, and then to drop gradually with time. After about 3 weeks, it still maintained over 50 % of the initial response. Other experiments showed that the conductometric biosensor could be maintained at about 75 % of the initial response for about 1 month when the checking was reduced to less than five times within that period.
No obvious interference from other ionic species familiar in natural waters was detected. The application experiments show that the biosensor is suitable to be used for real water samples.
6.4.5 Biosensors for nitrate determination
A highly sensitive, rapid and stable conductometric enzyme biosensor for determination of nitrate in waters was described in Wang et al. (2006a,b). The conductometric electrodes were modified by MV mediator mixed with nitrate reductase from Aspergillus niger by cross-linking with glutaraldehyde in the presence of BSA and Nafion® cation-exchange polymer, allowing retention of the viologen mediator according to the following ion exchange reaction:
[6.9]
The enzymatic reaction for the reduction of nitrate is as follows
[6.10]
Using the optimum conditions obtained in the above studies, a calibration curve of the conductometric nitrate biosensor was obtained over a nitrate concentration range of 0.02–0.5 mM using the biosensor in 5.0 mM phosphate buffer at pH 7.5. As shown in Fig. 6.11, the MV/Nafion modified electrode showed a linear response in a concentration range of 0.02–0.25 mM; the linear regression equation was ΔS (μS)= 1.1058 + 30.469 [NO−3] (mM), R = 0.9975. The detection limit of 0.005 mM of nitrate was obtained with a signal-to-noise ratio of 3. It has been reported that the oxygen interference is not negligible during the detection because the reduced viologens (MV•+) can be auto-oxidized by oxygen. A calibration curve of the nitrate conductometric biosensor was also obtained in non-deoxygenated buffer (Fig. 6.11), which was comparable to that in nitrogen-saturated buffer. At the same time, we find that, although the relative standard deviation obtained is higher in air-saturated buffer (9 %) than in nitrogen-saturated buffer (6 %) (n = 10), the difference is not very significant. These results confirm that in the presence of oxygen the interfering response is not significant, which is due to the excessive sodium dithionite that depletes the oxygen in the buffer solution.
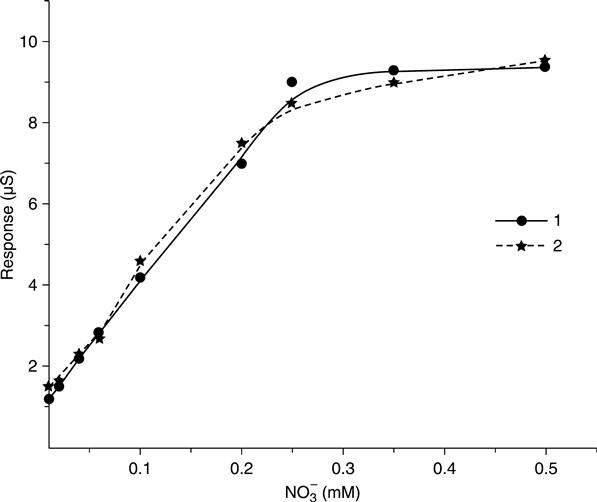
Linear calibration in the range of 0.02 and 0.25 mM with detection limits of 0.005 mM nitrate was obtained with a signal-to-noise ratio of 3. When stored in 5 mM phosphate buffer (pH 7.5) at 4 °C, the sensor showed good stability over two weeks.
The developed nitrate conductometric biosensor was used to determine nitrate in some water samples using the method of standard addition. The results indicate that the nitrate conductometric biosensor can be successfully applied to the determination of nitrate at concentrations normally present in water samples. Further practical use of the nitrate conductometric biosensor in determination of nitrate in real samples is being investigated.
6.5 Conductometric enzyme biosensors based on direct analysis – III: Biosensors for agribusiness applications
6.5.1 Biosensors for sucrose determination
Sucrose, a key component of molasses, is used in food industry as liquid sugar; some special sugars are used in pharmaceuticals and the cosmetic industry. Since sucrose is a component of foodstuffs and beverages, precise information on the presence and concentration of sucrose is very important for assessment of their quality (Soldatkin et al., 2008).
The basic cascade of enzymatic reactions for sucrose detection by conductometric biosensor is as follows:
[6.11]
[6.12]
[6.13]
 [6.13]
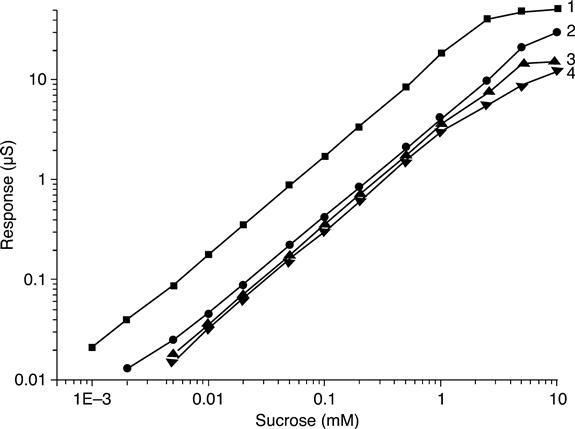
Calibration curves of dependence of the biosensor responses on the sucrose concentration in buffer solution are plotted for various buffer capacities of the solution (Fig. 6.12). The biosensor responses and linear range of measurements are seen to vary to some extent when the concentration of buffer solution changes. The highest sucrose sensitivity of the conductometric biosensor was in 2.5 mM phosphate buffer, pH 7.2; however, the linear range in this case shifts towards the region of low concentrations, i.e. 0.001–2.5 mM (Fig. 6.12, while in 5 mMphosphate buffer the linear range was slightly wider (0.002–5 mM). In 10 and 20 mM phosphate buffers the biosensor sensitivity towards sucrose slightly decreased. Therefore, required sensitivity of the biosensor for measurement of sucrose concentration in given ranges can be attained by varying buffer concentration, and thus adapted to the actual practical needs.
Operational stability and signal reproducibility, essential characteristics of biosensors, were tested. The responses to the same sucrose concentration (0.5 mM) were measured every 30 min for 4 days; the sensor was kept in a continuously stirred buffer between measurements. At night, biosensors were stored dry at room temperature. The chosen sucrose concentration was on the linear region of the sensor calibration curve. The measurement data were highly reproducible every day of the experiment, while sufficient operational stability was demonstrated for a week.
6.5.2 Biosensors for lactose determination
Lactose is of great significance in physiology due to its stimulating action on the nervous system, and its prophylactic and therapeutic effect upon cardiovascular diseases. In humans, lactose promotes calcium, manganese and magnesium absorption and sustains Bifidobacteria growth; besides, it inhibits pathogenic flora in the intestine due to the generation of lactic acid resulting from lactosebreakdown. For lactic acid bacteria, lactose is a main energetic source of lactic acid fermentation, which is the basis for production of numerous cultured milk foods. In the milk processing industry, lactose is used as a crystallization inoculant for concentrated milk production.
A conductometric biosensor for lactose determination is based on the following cascade of enzymatic reactions (Pyeshkova et al., 2008):
[6.14]
[6.15]
[6.16]
 [6.16]
Dependence of the biosensor response on lactose concentration at different buffer concentrations is presented in Fig. 6.13. The change in buffer solution concentration is seen to result in varying biosensor response and measurement linear range. In20 mM and 30 mM phosphate buffer, the biosensor sensitivity to lactose and linear range dropped considerably.
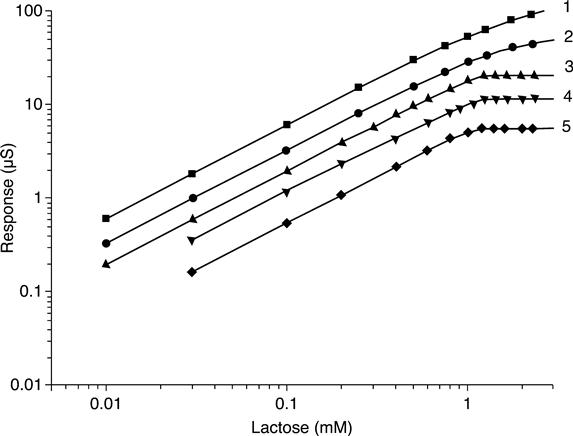
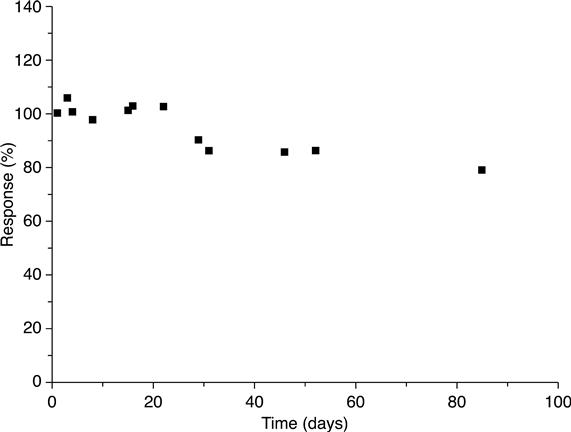
Storage stability was studied (Fig. 6.14) to evaluate the potential of the developed biosensor to be commercialized. The biosensors were stored dry at +4 °C. The response to addition of 0.1 mM lactose to the model solution, obtained on the first day, was taken to be 100 %. Further measurements were carried out at intervals (3–8 days). The biosensor activity dropped by 22 % during 3 months.
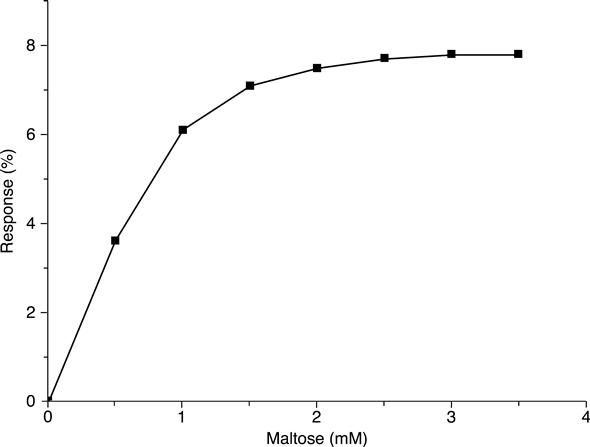
6.5.3 Biosensors for maltose determination
Due to their unique characteristics, maltose syrups are used in the production of a wide range of confectionery (caramel, frozen dairy produce, jellies, canned fruits, etc.). Besides, maltose is frequently used in food manufacture, particularly in the production of foodstuffs for children, due to its low allergenicity. Maltose is used in the manufacture of dietetic and sports foodstuffs, bread, wine, preserves and beverages. Furthermore, maltose is utilized in microbiology and pharmacology. In organisms, maltose is decomposed into two glucose molecules when exposed to the enzyme maltase (α-glucosidase) present in the digestive juices of animals and humans. Genetically determined absence of maltase in the mucous coat of human intestine causes congenital intolerance to maltose, a severe disease that requires maltose, starch and glycogen to be eliminated from the diet and supplementation with maltase.
A conductometric biosensor with a three-enzyme membrane as sensitive element has been developed for maltose determination. Its analytical characteristics for model samples (response dependence on pH, ion strength, buffer capacity of working solution) were investigated (Pyeshkova et al., 2009). The basic cascade of enzymatic reactions for maltose detection by conductometric biosensor is as follows:
[6.17]
[6.18]
[6.19]
 [6.19]
Calibration curves of the maltose conductometric biosensor are shown in Fig. 6.15. The linear range of biosensor operation was up to 1 mM and the minimum measurable concentration of maltose was 0.002 mM.
Selectivity as an essential characteristic of the conductometric maltose biosensor was studied by determination of its reaction to the content of interfering substances. Measurements were carried out in 5 mM phosphate buffer solution, pH 6.5. The interfering substances at 0.5 mM concentration were introduced into the cell; the response to 0.5 mM maltose was taken as 100 % (Table 6.1). Basically, the tested conductometric system was shown to be selective and, thus, can be suggested for further application in the analysis of real samples. The maltose biosensor response to glucose is quite comprehensible, since glucose oxidase is a component of the enzyme membrane. This is why, in order to measure maltose when glucose is present in the samples tested, another sensor, sensitive only to glucose, should be used along with the maltose sensor.
6.6 Conductometric enzyme biosensors based on inhibition analysis
6.6.1 Biosensors for organophosphorus pesticides determination
Tons of pesticides annually used in agriculture and horticulture can degrade in the environment by microbial and photodegradation, and chemical hydrolysis. During these transformation processes, intermediate products, which may be more toxic than the initial products, are generated. These toxic compounds contaminate air, soil and water over large areas. Consequently, it is necessary to develop tests for toxicity assessment of environmental samples.
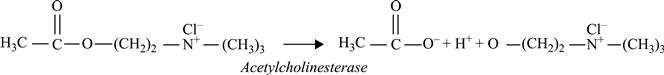
The conductometric biosensor based on inhibition analysis, first described in Dzydevich et al. (1994), was intended for the determination of organophosphorus pesticides. As a sensitive element, the enzymes acetyl- and butyrylcholinesterase were used.
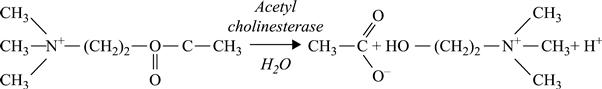 [6.20]
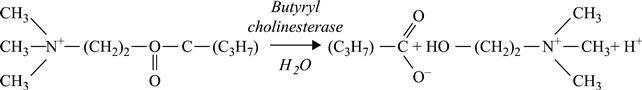 [6.21]
The determination of organophosphorus and carbamate compounds is based on their ability to inhibit cholinesterases by interaction with the serine –OH group in the enzyme active site, according to the following reaction (example of the organophosphorus compound trichlorfon):
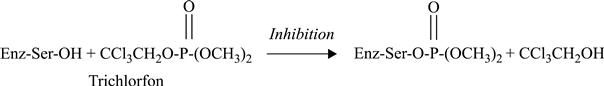 [6.22]
The decrease in cholinesterase activity after its interaction with pesticides can be effectively monitored by the conductometric biosensors, facilitating the toxicity assessment of organophosphorus and carbamate pesticides.
The sensor sensitivity to different pesticides was investigated (Dzyadevych et al., 2005). The calibration curves of a conductometric acetyl cholinesterase (AcChE) biosensor for different pesticides are shown in Fig. 6.16. They are linear in a semi-logarithmic plot for all pesticides tested. Detection limits, determined as the inhibitor concentration giving a decrease of the substrate signal equal to three times the blank value, were: 5.0 × 10⁻¹¹ M for diisopropyl fluorophosphate, 1.0 × 10⁻⁸ M for paraoxon-ethyl, 5.0 × 10⁻⁷ M for paraoxon-methyl, 3.0 × 10⁻⁷Mfor trichlorfon, 5.0 × 10⁻⁶ M for parathion-methyl and 2.0 × 10⁻⁶ M for carbofuran.
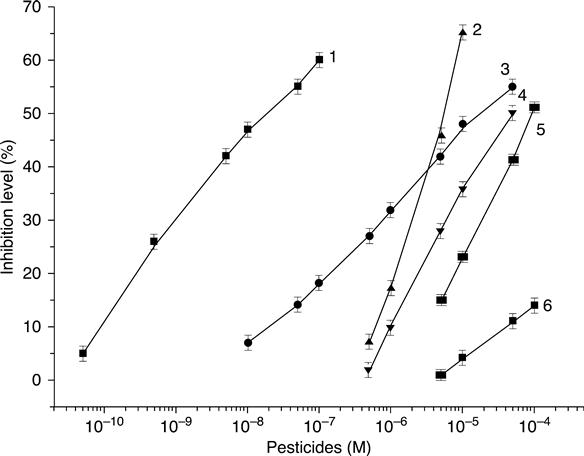
The possibility of reactivation of enzyme in the membrane by means of the reactivator pyridine-2-aldoxime-methiodide, according to the following reaction, was shown.
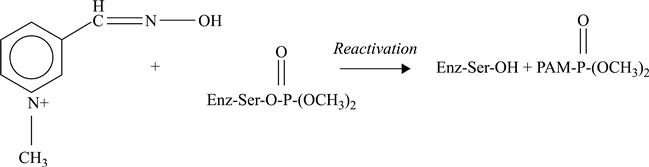 [6.23]
The conclusion was drawn that the described biosensors could be used for the analysis of organophosphorus pesticides in aqueous solutions.
Conductometric biosensors applied to the analysis of total solution toxicity at parathion-methyl photodegradation have been presented (Dzyadevych and Chovelon, 2002; Dzyadevych et al., 2002). The results obtained were comparedwith data from the traditional high-sensitivity method of high-performance liquid chromatography and from the Lumistox device (Germany) for toxicity determination. The solution toxicity was shown to increase dramatically as pesticide photodegradation began (Fig. 6.17); the toxicity remained once the parathion-methyl dissociation had been completed.
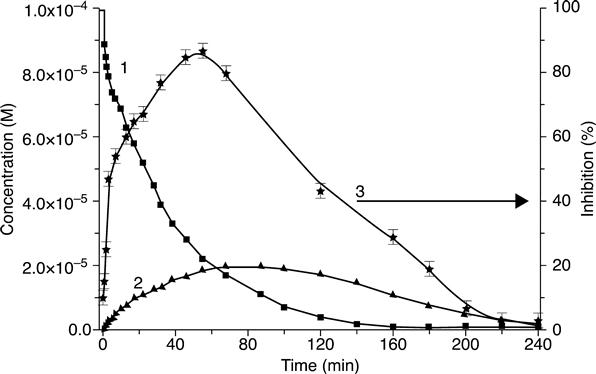
This sensor could be used as a rapid technique (‘early warning system’) for measuring cholinesterase inhibitors present in the environment.
6.6.2 Biosensors for heavy metal ions determination
Heavy metals and their compounds in the environment are characterized by relatively high stability, solubility in atmospheric precipitation, and ability to be absorbed by soil and plants. They are accumulated in organisms, being toxic in any state for humans and animals with a wide spectrum and variety of harmful effects.
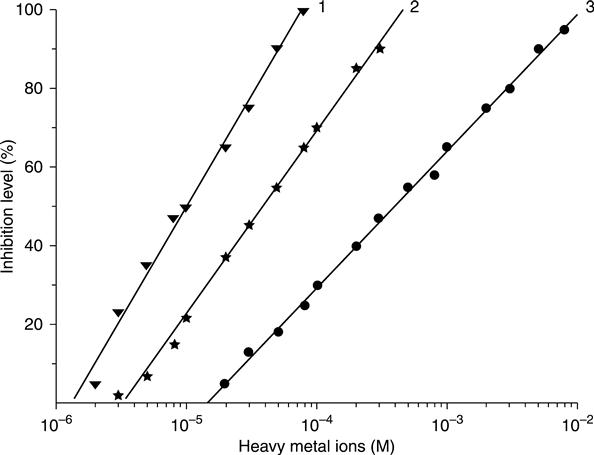
The potential of a conductometric urease biosensor for the determination of heavy metal ions was demonstrated in Zhylyak et al. (1995). This reaction is similar to the generation of metal sulphides; therefore, the metals capable offorming insoluble sulphides are strong urease inhibitors. The assay protocol included measurement of the biosensor response to a fixed concentration of urea before and after the incubation of the biosensor for a definite time in a solution containing heavy metal ions.
The calibration curves obtained with immobilized urease are presented in Fig. 6.18. The inhibition activities of heavy metals towards urease varied as follows: Hg2+ > Cu2+ > Cd2+ > Co2+ > Pb2+ > Sr2+; reactivation of the inhibited enzyme with ethylenediaminetetraacetic acid (EDTA) was shown to be probable.
In Soldatkin et al. (2012) a three-enzyme system, i.e. invertase, mutarotase and glucose oxidase, immobilized on the transducer surface was used as the bioselective element of a conductometric biosensor. An enzyme ratio in the membrane was found experimentally, considering the highest biosensor sensitivity both to the substrate (sucrose) and to heavy metals. The optimal concentration of sucrose for inhibitory analysis was 1.25 mM, and the incubation time in the investigated solution amounted to 10–20 min. The developed biosensor demonstrated the best sensitivity towards Hg2+ and Ag+ ions. The possibility in principle of the biosensor being reactivated by EDTA solution after inhibition with silver ions or by cysteine solution after inhibition with mercury ions was shown. The results of biosensor analysis of toxicants in real water samples were in good correlation with the results obtained by traditional methods.
6.6.3 Biosensors for surfactants determination
Surfactants are one of the widespread pollutants of the surroundings. The physical and chemical properties of surfactants lead to wide application of these substances in industry, medicine, agriculture and everyday household use. They are an integral part of means of personal hygiene, numerous washing and cleansing agents, etc. After being used, surfactants are discharged into the environment in huge volumes, which results in contamination of water ecosystems. Furthermore, due to their ability to increase solubility of other pollutants, the latter appear in water in higher concentration.
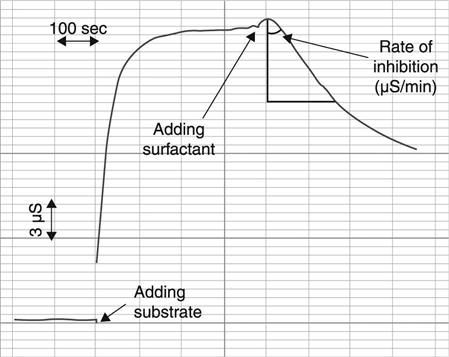
A conductometric biosensor for determination of surfactants in aqueous solutions, based on inhibition of acetylcholinesterase, was studied (Kucherenko et al., 2011). The procedure for surfactant determination by conductometric biosensors is shown in Fig. 6.19. First, the response to the saturating concentration of substrate was obtained. Next, the surfactant was added and the signal decrease was recorded. The rate of bioselective element inhibition (μS/min) changed depending on the surfactant concentration, which allowed calibration curves to be obtained for surfactant determination in the tested sample.
Some variants of inhibitory determination of surfactants were examined; the biosensor sensitivity to benzalkonium chloride (0.061 g/l), sodium dodecyl sulfate (2.5 μM) and hexadecylpyridinium bromide (2.5 μM) was tested by the optimal procedure. The optimum value of pH was determined to be 6.0. The effect of ionic strength and of buffer capacity on the biosensor sensitivity to the substrate and inhibitor was analysed, and the composition and concentration of the working buffer were optimized. The developed biosensor was proved to have high signal reproducibility for both direct measurement of the key substrate, acetylcholine, and inhibitory determination of benzalkonium chloride.
6.6.4 Biosensors for detection of diuron and atrazine
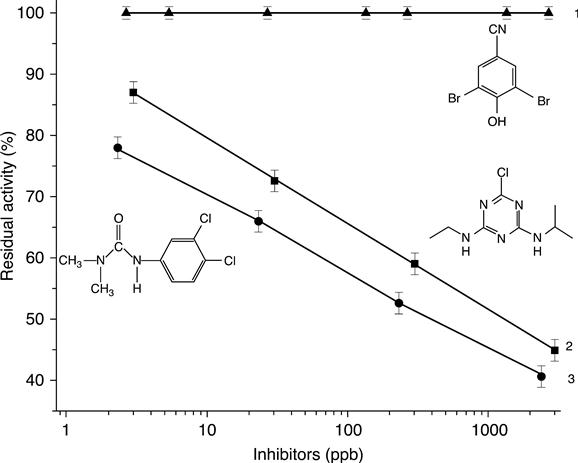
A conductometric biosensor for the detection of some toxic compounds, including diuron, atrazine, its main metabolites (desisopropylatrazine and deethylatrazine) and copper ions, based on tyrosinase inhibition, was developed in Mai Anh et al. (2004, 2006).
Under the experimental conditions employed, using 4-chlorophenol as enzyme substrate and 30 min of contact with tyrosinase inhibitor, detection limits for diuron and atrazine were around 1 ppb and dynamic ranges of 2.3–2330 ppb and 2.15–2150 ppb were obtained for diuron and atrazine respectively (Fig. 6.20).
Generally, in the environment, the pesticides are transformed into different metabolites by various degradation processes, including photo- and biodegradation. For example, atrazine commonly coexists with its two main metabolites, i.e. degradation products, desisopropylatrazine and diethylatrazine. It was shown that inhibition of tyrosinase by desisopropylatrazine and diethylatrazine was less than by atrazine.
The different samples tested were solutions containing diuron, atrazine, copper, lead and zinc ions, mixtures of copper/atrazine or copper/diuron and real water samples coming from a Vietnamese river. In the last case, classical techniques such as gas chromatography–mass spectrometry or atomic absorption spectrometry were used in order to estimate exact concentrations of these species in real water samples. Results have shown that such a biosensor could be used as an early warning system for the detection of these pollutants, as no matrix effect coming from the real sample was observed and no synergetic or antagonistic effects were found for the mixture of toxic compounds. In addition, results were coherent with the content of the tyrosinase inhibitors.
6.6.5 Biosensors for nitrite determination
Another work (Zazoua et al., 2009) described a conductometric biosensor using a combination of peroxidase/catalase. Horseradish peroxidase (HRP) was locatedin the inner layer while the outer contained catalase. Catalase catalysed the breakdown of H2O2 into H2O and O2, thus totally consuming H2O2, the substrate of HRP. The latter, in the presence of H2O2, generates a conductometric signal due to the reduction of H2O2. Nitrite was selected as an inhibitor of catalase. In the presence of H2O2, the nitrite addition blocked the H2O2 consumption by catalase. Since nitrite has no effect on HRP activity, its inhibitory effect on catalase leads to an increase in the conductometric signal. The bi-enzyme sensor exhibits an increase in conductometric response for nitrite concentration, leading to high values of conductivity. In both cases, the detection limit of nitrite is 0.3 μM, and for the bi-enzyme sensor the dynamic range is from 0.3 to 446 μM.
6.6.6 Biosensors for cyanide determination
Cyanide is continuously released in small doses in the environment and is considered a violent poison that constitutes a real hazard for aquatic ecosystems. It is naturally produced by certain bacteria, fungi and algae, and found in many foods and plants. Cyanide is also widely used in industry for the manufacture of synthetic fibres and plastics, as well as in electroplating baths and metal mining operations, or pesticide agents and intermediates in agricultural chemical production.
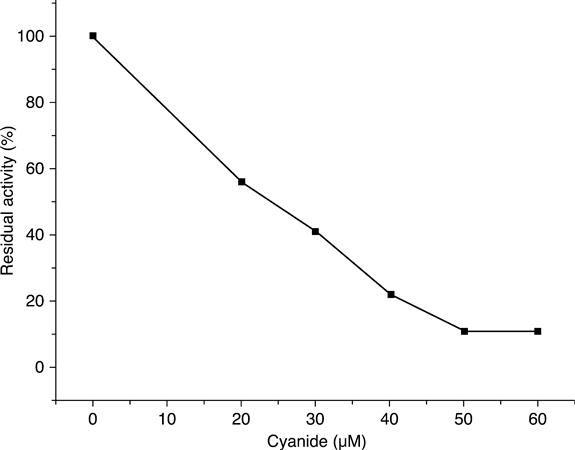
In Bouyahia et al. (2011) a conductometric biosensor for cyanide determination was prepared through immobilization of bovine liver catalase in a photoreticulated poly(vinyl alcohol) membrane. This biosensor was used to study the kinetics of the catalase–H2O2 reaction and its inhibition by cyanide.
Inhibition by cyanide was found to be non-competitive. The decrease of the biosensor response by increasing cyanide concentration was linear up to 50 μM. with a cyanide detection limit of 6 μM (Fig. 6.21).
The apparent inhibition binding constant was determined from the Dixon plots for different H.O2 concentrations to be 13.9 μM. The inhibition coefficient I50, measured by conductometric biosensors, was 24.9 μM. This showed great potential of conductometric biosensors for quantitative analysis of cyanides.
6.7 Whole cell conductometric biosensors
A conductometric biosensor using immobilized Chlorella vulgaris microalgae as bioreceptors was used as a bi-enzymatic biosensor in (Chouteau et al., 2004, 2005). The use of microorganisms for multi-detection can be a good alternative, each living cell containing a large number of enzymes. Local conductivity variations caused by algal alkaline phosphatase and acetylcholinesterase activities could be detected using the following enzymatic reactions (Fig. 6.22):
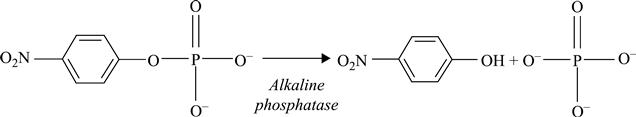 [6.24]
 [6.25]
These two enzymes are known to be inhibited by distinct families of toxic compounds: heavy metals for alkaline phosphatase, carbamates and organophosphorus pesticides for acetylcholinesterase. The bi-enzymatic conductometric biosensors were tested to study the influence of heavy metal ions and pesticides on the corresponding enzymes. It appears that these biosensors are quite sensitive to Cd2+ and Zn2+ (limit of detection (LOD) = 10 ppb for a 30 min exposure) while Pb2+ gives no significant inhibition, as this ion seems to adsorb preferably on albumin. For pesticides, first experiments showed that paraoxon-methyl inhibits Chlorella vulgaris AChE, contrary to parathion-methyl andcarbofuran. Biosensors were then exposed to different mixtures (Cd2+/Zn2+, Cd2+/paraoxon-methyl) but no synergetic or antagonistic effect could be observed. A good repeatability could be achieved with biosensors, since the relative standard deviation did not exceed 8 %, while the response time was 5–7 min.
6.8 DNA-based conductometric biosensors
A conductometric DNA biosensor was first described for modified genetic soybean detection (Phuong Dinh et al., 2007). The probe sequence was (5′GCCATCGTTGAAGATGCCTCTGCC-3′), which can hybridize with the CaMV 35S promoter of Roundup Ready soybean, which was attached onto the surface of the sensor by means of 3-aminopropyl triethoxy-silane (APTS). The DNA sequence bindings were identified by Fourier transform infrared spectroscopy.
The hybridization of DNA strands changes conductance close to the surface of the DNA sensor, leading to a change in output signal of the system. This event is shown in Fig. 6.23, where the output signal due to hybridization is a function ofDNA target strands concentration. When the matching hybridization between DNA probe strands and DNA target strands is 100 % the sensitivity of the DNA sensor is 4.28 μV/pM. The fast response time of the DNA sensor was less than 1 min, which is one of the strong points of this kind of DNA sensor for the feasibility of in-field/on-site detection.
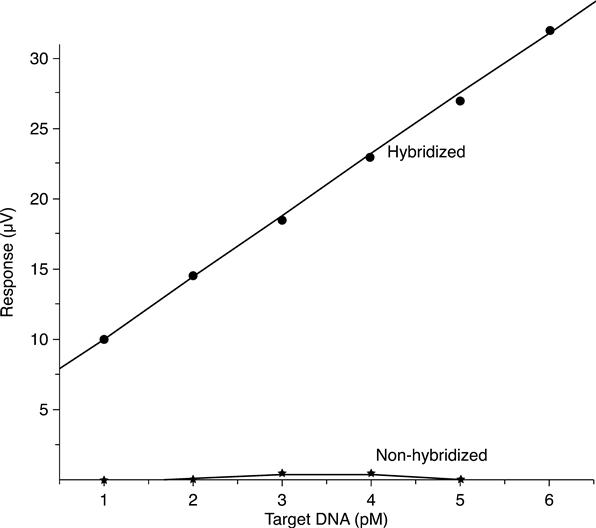
The influence of hybridization temperature on output signal of the DNA conductometric sensor was also investigated. The range between 30 °C and 50 °C can be considered the optimal matching temperature to detect hybridization of this DNA sequence.
6.9 Conductometric biosensors for detection of microorganisms
A conductometric biosensor for detecting Mycobacterium avium subsp. paratuberculosis antibodies was described in Okafor et al. (2008). In this study, a polyaniline-based conductometric biosensor, in an immunomigration format, was fabricated for the detection of serum antibody (IgG) against the causal organism of Johne’s disease, Mycobacterium avium subsp. paratuberculosis (MAP). Immobilized Mycobacterium avium purified proteins in the capture membrane were used to detect MAP IgG, previously bound with Pani/anti-bovine IgG conjugate in the conjugate membrane. After detection, the polyaniline in the sandwiched captured complex bridged the silver electrodes. The electrical conductance caused by polyaniline was measured as a drop in electrical resistance. Testing of the biosensor with known Johne’s disease positive and negative serum samples demonstrated a significant difference in the mean resistance observed between the groups. This proof-of-concept study demonstrated that a conductometric biosensor could detect MAP IgG in 2 min. The biosensor’s speed of detection and the equipment involved would, among other things, support its application for the various point-of-care opportunities aimed at Johne’s disease management and control.
In Hnaiein et al. (2008) a conductometric immunosensor based on functionalized magnetite nanoparticles was described for Escherichia coli detection. Biotinylated anti-Escherichia coli antibodies were immobilized on streptavidin- modified magnetite nanoparticles by biotin-streptavidin interaction. The specific test with Escherichia coli cells and the non-specific test using Staphylococcus epidermidis were investigated by conductometric measurements. The results showed a good response as a function of cell concentration. The detection of 1 colony-forming unit (CFU)/ml of E. coli induced a conductivity variation of 35 μS. The negative test showed good selectivity using the conductometric immunosensors. The conductometric biosensor was able to detect 500 CFU/l.
6.10 Conclusions
The application of conductometric measuring method to continuous recording in the course of enzyme processes has been thoroughly examined and analysed. Almost all electrochemical analytical methods are based on electrochemical reactions (potentiometry, voltamperometry, amperometry, coulometry). Conductometry is a method in which either there are no electrochemical reactions on the electrodes at all, or there are secondary reactions that can be neglected. Therefore, in the conductometric method the most important property of the electrolytic solution, in the boundary layer, is its conductivity, which varies in accordance with quite a wide range of biological reactions.
The conductometric biosensors also have some advantages over other types of transducers. First, they can be produced through inexpensive thin-film standard technology. This, along with using an optimized method of immobilization of biological material, results in a considerable decrease in both primary cost of devices and the total price of analyses. For integral microbiosensors it is easy to perform a differential measurement mode, thus compensating for external effects and considerably increasing measurement accuracy.
The data are convincing evidence of the great potential of conductometric biosensors. However, it is still rather a novel trend in the field of biosensors, which is why the development of commercial devices has a promising future.