3
Observation
3.1 Introduction
It’s no coincidence that the most influential social studies of modern urban public space have started with street-level observation. Jane Jacobs’ analysis of the American city’s daily ‘sidewalk ballet’ (1961), William H. Whyte’s documentation of the social life of New York public spaces (1980), and Jan Gehl’s ongoing inquiry into human interactions with the urban built environment have all changed the course of mainstream thinking about how cities should work. And as Gehl and Svarre (2013) argue, this has been achieved only by being out on the street, systematically observing what people do in the real world.
Observation as a research technique derives from anthropology, the study of humans as social animals in their natural settings. It gives designers rich opportunities to understand real life behaviour and activity in all its complexity, and to examine people’s relationships with places and environments; for instance, product design and UX use observation extensively to see how people use products and to test prototypes. However, observation alone doesn’t provide an adequate basis for decision-making. It complements other research methods but offers no voice or influence to end-users. This chapter looks at applications for observation techniques, some approaches to gathering qualitative and quantitative data from observation, and working with the material gathered.
Observation
Methodology type:
qualitative | quantitative
Level of participation:
none
Time/resource needed for data collection:
high
Time/resource needed for data analysis:
high
Useful for:
understanding site context
understanding behaviour/interactions/use of space
site planning/generating ideas
3.2 Observation-Based Approaches
Participant and non-participant observation
There are two distinct approaches to observation: participant and non-participant (or naturalistic). This chapter focuses on non-participant observation, as it’s more appropriate for the type of research questions that designers are likely to ask. It entails observing people’s behaviour in real-world settings, fly-on-the-wall style, and was integral to the landmark studies mentioned above. As ‘non-participant observation’ implies, researchers unobtrusively observe people in their everyday lives, doing whatever they normally do, uninfluenced by the researcher’s presence. This can take either a structured approach to gather mainly quantitative data or an unstructured approach to gather qualitative data (see Figure 3.1).
Structured observation
Structured observations tend to focus on human activity that can be systematically mapped, counted and measured. This might then be used to assess pedestrian volumes or common routes, or gain insight into specific topics like the types of activities in a space, how long people stay there, or demographic trends, perhaps. Information from structured observation can also inform decisions on aspects of a design or site layout. Do features within a space create physical barriers or encourage interaction? Do the ways that different groups use the same space conflict?

Figure 3.1
Types of observation
Some observations can be undertaken perfectly effectively using the low-cost no-frills techniques favoured by Gehl: human observers, in-situ, with pen and paper. There’s the added benefit of having people on the ground who are able to help interpret anything unclear. Complex sites or large-scale projects are likely to require more sophisticated survey technology. GPS, CCTV and the like allow the collection of much greater volumes of data over longer time periods, with counting and mapping automated or done remotely. Both hi-tech and low-tech strategies should produce the same result, however, namely reliable data that provides a foundation for evidence-based decision-making.
Unstructured observation
Unstructured observation offers real benefits in the exploratory phase at the start of a project. Effective observers can provide valuable insight into local social-spatial dynamics to help the team understand the realities of the site context and to consider options for the site in this light. At the same time, it’s also an excellent way to begin developing ideas about approaches to engaging with the local population, keeping the location, the community and the new development at the forefront. It gives observers the freedom to note anything that might pertain to the research questions, and allows them to form their own impressions of a site’s significant aspects rather than starting with a list of things on which to focus. Of course, designers don’t need to be told to look round a site beforehand and scope it out for themselves, so isn’t that an unstructured observation? The difference is methodological rigour. Observation is purposeful and focused, guided by defined research objectives, yielding copious notes and other records, which are methodically analysed in depth. So it’s much more than just having a look round!
Example
A project took place to assess the need for traffic management measures in a small town near Sheffield. This began with a consultation team from Local Level undertaking an unstructured observation to provide an initial understanding of the main traffic issues. Observing the streets at different times of day and throughout the week enabled them to identify the locations of the main traffic problems and to decide the next steps. The findings from the observation data informed the decision to survey local residents and businesses in the affected locations, and to use the insight from that survey data to formulate some possible solutions to put out for wider consultation.
3.3 Preparation
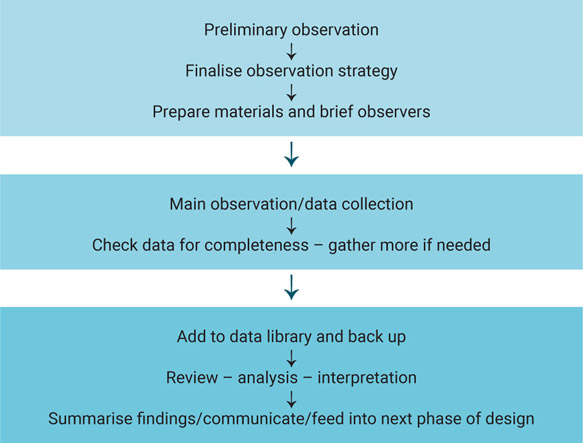
Figure 3.2
Suggested observation process
Preliminary observation
If possible, members of the design/observation team should undertake a preliminary observation visit to inform the observation proper. This will clarify its aims and parameters, defining the questions it will be answering, and deciding how to capture the information those questions require. This should include quantitative work, such as:
- mapping and photographing the site
- identifying the main routes and active areas
- selecting observation locations
- setting the boundaries of the observation site.
There is also qualitative work to do towards understanding the socio-spatial context, for example noting visual and sensory impressions, sketching, watching interactions and behaviour, and generally starting to think like a researcher. Having clarified the observation’s aims and scope, the team should then be able to finalise the strategy and decide roles, timing and duration of observation periods, and identify resources required. Figure 3.2 shows a suggested process for the whole exercise.
Remember that the logistics of data gathering influence the information yielded. Factors like time constraints, observers’ locations and decisions on what to count or map often have implications, so consider what these could be. Observers will need an outline map of the study area showing the main paths and features within the space, and a reference sheet, tested out first whenever possible, setting out how everything should be recorded. Run a briefing session beforehand to ensure that observers will work consistently. It’s sensible at this point to discuss situations that could potentially arise for them, such as responding to questions about their activities, dealing with people who object to being watched or recorded, and personal safety concerns. Unlikely eventualities, but it’s better for observers to be prepared.
Bias issues
At the data-gathering stage, an unstructured observation can be influenced by observers’ preconceptions or misinterpretation. A structured observation can also yield flawed information by not including significant aspects of a site, ignoring types of users or overlooking types of use. Later, at the analysis stage, observers can be prone to jumping-to-conclusions types of errors, only seeing what they expected, or misattributing causes or meanings to what they’ve observed. These kinds of errors tend to occur when unquestioned assumptions or selective attention impacts on the data gathering or analysis, and are inevitable to some degree. Ascribing meaning or causality where meaning and causality cannot be known are constant temptations in an uncertain world, but have no place in methodologically robust research.
So how can these biases be tackled? A good level of self-awareness, integrity and attention to detail always make a successful observation possible. It might help to employ Popper’s method of falsification or refutability (Popper, 1959), whereby researchers play their own devil’s advocate and look for explanations to disprove their theories rather than evidence to support them. Another solution is to ask others to review the material and see if they arrive at similar conclusions. I would also endorse Gehl and Svarre’s advice on addressing an historical imbalance; disabled people, elderly people, women and children have been routinely overlooked throughout decades of urban planning and placemaking, so pay extra attention to these groups to redress the deficit.
Bias Issues in Observation
One of the most important tasks during the preparation phase is to consider where bias could occur. Observers are human and fallible, public space is a complex place and appearances can be deceptive, so these inherent pitfalls need to be considered. Types of bias that are most likely to occur in observation-based research are:
Planning
Exclusion bias | Selection bias
Who does the observation include and not include?
Data Collection
Measurement bias | Observer bias
Will the counting or measurement methods yield valid and reliable data?
Analysis
Clustering illusion | Confirmation bias | Culture bias | Focusing effect | Illusory correlation | Observer-expectancy effect | Stereotyping
Are observers seeing only what they expected to see or is unexpected data also coming to light? Have observers recognised their own preconceptions and ways of seeing? Can apparent relationships between data be substantiated? Are patterns significant or random?
See the Appendix for explanations of these types of bias.
3.4 Gathering Observation Material
Counting
Counting generates quantitative data on human activity in a space, useful for finding out things such as the times of main usage, who uses the space, whether there’s a broad or narrow range of users, the features that people do and don’t use, and the types of events and activity that occur there. These kinds of statistics can be a worthwhile addition to an evidence base informing decisions about a project, and provide baseline data to assess a scheme’s impact post-completion. Although counting can reveal patterns of activity, it doesn’t offer explanations. Nor can observers always identify with certainty what people are doing just by watching them. Interpretations are therefore usually provisional.
Jan Gehl (2011) characterises two types of activity in public space worth recording in structured or unstructured observation:
- Necessary. Purposeful and goal-orientated activities such as essential shopping, and work-related journeys or tasks.
- Optional. More leisurely or informal activities such as strolling, eating, playing, sitting, reading or chatting.
Gehl recommends noting the locations where optional activity occurs, especially the places where people choose to sit or stay – whether on the edges of a space or in the middle, in secluded areas or out in the open, for example – as signifying features that people value, such as sun, shade, sight lines and proximity to other activity. (Whyte, 1980, suggests the number of women sitting alone in a public space can indicate the sense of safety it offers, which may or may not be worth keeping in mind.) The ratio of necessary-to-optional activities show whether its character is primarily functional, enabling mainly necessary activity or whether its features encourage optional activities.
Activity can be measured by two main counting methods. The nature of the space, the topics of interest and the research questions will largely decide which is appropriate (it may be both).
- Time-based counts note how many times particular activities or events occur in a given timeframe
- Interval-based counts note everything that’s happening at given times during the day, for example, every 30 minutes.
A hand-held click-counter can be useful in busy spaces with large numbers of people; otherwise a pad and pen, or a pre-printed table or checklist to mark up should suffice. It’s best to undertake counts at different times of day and in different seasonal conditions, which means it can take several weeks or longer to gather sufficient data. Whatever the approach, it’s essential that all observers work consistently, counting and recording in the same ways.
Mapping
Mapping generates quantitative data on movement paths through a space, such as pedestrian flows and routes. It provides information on stationary behaviour too, showing areas where people linger and those they avoid. It can highlight problems in accessing the space, such as a lack of road crossings or clear paths, or hindrances within the space itself, such as steps or inconveniently placed fixtures. Again, undertake mapping exercises at different times of day and in different conditions, and if possible over several weeks. As with counting, mapping movement in and around a space can provide good baseline evidence to inform decision-making, and assess the completed scheme.
Data can be collected by one or both of these approaches:
- Time-based mapping, when observers trace the routes taken through or around a space, recording individuals’ approximate paths on a map. Although inexact, it can provide a clear enough picture of primary and secondary routes, and paths less travelled. In spaces with large numbers of people, some systematic random sampling may be necessary: tracking every Nth person who enters, perhaps.
- Interval-based mapping, when observers mark up a map at specific time intervals to show the locations of different groups of users and types of activities at that moment, using an agreed notation. These produce an aggregated picture over the whole time period when merged, so this method provides information on users, activities and both datasets combined.
Gehl and Svarre also suggest measuring walking speed in pedestrianised settings as an indicator of the quality of a space, on the basis that a slower pace indicates a more enjoyable environment. Calculate this by finding an observable stretch of walkable space and measuring out a section of approximately 100 metres, then measuring with a stopwatch the time it takes randomly selected pedestrians to walk from end to end. They also recommend test walks, where observers walk key routes themselves, noting positive and negative features along the way. This can highlight some considerable differences in walkability between how a route looks on a plan and the reality on the ground. For example, a test walk for a study they undertook in Sydney produced the gloomy finding that 52% of the total walking time on one route was spent waiting at pedestrian crossings.
Photography and video
Video and still photographs can record structured or unstructured observations to provide an accessible visual documentation of a space and the nature of activity within it. This can contextualise other quantitative information, or provide a data source itself. For example, a series of captures of a particular activity can reveal new information about that activity when images are examined together afterwards. Images might be recorded to a brief, to address specific research questions or to capture particular types of events, or could adopt a less structured approach to depict a range of aspects or qualities of a space. The AEIOU mnemonic (Martin and Hanington, 2012) is a useful reminder for observers to document:
- Activities
- Environments
- Interactions
- Objects
- Users
Shoot more images or footage than is strictly needed, as aspects can be noticed in review that were missed on site, so it’s sometimes helpful to have extra material to examine. Aesthetic value is of no importance here; images just need to be clear, well lit and properly exposed. In a small space, a smartphone may be suitable for recording video or stills if the image quality is adequate, and will attract less attention (and therefore potentially influence people’s behaviour) than a video or camera.
Photography or video recording for observation exercises requires discretion and sensitivity; even in a public space, there are ethical issues to consider and limits to what it’s acceptable to shoot. It’s legal to photograph people or anything else from a public space without consent, but this can still be an invasion of personal privacy. If in doubt, let people know that you’re documenting the general environment, not them personally. Whyte recommends not recording people in ignominious situations or in the midst of personal difficulties, or engaged in any kind of illicit activity, even if these do take place in public.
Simulation and experiential monitoring
It is now possible to record individuals’ cognitive and emotional responses as well as their patterns of movement. Thanks to rapidly evolving technology utilising various types of sensor linked to a phone app or portable device that can monitor brainwave patterns, heartbeat, eye movements and breathing, people’s responses to different real-world environments can be measured, showing the levels of interest, pleasure or stress that their surroundings evoke. Similarly, experimental urban design research creates immersive virtual environments in laboratory settings to record people’s physiological reactions to simulated urban spaces and experiences. An unprecedented depth of insight into wayfinding behaviour, cognition and the effects on mood that different street typologies and environments create is now available. Yet the director of one such research centre – Colin Ellard at the Urban Realities Laboratory based at the University of Waterloo in Canada – maintains that ‘Although there is no doubting the power of a virtual reality simulation to unearth relationships between the organisation of the built environment and the operation of our minds … there is no substitute for experimentation at street level’ (Ellard, 2014). The knowledge generated from this field of research provides designers with exciting opportunities to create people-centred environments offering maximum enjoyment and interest, and minimum stress and anxiety, taking much of the guesswork out of whether the public will embrace or avoid a new space. Nonetheless, observation of real world street life, with its traffic, noise, smells, crowds, random interactions and unexpected occurrences remains indispensable.
3.5 Working with Observation Material
An observation exercise will generate a variety of types of material: maps, notes, drawings, diagrams and photos, at least. Ensure sufficient time is allowed for working through it all, as it can be complex and time-consuming to analyse in detail. So where to start? The first task is to add everything to the project data library. Catalogue the material, recording the type of content and the aspects of the project to which it relates, categorised by location, theme or user group, and specific tags or keywords to note particular events, for instance. This will form a useful resource to bring to further analysis, and in reports and publicity materials. It’s best to create working copies of image and video files, and other documents, rather than to edit or annotate the originals. Check that all material is usable and complete; if not, collect what’s needed to fill in any gaps before starting on the analysis.
Quantitative material, such as counts and maps, should be relatively straightforward to analyse and interpret if it was gathered with a clear purpose in mind, and the research questions should be able to provide a structure for analysis and reporting. Qualitative material from written notes, drawings, photos or video, is inherently more complex but still requires a structured analytical approach; refer to the ‘Quick guide to analysing qualitative data’ on p. 60 for a suggested process. Again, look to the research questions for analytical direction. It’s important in the analysis stage to allow new ideas or questions that weren’t covered by the initial research objectives to emerge, and to include rather than ignore things that weren’t anticipated. Any observation project will encounter unexpected phenomena at some point, so it may be necessary to adapt the research strategy to accommodate the data, rather than vice versa.
Once all the material has been considered, which will require a few passes and consideration from different angles, some tentative interpretations may be starting to form. I stress ‘tentative’ interpretations. Observation studies at the start of a project don’t normally need to provide answers, just useful information that can complement further research and inform the project as it develops. Additionally, while video, photography, mapping and counting give valuable baseline information, they don’t necessarily provide explanations, as I’ve mentioned. No image can be taken at face value, and the camera can and does lie. So keep an open mind about photos and video.
Any conclusions drawn from observation work at this stage should derive directly and only from the material gathered; see the ‘Quick guide to reporting research’ (p. 136) for more guidance. Be transparent in reporting the results, and include anomalous or contradictory findings. The aim is to develop evidence to inform the design, so all data is potentially useful at this stage.
Observation data in design development
Space Syntax provided pedestrian movement and space usage data for Gustafson Porter + Bowman’s award-winning redevelopment of Nottingham city centre’s under-used Old Market Square. Mapping the observation data on people’s routes through and around the square revealed a striking finding: more than three-quarters of pedestrians chose to walk around the outside of the square rather than taking the quicker route across it (see Figure 3.3). As Space Syntax explain, ‘By studying the spatial layout of the square and observing patterns of movement and space use, we were able to show how the design of the space influenced human behaviour. We used this analysis to explain why the square was currently under-performing, especially in its central area, which 78% of pedestrians avoided.’ The observation data was key to understanding how the space was used, and the extent to which the square’s layout affected people’s navigation of the area. With this insight, proposals were developed that improved pedestrian routes, increased activity, and provided a more inviting and inclusive space.
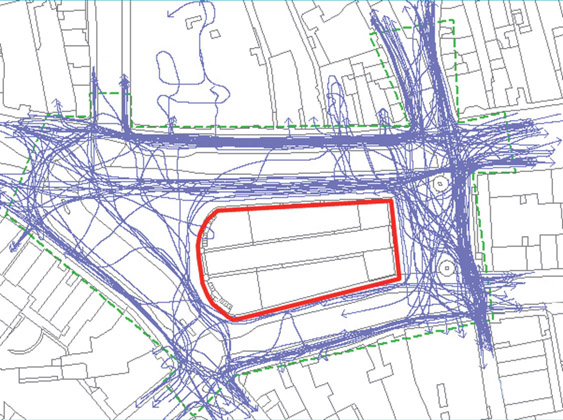
Figure 3.3
Pedestrian routes before development, Nottingham Old Market Square
3.6 Key Points Summary
> Naturalistic or fly-on-the-wall style non-participant observation is the most suited to understanding how people use public space, and can yield valuable quantitative and qualitative data.
Structured observation is good for gathering data on specific topics or aspects of a space; unstructured observation gives the observer greater freedom to record what they choose.
Undertake a preliminary observation to understand the space and its issues, and inform the observation proper.
Opportunities for bias are plentiful. Be aware of observers’ preconceptions, jumping to conclusions and the potential consequences of data collection logistics on the data and its interpretation.
Counting and mapping provide quantitative information on matters such as pedestrian numbers, primary routes, most and least used space, and types of activity.
Photography and video provide an essential visual record but video, in particular, requires time and care in analysis.
Several observers are better than one, and a combination of observation methods is also preferable.
Allow new ideas or questions that weren’t in the initial research objectives to emerge, and be open to adapting the research strategy in light of unexpected findings.
Ensure sufficient time is allowed for working through observation data; it’s a rich source of insight but complex and time-consuming to analyse in depth.