
CHAPTER 4
The Rise of Commercial Event Processing
This chapter discusses how commercial applications of complex event processing (CEP) have developed since 2000 and how CEP will be applied in the future through in four stages:
- Simple event processing
- Creeping CEP
- A CEP becomes recognized technology
- CEP becomes ubiquitous and unseen
The explosion of event traffic over the past twenty years created a new set of demands from business enterprises. The IT layers (i.e., the company’s networks, middleware, enterprise service bus, cell phones, and websites) of every sizable business were humming with this traffic, and people in every management role wanted to analyze it and understand its implications for their own roles in the organization. The demand to extract information from the IT layers, sometimes referred to as business intelligence, had increased dramatically. As we shall see, it is difficult to think of anything other than CEP that could have taken place in the processing of higher-level events at a particular point in time around 2000.
This chapter describes four stages of commercial development and adoption that CEP is going through and will go through in the future. As we shall argue in later chapters, the long-term outlook is for CEP to become a contributing technology under the hood of those global applications of real-time information systems that are essential to running our society.
We start with the situation facing event processing vendors at the beginning of the twenty-first century.
The Dawn of Complex Event Processing (CEP)
With the advent of networks came a host of network management tools1 whose job it was to monitor network activity and display the results graphically. Some of these tools, such as HP Openview, CA UniCenter, IBM Tivoli NetView, and BMC Patrol, were some of the leading network management tools of their day. They were used to monitor events in networks and provide graphical views and statistics for network managers. They could be considered as the early precursors of business activity monitoring (BAM).
The application users wanted to know what was going on too, especially when the applications failed because of network problems. But users of applications understand higher-level events, not network-level activity. Sometimes, the tools could use composition rules to construct higher-level events from the network activity and conversely to drill down from higher-level events to the lower-level events that caused them. So by the mid-1990s, we could see the tip of the CEP iceberg! Whether the implementers of these tools had any explicit definition of CEP principles in mind may be open to doubt. But two things are worth mentioning.
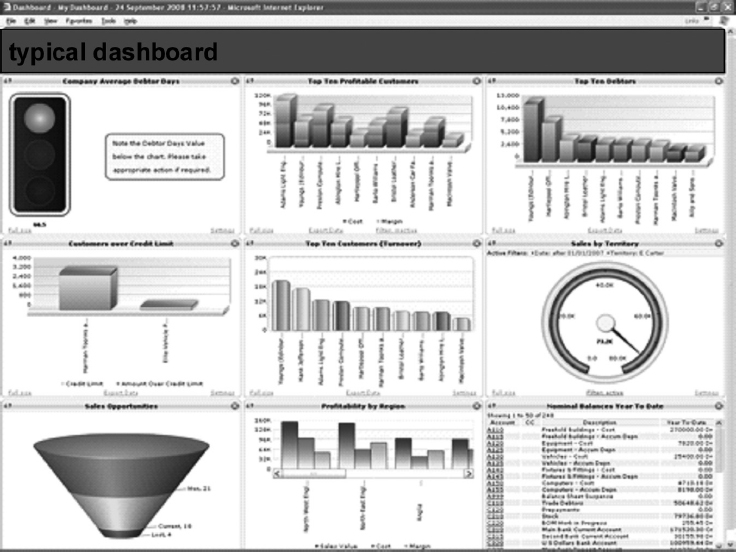
These network management tools made graphical dashboards the main access medium (see Figure 4.1). The dashboard was developed to supply tables, graphs, and animations of the information delivered by the monitoring tools that were tracking the network traffic. So dashboards became the default interface for delivering insight to the user, or at least for kidding the user that insight was being achieved! We’ll come back to dashboards and implied insight later.
FIGURE 4.1 A Graphical Dashboard Attempting to Aid Human Understanding of Events and Data
Secondly, an astounding fact. The major IT suppliers of these early network management tools were slow to capitalize on the opportunity to extend their technology to the higher levels of events used in business processes and management operations. The technology implementing event pattern detection and simple kinds of event pattern abstraction was already buried in some of these tools. It is clear that such extensions of network monitoring could have been done far in advance of other entrants into the business event processing market.
But no commentator or student of event processing or business has a satisfactory answer to why the major IT suppliers failed to make such obvious extensions to the capabilities of their network analysis tools. Some guess that perhaps they were too focused on the existing network market and didn’t really believe there was a market for higher-level business event processing. However, there can be no doubt that all the major IT vendors of the time missed an opportunity—and for that, the small start-up vendors in the BAM and CEP field today must be eternally grateful.
Of course, all of the large companies are in the business event management market now. Some of them have three or four competing products from different divisions within the same company! These larger companies are, in fact, busy buying up the smaller CEP vendors that pioneered the field. That’s one way they are playing catch up. Today the market for higher-level event processing is a battleground for market share, and the smaller players are being assimilated into the large vendors.
CEP is about analyzing events at all levels, from the highest level of the business and management operations of the enterprise down to the network level, if necessary. And it is about supplying event processing capabilities in a general form that can be configured to apply to any types of events in different problem areas.
Following the developments in network management tools, the next step that needed to be taken in event processing was CEP. The commercial story of CEP begins around 2000, perhaps slightly earlier. In the beginning there were no clearly defined or published principles or concepts for the field. There were no publications, no presentations at meetings, no formal society devoted to event processing. CEP was a vague cloud of half-formed ideas in the heads of the more forward thinking people in business and academia. It was the subject of a few research projects in various places that could be counted on the fingers of one hand, perhaps without the thumb!
Ten years on, it can be seen clearly that there are four stages in the evolution of commercial technology based upon CEP concepts. There are no sharp distinguishing time points at which one stage ends and the next begins. In fact, each stage overlaps in time with the next. Figure 4.2 shows the approximate time intervals of these stages.
FIGURE 4.2 The Four Stages in the Evolution of Commercial CEP Applications
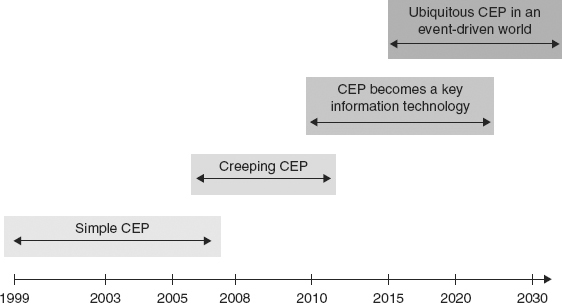
Each stage can be characterized by a set of technology indicators that summarize the CEP capabilities that were appearing in commercial tools and also the state of the marketplace of that time. As these technology indicators begin to appear, the previous stage begins to evolve into the next one.
The first stage, called simple CEP, was really a struggle to explore and develop markets, and to gain market traction, on the part of the early event processing vendors. The CEP concepts had not been published at the beginning of this stage. The ideas were evolving and being formulated. So the event processing implemented in the early tools was “simple,” if not rudimentary to say the least, but still capable of answering some of the business intelligence questions of interest to potential customers.
The second stage, creeping CEP, is where we are today. CEP concepts were published during the simple CEP stage and began creeping into the tools. The present generation of tools on the market today has event processing capabilities that implement a lot of CEP concepts. And more CEP is creeping into the tools all the time.
The next stage is the key information technology stage, in which CEP becomes a recognized area of information technology and computer science. The more advanced concepts of CEP, such as event hierarchies, will be introduced into commercial applications, and standards for event processing will appear.
And the final stage, some way off in the future, is ubiquitous CEP. It is a stage where CEP technology simply disappears under the hood of event processing applications and is really no longer visible, or talked about by end users of the applications. It is an enabling technology that users don’t see, but it is used everywhere!
Some event processing applications in the first years, say around 2003, claimed to provide CEP capabilities.2 In fact, they implemented only a few of the simplest CEP ideas, if any. So I refer to this as the era of simple CEP, even though the data processing (as opposed to event processing) contained in these applications was often very sophisticated. In other words, the data in the events were being processed and might be subjected to complex algorithms, but only the simplest event pattern–processing techniques were used on the events themselves.
For example, event monitors could be installed on the IT layer to give business managers an online view of how the business was operating by displaying key performance indicators (KPIs) for business processes. But they allowed only a small number of predefined3 conditions to trigger alerts. In the earliest KPI monitors, the triggers for alerts could only be single events. The use of trigger conditions containing several events in a specific pattern came later.
The CEP technology indicators for this stage appeared gradually during this time span, mostly between 2000 and 2005:
- Adapters for translation between common event formats
- A small number of predefined event types in commercial tools
- Commercial tools capable of computing simple statistics on events, such as counting numbers of events of a specified type
- Extensive application of computations on the data content of events such as in stock trading algorithms
- User-defined alerts
- Alerting based upon single-event triggers
- Moderate event throughput in event processing, up to 1,000 events per second
- Playback and event storage
- Primitive dashboards for displaying results
- A small number of established commercial applications
Claims of higher event throughputs, sometimes in the range of 10,000 events per second, were made, but in these cases the tools were doing little more than simply reading the event inputs.
Building adapters for event formats was perhaps the first step that most CEP tool builders took. And a ready market for adapters appeared. They were needed, so that the tools could be configured to work on a customer’s IT layer.
This was the era of single event triggering in the most advanced tools of this time. That is, users could define event-condition-action (E-C-A) rules, but the conditions to trigger them could only contain a single event template. So, if an event arrived that matched a condition, then the corresponding data computation or alert was triggered. Also, users were usually restricted to a fixed number of different types of events, all of them predefined in the tool. Event templates of these types could be used in conditions. Some tools had user features for specifying additional types of events beyond those predefined in the tool.
Many of the event processing applications at this time were simply devoted to computing statistics using the data in the events (e.g., computing the volume-weighted average price or VWAP of the trades in each stock on a list of stock symbols in the past hour). More advanced applications were warning systems applied to IT layers to monitor events and detect conditions defined by the user, for example:
- To monitor conformance to company policies of traffic accessing a secure database
- To monitor communication between the controllers in a chip fabrication line to ensure correct progress of the pallets of wafers through the processing steps
More complex alerts using patterns of events came later. The explanation for the rudimentary nature of the CEP implementations at this stage is simple enough: Implementations of event pattern detection for complex patterns were nonexistent. Only the simplest of event patterns, most often just single event templates, were all that could be handled at that time. The rates at which events could be processed were moderate by today’s standards. Lastly, the first uses of graphical dashboards in general-purpose CEP products (as opposed to say, stock market trading tools) arrived in these early tools.
The next generation of KPI monitors around 2004 included a bit more CEP. They provided a limited facility for users to specify additional types of events and to use them in E-C-A rules. Triggers could be patterns containing multiple event templates. But the user features for defining event patterns were primitive, and complicated to use which is why many of the tools were more suited for use by software professionals than by business analysts. In cases where the monitors allowed users to define their own types of events, or event patterns and event-triggered rules, those definitions usually had to be coded in a version of Java script or an extension of SQL. Also, the event patterns that could be used were limited to simple Boolean combinations of event templates.
The first problem that vendors of CEP products encountered upon entering new markets such as financial trading was custom coding. Custom-coded event processing had been going on in a few areas such as stock trading since the mid-1990s. That was their biggest competitor. This was in the early days, around 2000–2005. CEP vendors would often complain, “Our biggest competition is from custom-coded solutions.” What did that mean?
You might well think that it meant some machine-coded hackery. But in fact it simply meant that the competition was coded by the customer’s own IT department and not purchased from an outside source. Often, a custom-coded solution was indeed a program that was focused on a single, specific problem and had an overly restricted range of applicability. Even so, it might apply principles of CEP, although the IT department may never have heard of CEP. And usually a custom-coded solution worked pretty well, because it had been working for some time before the CEP vendors entered the market. Also, the first-generation CEP solutions were far from perfect, and as we have said, most of them supplied only a little CEP.
However, when the potential customers wanted to extend their custom-coded solutions to other event processing tasks, even in the same problem domain, it usually turned out to be a labor-intensive and expensive process. And event processing packages and tools were becoming more commonplace. That led potential customers to re-evaluate the “build it or buy it” equation, and general-purpose CEP began to make inroads into these markets. This battle is still going on today!
More and more CEP concepts began to creep into event processing products around 2004 and the years following. These were difficult times for most small CEP vendors. It was a time when business analysts talked about the need to “gain traction” in markets. A lot of the small pioneering vendors that had been first into the field were assimilated by larger companies, and others failed. But many continued to pioneer new markets while running at a loss. Belief, the stuff of innovation and enterprise, kept them going. Usually they had one or two proof-of-concept experiments with customers that paid enough to keep them in operation.
At this time the medium-size vendors of middleware products began to add CEP to their middleware and enterprise service bus (ESB) products. Meanwhile, the large players were sitting on the sidelines developing event-processing additions to their product suites and trying to decide if there was a business event processing market.
It was in this critical formative period that business activity monitoring (BAM) emerged as a market area for CEP. Educational material in event processing began to appear in the form of university courses and books. Graphical interfaces and computer languages for event processing made their way into CEP products—and the BAM dashboard arrived, as we will discuss in a moment. All of these were indicators that event processing was a growing and active area for computer applications in business areas.
The technology indicators for this stage were many improvements arriving in CEP tools during 2004–2009:
- Somewhat higher-level languages, allowing users to define event patterns; these included stream-SQL, Java language extensions to allow expressions with patterns of events, finite state machines, Petri Nets, and graphical input schemes
- Detection of user-defined event types and event patterns, such as Boolean combinations of event types, or regular expressions of event types
- Timing bounds in patterns of events
- Complex event patterns involving multiple-event templates as triggers for alerts and E-C-A rules
- Sophisticated graphical dashboards for displaying event pattern monitoring results, KPIs, and alerts, and for authoring E-C-A rules
Business activity monitoring (BAM) was one of the most successful areas where CEP applications appeared early in this stage, alongside financial trading and services. This is the time of the “great creep forward” in commercial CEP!
While BAM started in the previous stage of simple CEP, it developed into a rallying cry for all the vendors during this stage of creeping CEP. It crosses our timelines.
The term BAM was first coined by Roy Schulte at Gartner4 for business activity monitoring to classify the market that KPI event monitors and similar tools were targeting. This simple label had the effect of focusing attention on this new area and helping people understand in general terms what it was all about and what its goals were. True, three-letter acronyms have proliferated beyond all usefulness in the business applications area, but this particular one was worth its weight in gold!
BAM was a successful market category for the first generation of CEP products. As we have already discussed, only the simplest event processing technology was involved—that is, formatting events, categorizing and counting numbers of events in each category, computing various KPIs, and displaying the results as graphical meters. But the BAM market funded the next generation of commercial CEP products.
The first BAM tools were used to monitor business parameters and business processes. A period of gradual adoption took place. BAM tools were applied to real-time data in banking operations. An example is monitoring the progress of mortgage applications across a global network of cooperating financial institutions (see Figure 4.3). Each mortgage application progresses through various steps in a pipeline: for example, income review, credit checking, loan application risk analysis, background checking, and a final decision step that, if it has a positive outcome, leads to a funding approval process. Each step, executed by a different company in a collaborative network, might initiate a subprocess involving another series of steps. An income review, for example, might initiate concurrent steps to check income, bank accounts, ask for recommendations, and so on.
FIGURE 4.3 Event Monitors and Dashboard Display Applied to Monitoring Business Processes
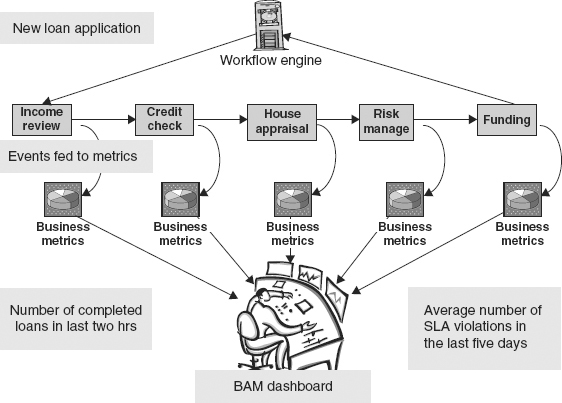
At any one time there might be several hundred applications at various stages in the pipeline. A BAM dashboard provided a central monitoring panel for statistics on the whole pipelined mortgage process and its subprocesses. Similar BAM dashboard monitoring of multiple stages of business processes can be found, for example, in the insurance underwriting business, where the risk analysis may involve several complex steps.
About the same time, more CEP applications were being added to the event processing tools already in capital market applications (e.g., in trading bonds, commodities, derivatives and foreign exchange). Here the event input contained market trading data from various sources, usually including several stock market feeds. Financial trading had a tradition of custom-coded tools, so CEP vendors found that event processing was already well understood in that field. In fact, as already mentioned, the biggest competitor with CEP products was, and still is, custom-coded solutions.
Elsewhere, vendors found that their most significant problem in penetrating new markets was educating the marketplace about event processing and its potential benefits. There was a lack of educational material, not only for customers but also for the vendor’s sales force.
As the development of CEP tools progressed, graphical input tools were introduced to help users define event patterns. Graphics give a user a way to easily compose the outline and Boolean structure of an event pattern. Even so, at some lower level in specifying all the details, a user has to resort to writing program text in code (e.g., SQL or Java) to fully define an event pattern.
Awareness and Education in Event Processing
The early vendors of event processing entering into the CEP arena were faced with a new problem. It didn’t matter if they were established vendors of middleware, business process management (BPM), and first-generation ESBs products; were already in the financial services market; or were new startups in CEP. The problem was the same: education! First they had to raise the level of awareness about CEP and the kinds of commercial problems it could be applied to. Educating both the customer and the company’s sales force was a pressing need. And it was made worse by the fact that educational materials were lacking.
The only book on the topic at that time, and for many of the following years, was The Power of Events,5 an outgrowth of ten years of research in event processing at Stanford together with experience in the startup marketplace. It contained a simple introduction to the concepts of CEP in Part I and a comprehensive overview of CEP principles and possible applications in Part II. Ideally, it should have been two books, and for many, Part II is a tough read, even today. Some marketing departments bought the book in volume and handed out free copies to potential customers—and their own sales force.
Languages for Event Processing
Gradually, the event processing tools progressed beyond simply monitoring the activity on the IT layer to compute KPIs. They added features that allowed users to define patterns of events. The monitors were supposed to detect instances of these patterns in the enterprise activity. The event patterns that could be defined became more sophisticated, and languages for defining event patterns began to appear. Timing conditions could be added to events in a pattern, but only very simple ones, such as “event E at time t.”
The appearance of event pattern–definition languages was a step forward. Most of these were variants of SQL with one or two additions for defining events and patterns, such as Stream SQL (SSQL), and SQL variants such as CQL.6 These languages were targeted to defining event patterns in event streams such as stock market feeds—which were the target market for these tools. They could be applied to other kinds of event input, of course, but the pattern-detection capabilities would still treat the input as if it was an event stream.
One reason for the popularity of SQL variants as the event pattern definition language of choice was ease of implementation. The tool builders at this time were mostly from the database industry and were experienced in SQL, but not in event processing. Funnily enough, questions of correctness of implementations never seemed to arise. The other common justification was that SQL was what the customers understood. And also the sales force, one might add!
But some of the new event pattern–definition languages were not variations of SQL. They assumed that the event input was indeed a cloud of events. These pattern languages could specify event patterns that were regular expressions containing event templates. They were extensions of algorithmic computer languages such as Java and had been designed earlier in the 1990s. One language was an elegant extension of Java for parallel processing.7 It allowed users to define classes of processes that could execute independently and concurrently, together with their interactions and communications. This language came out of Cambridge University in England and forms the basis for some commercial products today.
Another notable event processing language was Rapide, developed by the Stanford event processing project to support building event driven simulation models. It was a strongly typed algorithmic language, based upon the modular concepts of Simula67, Modula, Ada83, and VHDL, but with added constructs for defining concurrent threads of control called tasks and architectures. It is the only language with an ability to define different levels of events (say, management events and business-operations events). This gave users an ability to actually define management-level events in terms of the way they were composed out of lower-level events. One could define how management-level events were to be executed by means of maps between event layers. It was applied at that time to building simulations of multilevel systems, notably hardware designs.
Multiple levels of a system design could be simulated concurrently and the results compared automatically for consistency between the executions at each level. The results of comparative simulation of different levels of a CPU design (e.g., instruction set level, register transfer level, and gate level) were impressive.8 Rapide is also the only computer language to record both the causal relationships between events and their timing in simulation results.
Rapide was also applied to event monitoring on commercial middleware and was used on various research projects at other universities. It has remained largely a research tool, probably because of the implementation challenges it poses. A few commercial implementations have been attempted by startups. And some are still in use.
The development of event processing languages is ongoing across the different development stages of commercial CEP.
Dashboards and Human-Computer Interfaces
The dashboard became the standard means of displaying the results of event monitoring applied to the enterprise IT layers (see Figure 4.1). Historically, the idea of using digital dashboards to convey information to humans comes from the 1970s decision-support systems. In the late 1990s, with the surge of the Web, digital dashboards as we know them today began appearing in more business applications. Many systems were developed in-house by organizations to consolidate and display data already being gathered in various information systems throughout the organization. Today, one can find dashboard templates and software for building dashboards in Web development toolkits and elsewhere. Most CEP vendors use dashboard-building tools and configured their own dashboards.
Every dashboard was different. KPIs and other statistics were computed from the input event cloud and displayed in all manner of meters, dials, and real-time graphs, and in all colors of the rainbow. They were impressive at first glance. But there were absolutely no standard for dashboards. And when one attempted to draw conclusions or insight upon which to base management decisions, one was often left at a loss. There was no aid to help a viewer draw conclusions from the pretty pictures and the statistical data that could be used at a level of management decision-making.
In fact, the situation in applying business event processing to enterprise management was quite similar to the situation in network management. The average network management operations room is filled with an impressive array of monitor consoles in all colors and configurations, from floor to ceiling and from end to end of the room. Every statistic imaginable is displayed in real time, as in Figure 4.1. The managers sit viewing this dazzling display and wondering what should be done.
In the more advanced dashboard products that contain CEP, one can define alerts that ring automatically when specified event patterns are matched by the event inputs over specified time windows. And one can construct E-C-A rules to be triggered when event pattern conditions are matched, thus taking some simple kinds of action to control the enterprise. Basic problems like load balancing of servers and power fluctuations in the network can be seen and addressed. But there is no automated reasoning from the meters and statistics. Network management situations that develop slowly beyond the time-window limits of the tool, like long-lived intrusions or thefts of secure data, are never seen on these dashboards. And distributed denial of service (DDOS) attacks usually arrive far too quickly for any actions.
Dashboards do not give insight into the enterprise’s business situation, nor do they suggest management decisions. They do not tell you what is going to happen. The human has to sit and try to predict developing situations from what the dashboard displays. Usually the graphic representations of the event inputs can be helpful, but when everything suddenly goes red and bells begin to ring, it is generally too late. This was exactly what happened with those in control of the power grid during the great northeast United States electricity grid blackout of August 2003.9 Indeed, the controllers’ reactions during that situation were that their computers were under cyberattack and their dashboards were not believable!
There is no better example of both the strengths and the limitations of the dashboard than the United States Geological Survey Natural Hazards website (see Figure 4.4). This facility provides users (e.g., local government authorities, fire and police departments, first aid planners, and also the private individual) with an ability to see immediately, in near-real time, what kinds of weather and other environmental events might be happening in their area. It displays input from a multitude of sources: weather satellites and forecasts, ocean monitoring stations, earthquake sensors, hydrology monitors in rivers, local authority flood and mudslide warnings, and remote automated weather stations (RAWS) around the United States10 and in some cases around the globe. The display is a dashboard with an interactive world map.
FIGURE 4.4 USGS Natural Hazards Dashboard
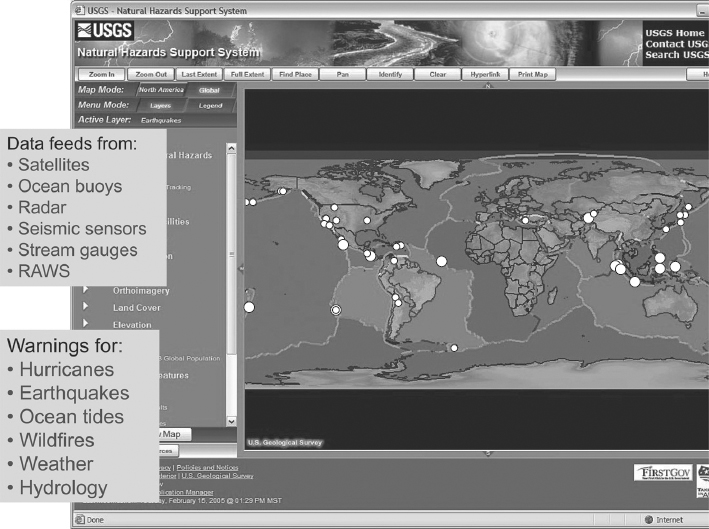
There are graphic tools for manipulating the map, such as zoom and focus, and for displaying location-specific information. For example, as a hurricane nears a shoreline, NHSS users can see its current location and can click on the map to access real-time information on stream levels, wind speeds, and tide conditions. The website also stores historical data.
This is a powerful use of the dashboard concept. But as Figure 4.5 shows, it lacks any kind of reasoning capability. When querying activity at a location, one should be careful to query not only the predictions for that area but also the recent history within a time window. And then one is left entirely alone to draw conclusions.
FIGURE 4.5 Reasoning from the Data on the USGS Natural Hazards Dashboard
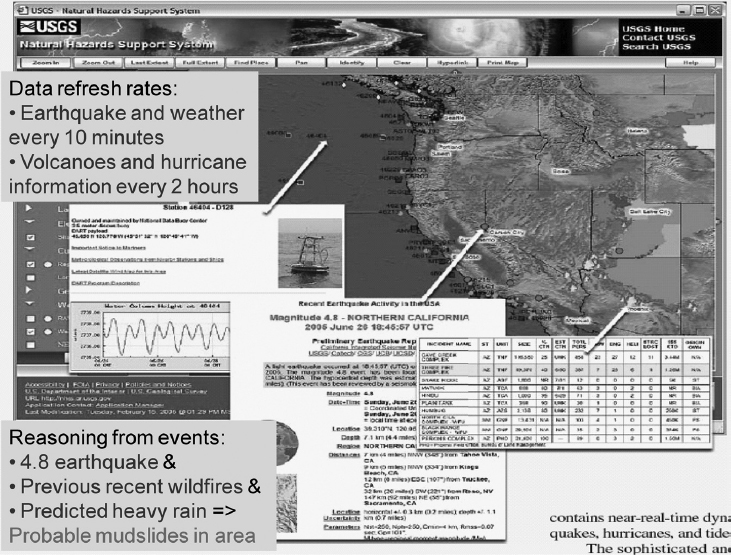
For example, to investigate the possibility of mudslides or avalanches, one must take account of the geology as well as the weather forecasts and recent history. Taking the USGS NHSS system to the next step of informativeness is a challenging project, but very worthwhile and entirely feasible.
An amusing thought is that at some point, dashboards for businesses could morph into human-computer interfaces.
The term interface has been coined for the kinds of machine-human links that are being experimented with in research labs at the moment. An interface is a link between systems, equipment, or people that can be applied to virtually any engagement between humans and machines. The next-generation user interfaces will facilitate control with much greater intuitiveness derived from natural actions and behaviors. Improved integration between the human body and electronic devices should usher in the age of the organic user interface, whose potential implementations include biometric sensors, displays projected onto the user’s skin, and eventually brain-computer interfaces.
It is claimed that human-computer interfaces could be used for vehicle control, emergency services dispatching, augmented reality, architectural design, telemedicine, and traffic flow modeling. So maybe they might find application to business intelligence gathering and managing businesses too? One potential use of future interfaces is eye tracking, which in passive applications can be employed for advertising and marketing feedback by collecting useful data about where a user’s gaze is directed. In some interactive applications of the technology, eye tracking is already letting quadriplegics interface directly with computers, choosing letters and commands by fixing their gaze on the appropriate region of the screen. This form of interaction is expected to provide an input control mechanism for wearable computers.
CEP Becomes a Recognized Information Technology (2009–2020)
Stage 3 is where event processing becomes recognized as a technology area in computer science separate from any of its applications in simulation, networking, or other areas. Hopefully we are entering this stage now. It has been said that the applications in stage 2, creeping CEP, are about chaos management within the enterprise, whereas the applications in stage 3 are about proactive management. In truth, chaos management will probably be the mode of operation in businesses for a long time to come.
The technology indicators of stage 3 include:
- A much-expanded range of areas of applications in many different markets
- An established event processing community11 sponsoring
- Conferences
- Publications
- Standards
- Open source development of event-processing tools with CEP capabilities
- Next-generation high-level languages for specifying complex event patterns and pattern-triggered reactive rules
- Definition and commercial use of event abstraction hierarchies
- Event processing standards
- Libraries of event processing rules engines and event processing agents for building CEP solutions
- Tools for event driven applications, such as statistical analytics tools, simulation tools, and constraint-based optimization tools
- Funded academic research and teaching in event processing
The most important indicator that we are beginning to enter stage 3 is healthy and established markets. And the best measure of this is the diversity and number of areas where there are substantial commercial applications. A second indicator is interest in CEP, not only among potential buyers but also on the part of technical people—the engineers and computer scientists who will design and build more capable CEP products in the future. This interest is manifesting itself in the formation of a society to sponsor meetings and publications addressing the subject of event processing. This activity started taking place in 2008. Chapter 5 deals with the market areas for event processing products and CEP in detail.
In stage 3, the more advanced concepts of CEP that were yet to be included in products at stage 2 will become understood well enough to find useful commercial applications. As a result, the technology in event processing products will support the use of more CEP concepts in building applications. This has begun to happen. Implementations of event pattern detection have improved considerably so that quite complex patterns are being deployed in applications in areas such as security and real-time fraud detection.
But CEP concepts such as event hierarchies have yet to see useful commercial applications.
Some industry observers say that people are often using event hierarchies implicitly in their event processing work without realizing it. But that if they had explicit hierarchy definitions to work with, they could achieve a lot more.
The basic idea is that businesses have a hierarchy in their operations and management. Correspondingly, the events created in running a business should also be organized in an analogous hierarchy. We should be able to view the events that correspond to any level of the business operations that we are interested in—as they happen, or post mortem.
Example 4.1: An Event Hierarchy in Factory Fabrication Line Operations
Here’s an example of a CEP event hierarchy that could be featured at stage 3 in commercial tools for observing events in a particular kind of business operation. It is a computable hierarchy of events. It provides a framework for building tools for viewing events at different levels in the operations and analyzing the causes of an event at any level by retrieving the lower-level events that caused it.
In Example 4.1, the business is a manufacturing company. The event hierarchy defines relationships between events at three levels. Here is a small selection of the events at each level:
Level 3: Factory management–level events. Events at this level are measurement events used in decision making. They give fabrication line performance (e.g., equipment failure rates, maintenance times, etc.), product yields (e.g., wafer yields per pallet) and operating costs (e.g., energy consumption measures per machine per day, raw materials consumed per day, etc.).
Level 2: Fabrication line operations–level events. Events at this level are operational events from the fabrication line—for example, equipment status events for each machine (e.g., in service, idle, loading, operating, unloading, standby, in maintenance, in error status, etc.) and fabrication line movement events (e.g., number of pallets in process, pallet positions, pallet statuses, pallet throughput times, etc.).
Level 1: Equipment and controller communications-level events. These are low-level events that flow between the various machines on the fabrication line and the controllers that keep the fabrication process on schedule and measure the results from each machine—for example, communication events between machines and controllers (e.g., controller to machine polling events, instruction events) and machine-to-controller responses (e.g., machine state, temperature, gas density, operating phase, stage in processing, time to completion, etc.).
There are many thousands of level 1 events per minute in chip fabrication line (fabline) operations. The numbers of level 2 and level 3 events decrease exponentially with level (e.g., there are hundreds of events per minute at level 2, and perhaps as little as tens per hour at level 1).
Figure 4.6 illustrates the hierarchy levels and mappings between events at each level and sets of lower-level events. In the figure, a fabline operating event at level 2 has a shadow of level 1 communication events from the fabrication line. These are the level 1 events that lead to the level 2 operating event. For example, a machine-loading event (level 2) might result from several communication events between that machine and a controller telling it to enter the loading phase, together with the machine’s responses.
FIGURE 4.6 A Computable Event Hierarchy in Manufacturing Operations
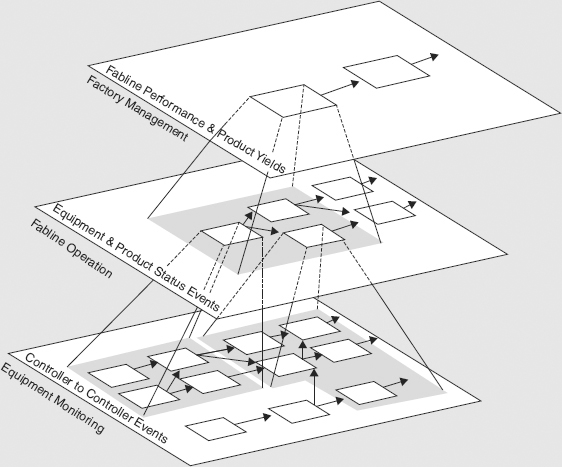
This shadow is defined by a mapping between level 2 events and sets of level 1 events. And the mapping is computable. That is, given the level 2 event, the mapping will compute the level 1 events in its shadow that led to it.
Similarly, the management events at level 3 are mapped in the hierarchy to sets of events at level 2. For example, an equipment failure rate event, say a weekly level 3 measure of performance, will map to a set of level 2 error status events for machines over that week. A daily or hourly product yield event will map to a set of pallet status and pallet processing–time events at level 2.
A computable hierarchy has a number of applications. First, the cloud of level 1 events from a fabrication line can be fed to the hierarchy mappings. They in turn will compute and output the events at level 2 and then at level 3. So we automatically receive the level 2 events reporting the operations of the fabline, and then the level 3 factory-performance measures, all right now as they happen.
Second, the hierarchy helps in analyzing performance failures. If there is a problem, such as persistent equipment failures over time, we want to drill down the hierarchy to analyze the level 3 operating events that are related to the failure events. The reverse mappings from level 2 to level 1 let us do that.
Again, if there’s a production problem at level 3, such as low yields, then we need to analyze intermediate level 2 events such as product yields and manufacturing times. If we find events at this level that indicate problems, we will want to drill down further to see the related level 1 events. Here we may find emerging problems such as a machine with parameters (e.g., temperature, gas density) that are near performance limits but not yet error status.
Events are being created in a continuous flow as the factory is running. Using the hierarchy maps we can see how higher-level events are caused by sets of lower-level events. If we are given a flow of level 1 events coming from running the fabrication line, we can compute the fabline status events at level 2 and then the factory performance events at level 3.
Note that hierarchies are an operational tool in event-driven systems. Sometimes maps will yield “don’t know” results! One important advantage of event hierarchies is that the numbers of events decrease exponentially as their level increases. So operational errors that might not be detected at low levels sometimes become glaringly obvious at higher levels. For example, an expected high-level event is missing! The high-level event is missing because a lower level event that it depends upon is missing. But you might not notice that missing lower-level event, because there are too many low-level events.
Methods of defining computable hierarchies of events and maps between levels of events are given in Chapter 7.
As CEP becomes a mature technology, we expect event standards to be developed during stage 3. In fact, some event standards, such as formats for events, are being reviewed in some of the standards committees. There are several drivers for standards, not the least being the need to develop modular libraries of CEP components analogous to Java Beans or JMS. One should be able to buy an off-the-shelf pattern-matching engine or rule-execution engine to build a solution using CEP. It would help to have shared libraries of various building blocks of the technology (e.g., rules engines, libraries of event patterns for specified application areas, and event processing agents that are special-purpose rules engines that perform specified tasks such as event filtering and aggregation). Some open source CEP rules engines have already appeared and are being used in various projects.
Another indicator that should happen during stage 3 is the development of standard event hierarchies for application areas, such as supply chain management or airline operations. These hierarchies of concepts would be analogous to the ISO seven-layer messaging standard, or the TCP six-layer event transportation hierarchy. Events at each level correspond to the concepts at that level. This is a step that must be taken toward spreading the use of event abstraction in applications of event processing, and toward standardizing both the terminology and the applications.
There are many other developments that may or may not happen during stage 3. One that is often talked about by some vendors is making CEP available as an Internet service. An approach would be selling computation time on clouds of CEP engines. It will not take long to find out whether these kinds of ideas come to fruition!
In our final stage, CEP ceases to be a visible technology that is accessible to the average end user of an event processing system. Instead, it simply disappears under the hood of applications, rather like network protocols today, and becomes a tool of event processing specialists. The time at which this final stage begins is hard to determine. Some would say that we entered this stage in 2011; others would say not yet. But it is already the case that some very large-scale global event-driven applications are being developed in which CEP plays a supporting role.
Some of the indicators for ubiquitous CEP are:
- Complex event processing is a part of common event driven applications across the board, small and large, from household automation to real-time enterprise to national cyber defense.
- Event processing is used as an integration technology across market boundaries, unifying applications in different markets and event spaces.
- Holistic event processing becomes a reality. These are very large-scale applications of event processing, such as global environmental monitoring systems.
- Many systems that process events and use CEP concepts are built without the builders even knowing that they are using event processing or CEP, and without ever knowing anything about the concepts discussed in this book.
The wheel has been invented many times over history, and in many guises!
Holism (from ![]() λος, or holos, a Greek word meaning all, entire, total) is the idea that all the properties of a given system (e.g., biological, chemical, social, economic, mental, linguistic) cannot be determined or explained by the sum of its component parts alone. Instead, the system as a whole determines in an important way how the parts behave. The general principle of holism was concisely summarized by Aristotle in the Metaphysics: “The whole is more than the sum of its parts.”
λος, or holos, a Greek word meaning all, entire, total) is the idea that all the properties of a given system (e.g., biological, chemical, social, economic, mental, linguistic) cannot be determined or explained by the sum of its component parts alone. Instead, the system as a whole determines in an important way how the parts behave. The general principle of holism was concisely summarized by Aristotle in the Metaphysics: “The whole is more than the sum of its parts.”
Two examples of holistic event processing systems are:
1. Unified global air traffic control. A unified international air traffic control system spanning all commercial air travel.
2. Global pandemic watch systems. A real-time global pandemic watch system based upon analyzing and correlating (1) multiple real-time news feeds in different languages from around the globe, (2) SMS messages from trained rural field agents in southeast Asia, Africa, and elsewhere, and (3) electronic reports from health authorities at every level, from local to regional to national and finally the WHO.
The development of holistic event processing applications is a final indicator that we are in stage 4. Chapter 9 will deal with holistic event processing and the future applications of CEP and event processing in general.
Notes
1 See Chapter 2, Figure 2.1.
2 See the list of CEP concepts in the section in Chapter 3 entitled “Complex Event Processing and Systems That Use It.”
3 “Predefined” is sometimes referred to as “out of the box.”
4 D. McCoy, R. Schulte, F. Buytendijk, N. Rayner, and A. Tiedrich, “Business Activity Monitoring: The Promise and Reality,” Gartner’s Marketing Knowledge and Technology Commentary COM-13-9992, July 11, 2001. Can be viewed at www.gartner.com/gc/webletter/rok/issue2/issue2.pdf
5 David Luckham, The Power of Events (Boston: Addison-Wesley, 2002).
6 Arvind Arasu, Shivnath Babu, and Jennifer Widom, “The CQL Continuous Query Language: Semantic Foundations and Query Execution,”Technical Report, Stanford. http://ilpubs.stanford.edu:8090/758/
7 The author was Dr. John Bates.
8 Rapide won the Design Automation Conference Best Paper Award in 1994.
9 U.S.-Canada Power System Outage Task Force, Final Report on the August 14, 2003 Blackout in the United States and Canada: Causes and Recommendations, April 2004. https://reports.energy.gov/BlackoutFinal-Web.pdf
10 There are nearly 2,200 RAWS located throughout the United States (USGS, 2008).
11 The Event Processing Technical Society, EPTS, www.ep-ts.com