
CHAPTER 8
Making Sense of Chaos in Real Time: Part 2
This chapter describes more advanced event processing strategies that may be employed on event inputs after they have been put through gross filtering:
- Abstracting patterns of events
- Levels and views
- Hierarchies of events and why they are important
- Methods of defining event hierarchies
- Using computable event hierarchies
- Drilling down, reversing abstraction, and retrieving information when you need it
The event processing techniques described in this chapter go beyond the capabilities available in the CEP tools in the current marketplace.1 But as event processing matures, we believe that these techniques and the tools to apply them will appear in the marketplace. Within a few years, the event processing techniques described in this chapter will become part of common practice. In fact, in special cases it can be argued that they are already in use!
One of the main problems today is information overload. As we have seen, restricting event inputs is a dangerous practice, because it puts the enterprise in danger of missing vital information. The standard approach to tackling this problem is the use of gross filtering strategies described in the previous chapter.
Another approach to solving the information-overload problem, one that complements the gross filtering strategies and can be used in conjunction with them, is to organize events into levels of abstraction. Organizing events into levels of abstraction is one of the goal-specific strategies that can be used in processing flows of events (see Chapter 7, Figures 7.2 and 7.3).
Different levels provide different views of the information contained in the flows of events as they arrive, in real time. The objective is to deliver the right information to the right people. This requires matching event patterns to the input events that have passed through gross filtering and then using the matches that are detected to create higher level abstract events.
Interestingly, if you look at commercial CEP applications today, you will see abstract events being created all over the place. But nobody pays any attention to the concept of abstraction. The immediate problems can be solved without thinking explicitly about the underlying principles or how one abstract event relates to another. At present, the power of event abstraction is used in unconscious, ad hoc, and informal ways. We should stop muddling along and apply abstraction more precisely! This is a next step in establishing longer term commercial applications of event processing.
An abstract event can be used to summarize the data contained in a set of events. This is a technique in CEP called abstraction. One advantage of abstract events is to reduce the number of events being processed while retaining the information that is relevant to our goals. Consider Example 8.1.
Example 8.1: Abstractions of Stock Market Feeds
For example, look back at the market trading application discussed in Chapter 3, in the section on “Event Streams” and in Figure 3.7. An event processor is computing on the data in trading events from two stock market feeds. There are probably thousands of events per minute arriving in this input. The processor computes the volume weighted average price (VWAP) of each of the stock symbols over a time window and outputs a stream of events that contain the VWAP values of the trades in each stock over each time window.
For example, suppose the time window is five minutes, and IBM trades reported during one of the five-minute windows are (1) 100 shares at $166.25, (2) 500 shares at 165.8, and (3) 200 shares at 165.5. Then the processor will output a VWAP event for IBM of 165.78 over that five-minute time window. Three trade events were input and one VWAP event abstracted their data over the time window. The processor computes one VWAP event for each stock symbol that arrives in the input streams no matter how many trades of that stock were reported in the five-minute window.
The VWAP processor is creating a particular kind of abstract view of trading activity that traders find useful without having to look at all the individual trades.
Abstraction is often used as a tool to concentrate information that is spread out in little pieces over a large set of events and maybe also over a large time window.
Abstraction: An event is an abstraction of a set of events if it summarizes the information contained in the events in the set.
An event created for this purpose is called an abstract event. Notice that an abstract event need not contain all the information in the set of events, but just a summary of that information. How a summary is computed from the information in the set of events is left open.
We don’t often think of some popular kinds of event processing as computing abstractions. But in fact, they usually are (see Example 8.2).
Example 8.2: Online Retail Website Monitoring2
During the online operation of a retail website, hundreds or thousands of customers may be logged on to the website at any time. Customer visits are tracked in real time. Each completed customer visit is represented by a sequence of events in which a customer logs onto the site, searches a catalogue, reviews items, chooses items and puts them in a shopping cart, and then “pushes” the cart through a checkout process. Of course, there are cycles where an item is chosen and later discarded, but let’s filter out those cycles from the shopping sequence. For different customer visits, the sequences are different and contain different numbers of events. But each completed visit could be abstracted by a single event, completed visit, containing only the data the website owner wants to keep: for example, customer name, date, amount of sale, length of time of the visit, and traffic density (i.e., the number of other customers visiting the website at the same time).
In Figure 8.1, the input events are flowing at a high rate—say, several hundred per minute. The figure shows real-time functions that compute abstractions of the input activity, as it is happening, by recognizing event patterns in the input. For example, the financial summary event will be an abstraction of patterns of those events in which a customer purchases items. A behavior profile event will be an abstraction of the events tracking a customer’s activity on the website (e.g., type of items viewed, enquiries made, type of items purchased, and so on). Obviously, there are many ways to compute abstractions of a customer’s behavior. These are higher-level events. The numbers of higher-level events are far fewer than the numbers of input events, as they are intended to abstract or summarize sets of events in the input activity.
FIGURE 8.1 Abstractions Applied to Patterns of Events from Consumer Activity on a Retail Website Can Lead to Different Views of the Same Events
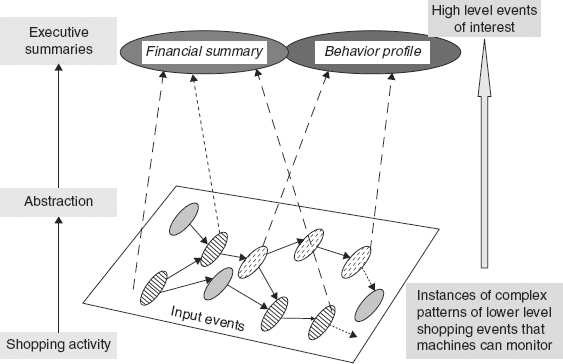
For example, eighty raw events of customer activity might match a pattern consisting of a Login, followed by several iterations of (Search or Choose or Add-to-cart or Discard), followed by Checkout and Logout events. This pattern would be abstracted to a few executive summary events.
The executive summaries would depend upon the interests of various departments within the website organization. For example, the shipping department might want a summary event containing the number of items checked out and purchased, their weight, and the customer’s delivery address. The marketing department might want an update of the customer’s profile, with the categories of items purchased.
Our interest is in how to define those higher-level events that give us the abstractions.
There are many methods of defining an abstraction of a set of events. In Example 8.2, on monitoring customer’s behavior on a retail website, one abstraction might be the total price of the customer’s purchase at the end of shopping. Other abstractions could be the categories of articles purchased or a behavior profile of how the customer spent the time shopping—did they spend a lot of time discarding items and then choosing others, and so on?
Different abstractions provide different views of the same set of events as illustrated in Figure 8.1.
Views: A view is a set of abstract events that are frequently used together in the same context. A view is specified by the set of types of the events in it.
One use of abstraction is to provide real-time views of the event activity being monitored. The goal is to condense information that is spread out over a large number of events into a smaller set of abstract events. A view has a specific purpose—for example, to profile or categorize a customer according to different measures, to compare sales in different areas of the country, or to monitor for violations of service-level agreements and other policy constraints.
Figure 8.2 illustrates different uses of higher-level events to analyze the input flow of events in real time. There is a continuous flow of input events from the different sources that are being monitored. These are shown at the bottom. This input is searched continuously for patterns of events that are specified in advance in the event pattern rules engine but may be changed at any time. Whenever an instance of a pattern is detected, a rule is triggered, resulting in creation of a higher-level event containing data from the events in that instance of the pattern. These data provide a view of the pattern instance.
FIGURE 8.2 Pattern-Triggered Rules Abstract Information in Higher-Level Events Used for Making Management Decisions
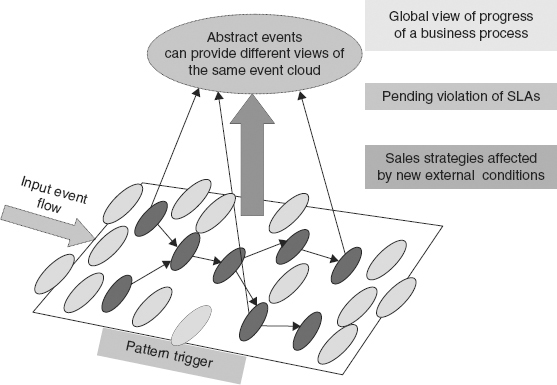
The higher-level event could be called a “view” of the lower-level activity. Different pattern-triggered rules can give totally different views for specific purposes. For example, the state of a business process, the possibility of an SLA being violated, or changes in a sales environment.
One implication of using abstractions is that we will want to create new abstractions, or improve previous ones, all the time. Once we start using views, we will be continuously improving them to suit the demands of the business. This implies that the methods of defining views should be easy and accessible online.
Note: The creation of an abstract event does not imply the deletion of the set or pattern of events (i.e., event objects that represent the events) that it abstracts. Those event objects should always be retained for recording and analysis of the performance of the method of abstraction although they may take no further part in the processing. And remember, an event (i.e., the thing that happens) can never be deleted from history! The equivalent of deleting an event object is to filter it out of the event processing (i.e., forget it).
Levels of Abstraction and Views
Not only are there different views of the events in an activity, but some views are more abstract than others. This leads to the concept that there are different levels of abstraction and viewing, as shown in Figure 8.3.
FIGURE 8.3 Levels of Views of Activity
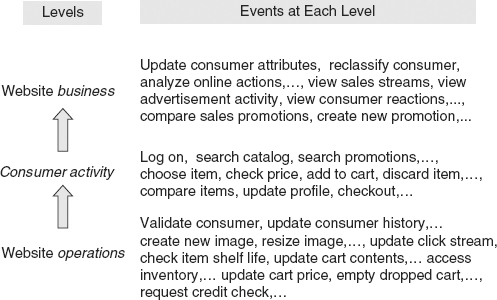
Figures 8.1 and 8.3 are related. Figure 8.1 shows how higher-level events can provide different views of the activity of customers in a retail website. Each view consists of a set of higher-level events. Figure 8.3 shows how views can be organized into different levels according to their abstraction.
The lowest-level view contains the actual operations performed behind the scenes by the implementation of the website. They are invoked when a customer uses the features and operations available to users at the interface of the website. Second-level views consist of visible activities specified in the website interface that the customer actually performs. And third-level views give a business summary of what customers buy and how they behave. The third-level views are clearly abstractions of second-level events.
Example 8.3: Mappings between Levels That Create Abstract Events
At the consumer activity level (Figure 8.3) we might have the following set of events: “customer C logs on,” “C views website catalogue,” “C selects a category of items,” “C searches for the cheapest item,” “C selects an item,” “C purchases the item,” “C logs off.” The website activity viewer may contain an event pattern that would be matched by a subset of these events—say, “customer views catalog,” “customer selects an item,” “customer purchases the item.” And the activity viewer might then create a business-level event that gives a business view of that instance of the pattern. For example, it might create a business-level event, “customer assigned score A at time T,” in which A is a cumulative sum of the prices of items purchased in that shopping activity during time T. In this way, the activity viewer would be mapping sets of events at the consumer-activity level to events at the website business level.
Example 8.3 is an example of a rule triggered by an event pattern that maps sets of events at one level to events at the next level. A computable event hierarchy is implemented by sets of these mappings between the various levels in the hierarchy.
Figure 8.4 illustrates possible applications of the views at the three levels in Figure 8.3. The first level of website operations provides a view that is useful for managing the network operations.
FIGURE 8.4 Different Views for Different Purposes
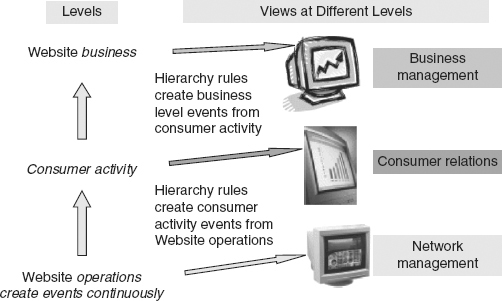
At a higher level, a view of consumer activity events is used in consumer relations, sales promotions and product planning. An even higher-level view, abstracted from consumer activity, provides a business intelligence view of website operation, its profitability, trends in sales, consumer interest, and so on.
It must be emphasized that the different levels of viewing are taking place in real time, as the website is in operation and customers are using it. So there is a continuous flow of events at all three levels. The events at level 2 are being created from patterns of events at level 1 by pattern-triggered rules. Similarly, the events at level 3 are created from patterns of events at level 2.
So we come to a concept of levels of abstraction or levels of views. How can it be said that one view is a higher level than another? There is no accepted standard for organizing views—of events in a website or any type of events anywhere else—into levels. For example, some people might argue that the activities (and corresponding events) shown in the view at level 2 in Figure 8.3 are not any higher or “more abstract” than those at level 1. A counter argument would be that the level 2 events are composed of sets of level 1 events. A level 2 event is created whenever a particular pattern of level 1 events happens and triggers a rule that creates the level 2 event. But there can be little argument that events at level 3 are higher than those at level 2.
Again, there might be disagreement as to whether the events listed at level 3 all belong at one level! The definition of computable event hierarchies will probably be the result of a lot of consensus formation within a particular IT technology sector. As we said at the beginning of this chapter, this is new ground in applying event processing.
The decision to classify or name a set of types of events as a view is quite arbitrary. At the moment, there are very few standards to which one can refer.3 And having defined some views, it is another issue as to how they can be compared and organized into a hierarchy. Indeed, some views might be considered to be as abstract as one another (i.e., at the same level of abstraction). Other views might be very clearly at different levels of abstraction, one being more abstract than the other. On the other hand, there will be many cases of pairs of views for which there is no general agreement as to whether one is more abstract than the other. Unless views are defined from the beginning to be comparable to one another by mappings, most views will be incomparable as far as abstraction is concerned.
However, to develop methods of viewing the activity within an enterprise and dealing with information overload, the set of views to be used should be organized from the bottom up. The base view must use the event sources that are available, the raw events. Starting from the base, views can be developed on demand, in response to what is needed.
One way to establish levels of views is to define how the events in one view can be composed from sets of events in the other view. Thus, in organizing sets of events into views and views into levels, as shown in the previous figures, there are two decisions that must be taken:
1. Decide which types of events belong in the same view
2. Define how events in one view are composed of sets of events in lower views
This is new territory, and its commercial value is as yet unexplored. One obvious use is to provide a real-time flow of different views of the events created in a system to observers (either people or programs) that have different interests in the events in that system. Typically, enterprises are hierarchical in their organization, and different role players within the enterprise—from network managers to the CEO—will require different views of the raw events and information in them, as Figure 8.4 illustrates. Thus a hierarchy of views of the raw events will correspond to the organizational levels within the business or enterprise and the requirements of its role players.
But as we mentioned at the beginning of the chapter, the overall problem is to deal with information overload—and that is where levels of abstraction and views have application. The numbers of events at higher levels of abstraction decrease rapidly with increasing levels, because sets of events are being mapped into single higher-level events.
Computing Abstractions by Event Pattern Maps
In CEP, an abstraction is required to be computable. This means that to create abstract events that summarize the information in a given set of events, there must be a computable method of creating those abstractions.
Having decided upon the abstractions to be used in viewing the enterprise’s activities, the next question is to develop real-time methods of computing those abstractions and the corresponding views. In fact, the computable method should be part of the definition of the abstractions and views.
Computable abstraction: An event is a computable abstraction of a set of events if it summarizes the information contained in the events in the set and there is a method of computing that event. Example 8.4 gives a practical use of this concept.
Example 8.4: VWAP Events Are Computable Abstractions of Streams of Stock Market Trades
The VWAP is an abstraction of a set of stock market feeds. Chapter 3, in the section on “Event Streams,” describes a method for computing the VWAP over a time windows of events in stock market feeds.
One method of computing abstract events is by means of event pattern mappings.
Event pattern map:
An Event pattern mapping is a function that takes as argument a pattern of events and creates an event as the result of its computation.
Two event pattern maps are illustrated in Figure 8.1. Map f computes financial summaries from the raw events in an input cloud, while map g computes customer behavior profiles from the same sets of input events. These maps are computed continuously in real time as the input events flow into the enterprise. So Figure 8.1 illustrates a continuous flow of abstract events being computed from the input flows.
An event pattern map can be defined by a set of reactive rules, each of which is triggered by a pattern of events. When a rule is triggered, it creates an event that summarizes the information in the set of events that triggered it. A map may consist of several pattern-triggered rules. If we want to see what the code for a map might look like, Example 8.5 gives the code for a map that summarizes the patterns of shopping activities of customers over periods of time as abstract shopping report events, and Examples 8.6 and 8.7 show practical applications of the event pattern map.
Example 8.5: Summarizing Retail Website Activity
map Shopping Reports
Customer C, Item I;
whenever C Logs on to Website at T1 and C checks Items and
C adds I to cart followed by C checks out at T2 and
C Purchases I at T3 followed by C Is Approved
then create Shopping Report (C, I, T1, T3)
Examples 8.6 and 8.7 are some more examples of mappings that compute abstractions of patterns of activity.
Example 8.6: Profiling Internet Activity from Outside Sources
Monitoring the activity in a large organization’s network that is originating from outside Internet sources can be automated by event pattern mappings. Such a map is a function that computes summaries of network scans from outside IP addresses and creates an abstract event containing the summaries for a specific time window. The function takes as input a sliding time window of the events from outside sources. The input events are level 1, let’s say. It creates an abstract event that summarizes the activity during the time window from each outside IP address. There are many different possible output formats for the summaries. For example, a summary event might contain an array indexed by the outside IP addresses that are sources of scanning activity. The elements of the array would contain the internal network IP addresses that were scanned within a given time window, and the time spent scanning that internal IP address. These abstract events form level 2, let’s say.
It would be possible to go further and create a set of level 3 events that characterize the nature of the network activities that are summarized by the level 2 events. This could be done (1) by using knowledge of the outside source IP addresses as, say, “friendly,” “known local,” “unknown,” “suspected botnet,” etc., and (2) by analyzing the nature of the attempted accesses, as say, “remote callback,” “synchronizing grid heartbeat,” “port scan,” “DNS attack,” and so on. Level 3 events would contain suspected classifications of the nature of the network activity from the outside sources.
Example 8.7: Viewing Activity of a Feet of Delivery Trucks
The online human operator monitoring a fleet of 400 trucks in a previous example needs a little help. Instead of viewing the progress of each truck on its delivery schedule, the monitoring system should compute views that summarize the fleet activity. There are many ways to do this. For example, the area map displayed on the monitor (Figure 5.1) can be divided into sectors.
A sector view could summarize the on-time progress of each truck in the sector. If a sector is green, then every truck in that sector is on schedule; if its view goes yellow, then there are one or more trucks in that sector that have deviated from their schedule in some way (e.g., they are at least ten minutes behind schedule). A red sector would indicate serious problems such as a breakdown or accident. The operator should be able to drill down by clicking on a sector to see the actual truck activity and their statuses.
A different view might be a trip plan view of the truck fleet. The progress of each truck is monitored for consistency with its preassigned delivery plan. As long as a truck’s progress is within specified consistency bounds with its plan, the view shows a green light. If a truck deviates from its plan beyond the specified bounds, the view changes to show the truck’s position on the map and the parameters of its deviation from its schedule. The trip plan view might then trigger a process to plan getting the truck back on schedule.
Too much information contained in large numbers of events is just as self-defeating as too little. That’s where event pattern maps and computable abstractions can be useful! They give us a method of organizing the viewing of the raw input events into higher-level views of the information. We can slice and dice information for different people according to their roles and needs within the enterprise and, at the same time, reduce the number of events that must be viewed. Essentially, event pattern maps are a tool for the efficient use of information—providing of course that we can define maps for computing our abstractions.
The basic plan is very simple. Various role players in an enterprise need specific information related to their jobs. So we use event pattern mappings to compute the views of the incoming information that various role players need.4 This is illustrated in the previous figures.
Next, we must deal with the problem of relating the views. How are different abstractions and views related? And is there a way we can organize them to keep the growth of different abstractions of the enterprise’s information under control? One approach is to use event hierarchies.
Hierarchical structure is ubiquitous in everyday life. There have been standard hierarchies in some areas of science for many years, for example in hardware design and in networks. The Open Systems Interconnection (OSI) Seven-Layer Model5 of messaging operations was developed in the 1970s. Its purpose was to develop a standard for layers of messaging operations, with the assumption that operations at each layer were “conceptually similar functions that provide services to the layer above it and receives service from the layer below it.”
Notice that open-ended phrase, “conceptually similar functions”! And notice also the idea that functions at one level “provide services” to functions at the level above. In our terminology this means that there are event pattern mappings whereby a function invocation at one level is composed of a set of function invocations at the level below.
The OSI standard does not specify how an event at one level is composed of sets of events at the level below it. The relationships between layers were left open. There have been arguments both for and against the layering idea.6
In CEP, we view an event hierarchy as consisting of levels of types of events. The types of events at a level are conceptually similar to one another. But, more than that, we require two conditions.
Computable event hierarchy: a hierarchical organization of sets of types of events into levels so that:
1. The types of events at one level are abstractions of sets of types of events at the level below, level 1 being the raw input events.
2. There are event pattern maps between levels that compute the events at one level in terms of sets of events of the types in the levels below.
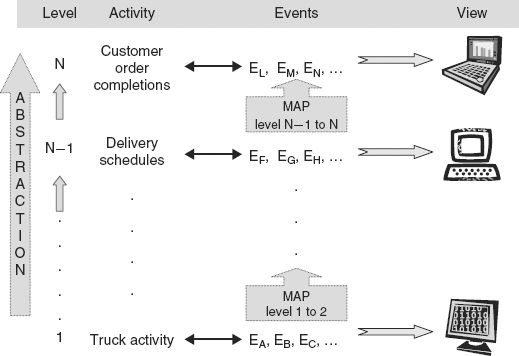
The abstraction relationships between events at different levels are computable both up and down the hierarchy. Figure 8.5 illustrates this idea. Each map computes events at the next level from sets of events at the level below.7
FIGURE 8.5 A Computable Event Hierarchy Using Mapping between Levels
Flexibility of Hierarchy Definitions
Notice one other property of an event hierarchy—flexibility. Event hierarchies are flexible in the sense that they can be easily changed. A new level of events can always be inserted between existing layers or added at the top or bottom, and an existing level can be deleted. To do this, the mappings between levels must be added or changed.
For example, to add a new level between, say levels N and N + 1, one must add the event types of the new level and two sets of mappings, one from level N to the new level, and another from the new level to the old level N + 1 (which is now level N + 2). A computable event hierarchy is never set in stone!
Computable event hierarchies let us focus events within the enterprise for specific purposes at each level of activity and management. Experience also shows that the numbers of events decrease at higher levels, sometimes exponentially, as the information contained in sets of lower-level events is concentrated into single higher-level events. Intuitively speaking, higher-level events are bigger in the sense they contain more information than lower-level events, but there are fewer of them!
Classifying event types into a CEP hierarchy, as shown in Figures 8.3, 8.4, and 8.5, gives us a computable method of organizing the use of event abstraction. This is a fundamental concept of CEP. But it has to be done with care and precision to be useful.
The complementary concept of drill down in a computable event hierarchy is equally important. It is the means of explanation. And it is to be considered a part of event abstraction.
Retrievability in a computable event hierarchy: Given an abstract event in a computable event hierarchy it is possible to retrieve the set of events that it abstracts.
For example, to analyze a successful sale event in the retail website we must be able to recall the sequence of events of that particular website visit. Note that two identical successful sale events (i.e., same customer, items, sale amount, but at different times) might well abstract different sequences of website activity. Perhaps on the first visit the customer chose and then returned some items, whereas on the second visit the customer knew exactly what was wanted.
The reason that retrievability is possible in event hierarchies is that computable event pattern maps can be reversed.
Every computable event pattern map has an inverse, called the reverse map. A reverse map, if given an event E at level N + 1 will retrieve the set of events at level N that comprise E.
Reverse maps allow drill down to provide explanations as to how higher-level events were constructed from sets of lower-level events, as illustrated in Figure 8.6.
FIGURE 8.6 Inverse Mappings in a Computable Event Hierarchy
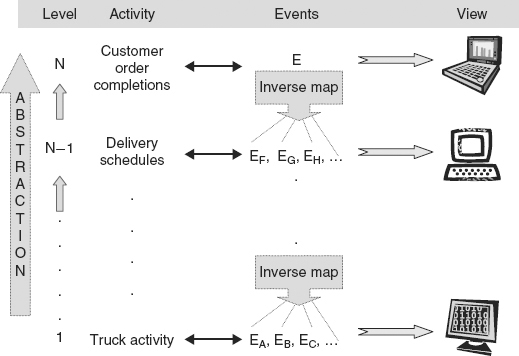
For example, we can view a financial summary as being made up of financial accounting events. If a company-wide financial summary arrives on the CEO’s desk, he might well ask to see the next level of detailed accountings that were used to compose that summary. This might result in a drill down through more levels of details. The next level down might consist of financial summaries by geographic or logistical region; at an even lower level, one might see the costing and profits from each type of company activity in a region.
Drill down in a real-time event hierarchy must be an automated operation; consider Example 8.8.
Example 8.8: Truck Feet Monitoring Revisited
The previous example of monitoring the activity a fleet of delivery trucks can be abstracted to allow two or three levels of monitoring for different purposes. Three possible levels, going top down from level 3 to level 1, with examples of the possible event types at each level, could be as follows:
3. Top level: Sales and service profiles. This level would monitor events such as the status of service agreements with customers, customer orders, sales and promotions, publicity on new products, demand forecasts and product manufacturing forecasts, . . .
2. Middle layer: Supply chain forecast and management. New product orders, product manufacture orders, warehouse management, restocking, delivery planning, delivery schedules, . . .
1. Bottom layer: Fleet management. Personnel schedules, truck maintenance schedules, truck status, warehouse stocks, immediate delivery planning, truck trip plans, . . .
Reverse maps between these layers would enable a manager of the delivery fleet to see explanations of events at the highest layer. For example, if there was a complaint from a customer about the timeliness of a delivery completion, the customer’s order completion event could be expanded using a reverse map to immediately see in real time the events that were executed in the associated delivery schedule. If a number of separate deliveries were involved in the order, each of those deliveries would be second-level events. These second-level events could also be expanded using reverse maps in real time to see the timing of the delivery truck movements, loading, route execution, and deliveries. If the customer’s complaint was correct, the actual components of the order that were behind schedule could be traced, together with the causes for the contract violation. Diagnosis might suggest corrective actions.
Every detail of these abstraction examples can be argued with: which events should be at each level, are there events that should have been included at a particular level, pairs of events that should or should not be at the same level of abstraction, and missing levels of abstraction. All of which illustrates a crucial point in applying the notion of hierarchy to organizing events: the need for flexibility to modify an event hierarchy, add new levels of events, delete levels and change, or delete or add mappings to the hierarchy.
Summary: Dealing with Information Overload
The need for analyzing large numbers of raw events and concentrating the information they possess for different purposes and different users will increase the importance of the CEP abstraction and hierarchy techniques we have described. When this technology is introduced, we predict that the separate demands of the different users will surface and be made more explicit.
Bearing in mind that the input sources of events will be ever expanding and that the variety of types of input events will continue to grow,8 here is a short summary of the advantages and capabilities of computable event hierarchies:
1. Focused information. A primary advantage is to provide different role players in an enterprise with the kind of information they need abstracted from the available event sources. Each job requires a different kind of information. Network administrators need lower-level network events and statistics, while managerial levels need more abstract information (see Figure 8.4). The views in a hierarchy should reflect those requirements.
2. Efficiency of event processing. The numbers of events at each level in a hierarchy will decrease exponentially. Processing higher-level views will be less demanding in terms of scale of input event throughput, although making the best use of higher-level views may require sophisticated analytical techniques.
3. Understandability. The principle that each event contains a fragment of the information needed means that a human must look at lots of lower level events to gain an understanding of that information. If the views in the hierarchy levels correspond to the “right” abstractions that the stake holders require,9 then fewer higher-level events are needed to provide a humanly understandable view of the information.
4. Flexibility. A computable event hierarchy can easily be modified to meet the changing requirements to add new views of incoming events, to integrate new types of event sources into the views, or to eliminate existing views. Adding a new level of events is achieved by defining that level and the mappings between it and the levels above and below. Deleting a level involves composing the two layers of maps into a single layer of maps spanning the gap between the levels below and above. Usually this is a straightforward functional composition of the maps.
5. Ease of process construction. Fewer higher-level events will be needed to construct event-driven business processes. It is easier to define or modify event-driven business processes when the events are humanly understandable and the event patterns that trigger the processes involve small numbers of events.
6. Correctness. Questions of correctness of event-driven business processes are easier to analyze when humanly understandable events are involved, which usually means higher-level events.
Notes
1 The year 2011.
2 In Chapter 6, we discussed how to define patterns of customer visits to a website. Here, we discuss how to abstract those patterns of behavior.
3 Two well-known examples are the TCP/IP messaging hierarchy: R. Braden, Editor, “RFC 1122: Requirements for Internet Hosts—Communication Layers” Internet Engineering Task Force, available online at http://tools.ietf.org/html/rfc1122, and the Open System Interconnection Reference Model: Rachelle Miller, “The OSI Model: An Overview.” SANS Institute Reading Room, available online at www.sans.org/reading_room/whitepapers/standards/osi-model-overview_543
4 The role players will be consulted throughout the setup of an event viewing system for a company.
5 Rachelle Miller, “The OSI Model: An Overview.” SANS Institute Reading Room. Available online at www.sans.org/reading_room/whitepapers/standards/osi-model-overview_543
6 Some Internet Architectural Guidelines and Philosophy, OSI Internet Working Group, 2002. http://tools.ietf.org/html/rfc3439, section 3.
7 More generally, a map may use events from several lower levels below level N to compute an event at level N.
8 See Chapter 6, the section entitled, “Patterns and Pattern Matching,” and the expanding input principle.
9 Defining the hierarchy requires the end users be kept in the loop at all times.