
2
Tyre Dynamics
2.1 Tyre Models
Tyres are important components of automobiles; they support the weight of the car and reduce the impact from ground, amongst other things. At the same time, through the interaction between the tyre and the ground, forces and torques which change the car’s motion can be produced. The forces and torques include tractive force, braking force, and aligning moment. The dynamic behavior of tyres is critical to the car’s handling, ride comfort, traction, and braking performance. The accuracy of dynamic performance analysis and the success of the chassis control system design rely heavily on the accuracy of the vehicle dynamics model and the tyre dynamic model.
Modern tyres are complex viscoelastic structures. The relationships between forces, deformation, and motion are highly nonlinear; thus, it is very difficult to establish a precise mathematical model. Since the 1930s many scholars have carried out plenty of research and achieved fruitful results on tyre modeling. In summary, tyre models fall into three categories: theoretical models, empirical models, and semi-empirical models. Before explaining these models in detail, some terminology and concepts are introduced in advance.
2.1.1 Terminology and Concepts
- Tyre axis system and six-component wheel force
The standard tyre axis system defined by the U.S. Society of Automotive Engineers (SAE) is the most commonly used in tyre modeling. Three forces and three moments acting on the tyre by the road can also be shown in this axis system. They are also known as the tyre 6-component wheel forces, shown in Figure 2.1.
The origin of the coordinate system is the center of the tyre road contact patch. The X axis is defined as the line of intersection of the wheel plane and the road plane with its positive direction being forward. The Y axis is perpendicular to the X axis and parallel to the pivot of the wheel, with its positive direction being to the right when viewed from the positive X direction. The Z axis is perpendicular to the road plane, with its positive direction pointing downwards.
The forces found on a tyre are: the longitudinal force Fx, the lateral force Fy, and the normal force Fz. The longitudinal, lateral, and normal forces are in the X, Y, Z direction respectively. The positive directions of these forces are shown in Figure 2.1. The moments found on a tyre are: the overturning moment Mx, the rolling resistance moment My, and the aligning moment Mz. The overturning moment, the rolling resistance moment, and the aligning moment are applied on the X, Y, and Z axes respectively; their positive directions are shown in Figure 2.1.
- Slip ratio
Normally, a rolling wheel on the ground will slide (slip or skid). In order to quantify the proportion of the sliding to the wheel rolling movement, the concept of slip ratio is introduced. If the rolling radius of the wheel is rd, the travelling speed of the wheel is uw, the angular velocity of the wheel is ω, and then the slip ratio is defined as:
(2.1)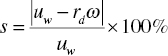
- Tyre slip angle
The tyre slip angle is the angle between the actual travelling direction of a rolling wheel and the direction towards which it is pointing. If the wheel travel speed is uw, and the lateral velocity is vw, then the tyre slip angle can be expressed as:
(2.2)

Figure 2.1 Tyre coordinate system with forces and moments on the tyre.
2.1.2 Tyre Model
Tyres are modelled as a set of mathematical expressions which describe the relationship between the tyre’s 6-component forces and wheel parameters. The output of these models are 6-component tyre forces, and the input parameters are the slip ratio, slip angle, radial deformation, camber angle, wheel speed, and yaw angle. The relationship between the inputs and the outputs is highly nonlinear. Here are some commonly-used models.
2.1.2.1 Unified Semi-empirical Tyre Model
This model was proposed by Professor Konghui Guo (Fellow of Chinese Academy of Engineering)[1]. It is suitable for the conditions of longitudinal slip, side slip, and combined slip when the tyre is rotating in a steady-state condition. It can also be extended to non-steady cases through the use of “effective slip ratio” and “quasi-steady” concepts.
In the steady-state condition, under pure longitudinal slip, pure side slip, and combined slip conditions, the tyre’s longitudinal force, lateral force, and aligning moment can be calculated using the following equations.
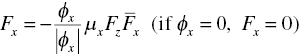
- Longitudinal force under pure longitudinal slip condition
(2.3)where ϕx is the relative longitudinal slip ratio,
 , μx is the longitudinal friction coefficient,
  ,
,  is the non-dimension longitudinal force,
  , Kx is the longitudinal slip stiffness, sx is the longitudinal slip ratio, and E1 is the curvature factor
  .
. - Lateral force under pure lateral slip condition
(2.4)where ϕy is the relative lateral slip ratio,

 , μy is the lateral friction coefficient,
  ,
,  is the non-dimension lateral force, ky is the cornering stiffness,
  , and α is the side slip angle.
 - Aligning moment under pure lateral slip condition
(2.5)where

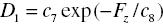
 , Dx0, De, D1, D2 are the parameters related to the vertical loads,
  ,
,  ,
,  ,
,  .
. - Longitudinal force, lateral force, and aligning moment under combined slip condition
(2.6)where
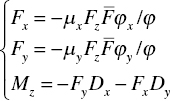
 is the non-dimensional shear force,
  , ϕ is the relative slip ratio,
  , Dy is the tyre lateral offset,
  , Kcy is the lateral stiffness, and a1, a2, … b1, b2, … d1, d2 can be obtained from tyre test data.
2.1.2.2 “Magic formula” Tyre Model
In recent years, the “magic formula” tyre model has been widely used in the study of vehicle dynamics and control systems. The “Magic formula” was proposed by Professor Pacejka[2] from Delft University of Technology. A combination of trigonometric functions was used to fit tyre experimental data. The formula can calculate longitudinal force, lateral force, and the aligning moment. Its general form is shown below.
where y is the longitudinal force, lateral force, or aligning moment, x is the tyre slip angle or longitudinal slip ratio, D is the peak value which represents the maximum value of the curve, C is the shape factor which indicates which force the curve represents (lateral force, longitudinal force, or aligning moment), B is the stiffness factor, and E is the curvature factor which represents the shape of the curve near the peak value.
Under pure driving or braking conditions, the longitudinal forces, lateral forces, and aligning moments on the tyre can be expressed as follows.
- Lateral force
(2.8)where

 ,
,  ,
,  ,
,  ,
,  ,
,  , Sv is the curve shift in the vertical direction,
  , Sh is the curve shift in the horizontal direction,
  , Fz is the vertical load, γ is the camber angle, and ai (i = 0,1, 2…12) the parameters fitted by the 12 data points.
 - Longitudinal force
(2.9)where

 ,
,  ,
,  ,
,  ,
,  ,
,  ,
,  ,
,  , and S is the longitudinal slip ratio.
 - Aligning moment
(2.10)where

 ,
,  ,
,  ,
,


2.2 Tyre Longitudinal Mechanical Properties
When a vehicle is in motion under different conditions, the properties of the longitudinal forces of different tyres are different. Under driving conditions, the longitudinal forces are driving forces and rolling resistances on the driving wheels, and rolling resistances on the driven wheels. Under braking conditions, the longitudinal forces on the wheels are braking force and rolling resistance.
The method for calculating tyre driving and braking forces in different conditions has been presented in the previous section. Rolling resistance will be mainly discussed in the following section.
The force-resisting automobile motion which is generated between the tyre and the road is called rolling resistance. This force consists of three components: tyre rolling resistance, road resistance, and side slip resistance. When a pneumatic tyre rolls on a straight, dry, and hard surface, the resistance to the automobile is caused by the hysteresis of the tyres and the friction between the tyres and the road; this phenomenon is called tyre rolling resistance. The resistance caused by an uneven pavement, pavement deformation, wet roads, and other road conditions is called road resistance. The tyre longitudinal resistance due to tyre cornering is called side slip resistance.
2.2.1 Tyre Rolling Resistance
As can be seen from the definition, tyre rolling resistance is composed of tyre elastic hysteresis resistance, which is caused by the elastic hysteresis, friction resistance between the tyre and the road caused by relative sliding, and fan effect resistance generated by air loss due to the rotational movement of the tyre[3]. For convenience, the detailed causes of rolling resistance of a moving tyre on a flat, dry, and hard surface will be discussed.
- Elastic hysteresis resistance
The rolling process of a tyre on a road can be described by using the equivalent model of a wheel system. Suppose the wheel is composed of a number of radial springs and dampers between the outer surface and the rim, and a series of tangential springs and dampers which represent the tyre tread (see Figure 2.2).
When a wheel rolls on a road, every unit of the wheel experiences repeated cycles of deformation and recovery. The unit entering the contact area is undergoing a deformation process, while the unit leaving the contact area is going through a recovery process.
Experiments show that the work done to the tyre in the deformation process is greater than the work released during the recovery process (see Figure 2.3). The energy lost is converted into heat and dissipated into the air. Thus, the energy of an automobile is wasted and the vehicle is subject to resistance. Because the relative movement between adjacent layers will produce damping work, for tyres with same ply material, the more layers there are, the greater the damping of the tyre. Elastic hysteresis resistance is denoted by FR,Elastic hysteresis.
- Frictional resistance When a tyre unit is continuously entering into a tyre–road contact area, relative sliding in both the longitudinal and lateral directions will take place between the road and the tyre. Thereby, it causes additional friction resistance between the tyre and the road, which is denoted by FR,friction.
- Fan effect resistance
Just like the action of a rotating fan, the rotational motion of a tyre will cause air loss, resulting in “fan effect resistance”, which is denoted by FR,fan.
Thus, when a tyre rolls straight on a dry, hard, flat road, the rolling resistance can be expressed as
(2.11)

Figure 2.2 Wheel system equivalent model.

Figure 2.3 Tyre 9.00-2.0 radial deformation curve (tyre hysteresis loss).
2.2.2 Road Resistance
When an automobile moves on an uneven, plastic and wet road, the tyre rolling resistance will increase. The increased resistance due to the road conditions is called “road resistance”.
- Uneven road
When a vehicle is travelling on an uneven road, the road roughness in the vertical direction acts as an excitation. The tyre is undergoing continuous deformation and recovery processes whilst moving up and down relative to the body of the vehicle. The energy released during the process of recovery is less than the work done to the deformation, thus the part of the vehicle that drives the power of the car is consumed by the road resistance due to the uneven road.
- Plastic road
When tyres roll on soil, sand, grass, or snowy roads which possess greater plasticity, the additional resistance caused by the road plastic deformation is defined as plastic road resistance, denoted by FR,plastic. It includes three parts: compression resistance, bulldozing resistance, and shear resistance. Detailed explanations of these resistant forces of vehicles driving on a plastic soil road are given below.
- Compression resistance
When tyres are rolling on plastic road surfaces, soil deformation occurs in the vertical direction as the soil is compressed and only a small portion can recover. The car power will be consumed for the compression of the soil, which causes additional tyre rolling resistance, which is called compression resistance.
- Bulldozing resistance
When tyres roll on a soft soil surface, some soil will be pushed to the front of the tyre, which is then pushed to the side or is finally compacted. The longitudinal and lateral movement of the soil will cause additional tyre rolling resistance; this is called bulldozing resistance.
- Shear resistance
Under vertical loads, tyre tread grooves insert into the soil, thus the rotation of the wheels tend to cut the soil. Friction generated between the tyre and the road results in additional tyre rolling resistance, which is called shear resistance.
- Wet pavement
In the longitudinal plane of a car, the rolling tyre tread wading area can be divided into three parts: water film district, transition zone, and direct contact region, as shown in Figure 2.4.In the water film district, the tread does not actually touch the road and most of the water is drained. In the transition zone, the tyre tread makes contact with the road partially, and the tyre is deformed. In the direct contact region, the tread and the road surface directly contact each other, and a small amount of water between the tyre treads is pressed out.

Figure 2.4 The wading area of tyres on wet pavement.
In the wading area, additional resistance will be produced to the rolling tyre during the process of drainage and contacting the road surface directly, as the so-called “turbulence resistance”. Tests show that the turbulence resistance depends basically on the volume of the water drained away per unit time which is determined by the drain water depth h, the wheel tyre width Wt, and the wheel rolling speed. The additional tyre resistance on a wet road is expressed as FR,thrash.
2.2.3 Tyre Slip Resistance
The preceding discussion on the causes of rolling resistance is based on the assumption that the wheel rolls parallel to the vehicle longitudinal plane. However, when a car is in motion, additional travel resistance is generated because of its structural features.
- Influence of tyre slip
The tyre side slip phenomenon appears when pneumatic tyres roll. The component of the lateral tyre force in the vehicle longitudinal plane is called the additional rolling resistance, which is denoted by FR,sideslip.
- Influence of wheel alignment
slip phenomenon appears when pneumatic tyresIn order to ensure good vehicle handling and stability, vehicles are usually calibrated with certain wheel orientation angles, such as the toe and camber angle. Similar to the phenomenon of tyre slip, the tyre rolling resistance increases due to the wheel toe angle and camber, which are denoted as FR,toe and FR,camber respectively.
2.2.4 Overall Rolling Resistance of the Tyres
As can be seen from the analysis above, the overall rolling resistance applied to a rolling tyre consists of a variety of resistances with complex causes. Some of them inevitably accompany the wheel rolling motion, such as tyre rolling resistance, and tyre slip resistance. Other additional resistances are caused by special road conditions such as road resistance. Thus, the elements of the total rolling resistance of a wheel are: FR,elastic hysteresis, FR,friction, FR,fan, FR,plasticity, FR,uneven, FR,thrash, FR,sideslip, FR,toe and FR,camber.
Under actual vehicle driving conditions, the overall resistance applied to the rolling tyres of a vehicle is composed partially or fully of the resistances introduced above. For convenience, the following formula is used to calculate the rolling resistance for general purposes:
where f is the rolling resistance coefficient, and Fz is the vertical wheel load. As can be seen from the equation above, when the vertical load is certain, the rolling resistance coefficient is the factor that affects the rolling resistance.
2.2.5 Rolling Resistance Coefficient
- The influential factors
The tyre rolling resistance coefficient is affected by the tyre construction, materials, pressure, vehicle speed, and road conditions. The rolling resistance coefficient of a vehicle at low speed on a given road is shown in Table 2.1.
Figure 2.5 shows the influence of the tyre pressure on the rolling resistance coefficient. As the tyre pressure increases, the rolling resistance coefficient decreases. Since the tyre stiffness increases with the tyre pressure, under a constant wheel load condition, the tyre deformation decreases accordingly. As a result, the elastic deformation energy is reduced. At the same time, the length of the tyre–ground contact area decreases, and the component of the tyre frictional resistance is also reduced.
The impact of vehicle speed on the rolling resistance coefficient is illustrated in Figure 2.6. As the speed increases, the rolling resistance coefficient increases slightly at lower vehicle speeds. Gradually, the graph shows a more significant gradient as the speed increases. The reason for this is that when the vehicle reaches a critical speed, the deformation of the tread which just leaves the contact area cannot recover immediately. The tyre is no longer circular, and a standing wave phenomenon occurs at its rim.
The tyre rolling resistance also depends on the structure of the tyre, materials, and rubber used. The rolling resistance of the radial tyre is generally smaller compared with a bias tyre. In addition, the structural design of the tyre tread also has an impact on the rolling resistance; shallow tread patterns and a well-designed tread profile can reduce the rolling resistance. However, as the speed increases, the impact of the tread patterns becomes smaller.
- Measurement of rolling resistance coefficient
There are two different methods to measure the tyre rolling resistance coefficient: the vehicle road test and the indoor bench test. The typical method for the indoor bench test is to place the wheel with the test tyre on a movable rolling surface. Test data can be captured by a force sensor on the wheel fixtures (such as the connecting rod system and rims). According to the rolling surface condition, a tyre test bench can be categorized into the following three types[4] (see Figure 2.7): external support bench, internal support bench, and flat bench. The most commonly used is the external support bench, the advantages of which are its relatively low cost, high load carrying capacity, and compact structure, leaving more space around the wheel. Thus, it not only can accommodate a variety of linkages to ensure the wheel alignment, but also it facilitates the installation of the wheel.
Table 2.1 The rolling resistance coefficient of a vehicle at low speed on a given road.
| Pavement type | Rolling resistance coefficient | |
| Good asphalt or concrete pavement | 0.010–0.018 | |
| General asphalt or concrete pavement | 0.018–0.020 | |
| Gravel road | 0.020–0.025 | |
| Good gravel road | 0.025–0.030 | |
| Pebble potholes pavement | 0.035–0.050 | |
| Pressed dirt road | Dry | 0.025–0.035 |
| Rainy | 0.050–0.150 | |
|
Muddy dirt road (the rainy season or thaw) |
0.100–0.250 | |
| Dry sand | 0.100–0.300 | |
| Wet sand | 0.060–0.150 | |
| Icy roads | 0.015–0.030 | |
| Compacted ski track | 0.030–0.050 | |
Figure 2.5 Influence of the tyre pressure on the rolling resistance coefficient.

Figure 2.6 The impact of speed on the rolling resistance coefficient.
Figure 2.7 Structure and characteristics of the tyre test rig.
2.3 Vertical Mechanical Properties of Tyres
When a normal load acts on a pneumatic tyre, a vertical deformation occurs. The relationship between the tyre vertical deformation and the normal load is the key when studying the vertical mechanical properties of a tyre which have a great influence on the ride comfort of the vehicle.
The “equivalent model of a wheel system” has been mentioned when the tyre rolling resistance was discussed. This model assumes that the wheel is composed of a number of radial springs and dampers between the outer surface and the rim, and a series of tangential springs and dampers which represent the treads. If a study is focused on the vertical dynamic behaviors of the tyre rolling on an uneven road surface, the model can be simplified to a point-contact linear spring–damping model as shown in Figure 2.8. In this model, the tyre’s vertical stiffness and damping are the main physical parameters that affect the vertical mechanical properties of the tyre. Compared with the damping of the suspension system, the tyre damping is much smaller, therefore it can be ignored in some models where only the vertical stiffness is then considered.

Figure 2.8 Point-contact linear spring–viscous damping model.
According to the test conditions, three different kinds of tyre vertical stiffness are defined: static stiffness, non-rolling dynamic stiffness and rolling dynamic stiffness. A brief introduction of static stiffness and rolling dynamic stiffness is given below.
- Static stiffness
Tyre static vertical stiffness is determined by the slope of the relationship curve between the static vertical load and deformation. Figure 2.9 shows the relationship curve between the vertical load and deformation of a passenger radial tyre. When the inflation pressure is constant, the relationship between the load and deformation is essentially linear, except under very low loads. So, it can be considered that in the actual load range the tyre vertical stiffness does not vary with the load. Figure 2.10 shows the relationship between the stiffness of a 165 × 13 type radial passenger tyre and inflation pressure[5].
- Rolling dynamic stiffness
Among the tyre design parameters, the tyre structure parameters (such as the crown cord angle, tread width, tread depth, and number of plies) and materials have a more significant influence on the stiffness of the tyre. Among the tyre operating condition parameters, the tyre inflation pressure, speed, normal load, and wear have a great influence on the stiffness of the tyre. There has been no general applicable conclusion about the quantitative description of the relationship between the tyre static stiffness and dynamic stiffness. Some studies have reported that, for a passenger car tyre, the roll dynamic stiffness is usually 10–15% less than the stiffness obtained by the static load deformation curve; for a heavy-duty truck tyre, the dynamic stiffness is approximately 10% less than the static stiffness[6].
Figure 2.11 shows the curve that describes the influence of the car’s speed on the rolling dynamic stiffness. When the car’s speed is slow, the tyre dynamic stiffness decreases significantly with the increase of car speed; but when the speed exceeds about 20 km/h, car speed has almost no effect on the dynamic stiffness.
The damping of a pneumatic tyre is mainly caused by the material hysteresis, and the magnitude of the damping force depends on the design and structure of the tyres, as well as on the tyre working conditions. Generally, it is not simple Coulomb or viscous damping, but the combination of both.
If a tyre is simplified as a single degree of freedom system that consists of a spring and damping, as shown in Figure 2.8, the theory of vibration analysis can be applied and the equivalent viscous damping coefficient Ceq and dynamic stiffness kz of the tyre can be obtained by dynamic test methods.

Figure 2.9 Diagram of the tyre loads and deformation.

Figure 2.10 Diagram of the static stiffness and tyre inflation pressure.

Figure 2.11 The influence of car speed on the rolling dynamic stiffness of a tyre.
2.4 Lateral Mechanical Properties of Tyres
The lateral mechanical properties of a tyre are mainly about the relationship between the lateral force, aligning moment of the tyre, and parameters such as the tyre slip angle, vertical load, and camber[7].Tyre models reflect the analytical relationships between the parameters just mentioned. A more detailed analysis of the properties and influencing factors is given below.
To a specific tyre, the main factors which influence the tyre lateral force are the side slip angle, vertical load, and camber. The side slip angle is determined by the motion parameters of the tyre, such as the vehicle longitudinal velocity, lateral velocity, yaw rate, steering angle, and other factors.
The vertical load of a tyre is determined by the vehicle axle load distribution when the vehicle is designed. The weight is transferred when the vehicle is under running conditions. The initial value of the camber is determined during vehicle design. However, the rolling motion of a moving vehicle has a certain impact on the wheel camber value.
Figure 2.12 (a), (b), (c) illustrates the relationship between lateral force and sideslip angle, vertical load and camber under the condition of pure steering, respectively. As can be seen in the figures, when the slip angle, vertical load, and camber angle are relatively small, the lateral force can be considered as having a linear relationship with them. When they exceed certain values, this linear relationship will no longer exist.

Figure 2.12 The tyre lateral force characteristics of a car. (a) The relationship between tyre lateral force and slip angle. (b) The relationship between tyre lateral force and vertical load. (c) The relationship between tyre lateral force and camber angle.
Figure 2.13(a), (b), (c) illustrates the relationships between aligning moment and sideslip angle, vertical load and camber under the condition of pure steering, respectively. The aligning moment increases gradually with the increase of the slip angle when the sideslip angle is relatively small. The aligning moment decreases with the slip angle after the aligning torque reaches its maximum value. The aligning moment increases with the increase of the vertical load.

Figure 2.13 The tyre aligning torque characteristics of a car. (a) The relationship of aligning moment and sideslip angle. (b) The relationship of aligning moment and vertical load. (c) The relationship between aligning moment and camber angle.
2.5 Mechanical Properties of Tyres in Combined Conditions
Tyre models describe the mathematical relationship between the tyre’s 6-component forces (output) and the wheel parameters (input). When a car is moving, the outputs of the tyre model, such as the longitudinal force, lateral force, vertical force, rolling moment, rolling resistance moment, and aligning moment are determined by the longitudinal slip ratio of the wheel, side slip angle, radial deformation, camber angle, wheel speed, and yaw angle. Because the relationships between the inputs and outputs of the tyre models are strongly nonlinear, and the vertical tyre force, lateral force, and longitudinal force affect each other, the 6-component forces are coupled. In the case of vehicle acceleration, or braking when cornering on an uneven road, all thetyre characteristics described above must be taken into consideration simultaneously.
If the vertical force is constant, whenever the slip ratio is small, the longitudinal force is a linear function of the longitudinal slip ratio. But when the longitudinal slip ratio reaches a certain value, with the increase of the longitudinal slip ratio, the tyre longitudinal force decreases slightly. However, when the longitudinal slip ratio remains unchanged, the tyre longitudinal force increases linearly with the increase of the vertical force.
If the vertical force is fixed, whenever the slip angle is small, the lateral force is approximately linear with the tyre slip angle. The lateral force reaches a maximum value at a certain tyre slip angle. Then, with the increase of tyre slip angle, the lateral force remains almost unchanged. At this point, the tyre lateral force reaches saturation. When the tyre slip angle remains constant, the tyre lateral force increases approximately linearly with the increase of the vertical force. But when the vertical force becomes larger, the lateral force shows a strongly nonlinear relationship with the increase of the vertical force.
When the sideslip angle and the vertical force are fixed, the tyre longitudinal force and the lateral force interact with each other. The tyre longitudinal force increases with the increase of the longitudinal slip ratio at the beginning. When the slip ratio reaches a certain value, the longitudinal force decreases gradually and tends to be stable. However, the tyre lateral force gradually decreases with the increase of the longitudinal slip ratio. When the longitudinal slip ratio approaches 100%, the tyre lateral force is almost zero.
The interaction between the lateral force and the longitudinal force can also be interpreted by
the “friction ellipse”. Studies have shown that the resultant force in the tyre–road contact print is constant. The tyre resultant force is usually indicated by a family of curves, as shown in Figure 2.14. The figure shows relationship curves of the tyre lateral force and the longitudinal force with some given series of slip ratio or side slip angle. The envelope line of these curves is similar to an ellipse, which is why it is called “friction ellipse” or “adhesion ellipse”. Figure 2.14 also shows that the tyre cannot obtain the maximum tyre lateral force and the maximum longitudinal force simultaneously as a result of the limitation of the maximum friction. No lateral force is available when the tyre driving force or the braking force is at its maximum, the lateral force achieves its maximum value only when the longitudinal force is zero.

Figure 2.14 Distribution of the tyre longitudinal force and lateral force with combined conditions (friction ellipse).
References
- [1] Guo K H, Ren L. A Unified Semi-empirical Tyre Model with Higher Accuracy and Less Parameters. SAE Technical Paper Series, 1999-01-0785.
- [2] Pacejka H B. Tyre and Vehicle Dynamics. Butterworth-Heinemann, London, 2002.
- [3] Wallentowitz H. Longitudinal Dynamics of Vehicles. Insitut Fur Kraftfahrwesen, Aachen, 1997.
- [4] Clark S K. Mechanics of Pneumatic Tyres. DOT HS 805 952. U.S. Dept of Transportation, NHTSA, Washington DC, 20590, 1981.
- [5] Overton J A, Mills B, Ashley C. The vertical response characteristics of the non-rolling tyre. Proceedings of IMechE, 1969, 184(2):25–40.
- [6] Fancher P S, etc. A Fact Book of the Mechanical Properties of the Components for Single Unit and Articulated Heavy Trucks. Report No. HS 807 125, National Highway Traffic Safety Administration, U.S. Department of Transportation, 1986.
- [7] Crolla D, Yu F. Vehicle Dynamics and Control. People's Communications Press, Beijing, 2004.