
Chapter 5: External Control of Nematicon Paths
Nonlinear Optics and OptoElectronics Lab, University ROMA TRE, Rome, Italy
5.1 Introduction
The excitation of spatial solitons in nematic liquid crystals (NLC) relies on dipolar interactions between the elongated organic molecules and the electric field associated to propagating light beams [1, 2]. The NLC reorientational response to low and/or high frequency fields, together with other light-NLC interactions—for instance dye-mediated responses [3, 4]—can also be employed to spatially modulate the distribution of the molecular director. This makes NLC cells one of the most versatile environments to generate largely tunable refractive index profiles. In this chapter, we describe how nematicons propagate within inhomogeneous refractive index distributions and illustrate a few methods to modify their trajectories with the use of external fields.
Whatever is the nature of the director distortion, for example optical or electrical [5], a number of considerations hold valid in all cases. First of all, the NLC dielectric anisotropy affects the interaction, in both quantitative and qualitative ways, with respect to isotropic media: as beam energy travels in general forming a nonzero angle (called walk-off) with respect to the wave-vector [6], a beam can be steered by spatial changes in optic axis, even without altering the phase fronts. Thus, the beam trajectory can depend on walk-off variations, other than index gradient. Moreover, nonlocality affects the width and shape of the induced index gradient. In fact, strong anchoring at the sample boundaries set the distribution of elastic energy that can be stored in the nematic slab [7]: it can be demonstrated that, due to intermolecular forces, director variations cannot extend by less than the minimum cell dimension [8]. Even if restrictions are imposed on the system tunability, for typical cell sizes (50–100 μm), the Mauguin limit [7, 9] is fulfilled all over the sample [10] thanks to the nonlocality, ensuring the reciprocal independence of ordinary and extraordinary components [11], and enhancing the robustness of reorientational solitons (excited only by the extraordinary wave) when interacting with regions defined by a high index contrast. Moreover, the nonlocal response allows the use of the approximation of geometric optics to soliton propagation: provided that the beam width is much smaller than the perturbation width, ray optics can be successfully employed to calculate the nematicon trajectory in an arbitrary index distribution. As pointed out by Mitchell et al. [12], in highly nonlocal media a self-induced refractive index well can be approximated by a parabolic profile; the latter permits to elucidate light self-trapping by the well-known physics of the harmonic quantum oscillator.
This chapter is organized as follows: Section 5.2 is devoted to the basic equations describing a nematicon moving in an arbitrary potential: the director distribution is derived from the usual reorientation equation, taking into account both electric and optical contributions; then a NonLinear Schrödinger Equation (NLSE) comprehensive of all characteristic parameters is derived. A particle-like model is also introduced, with the Ehrenfest theorem used to express the soliton position as a function of an equivalent force governing the trajectory. Afterward, in Section 5.3, we describe a few experimental observations on nematicon control: external beam(s) is (are) shown to be able to deviate the soliton through changes in material properties, for example optical reorientation due to direct dipolar interactions or light-induced modifications of a guest–host system, defining pins or interfaces. In Section 5.4, we illustrate various configurations of electrodes able to modify the director distribution (the director control via magnetic fields is formally equivalent to the latter case) in 2D or 3D geometries: electrically driven reorientation is analyzed with uniform or patterned electrodes, varying the soliton path through changes in linear walk-off. Finally, in Section 5.5, we summarize the effects of electrically defined interfaces.
Other than summarizing the main aspects of nematicon interactions with linear potentials, this chapter collects a few strategies for light manipulation: keeping in mind the self-induced waveguide character of spatial solitons, the control of their propagation indicates various possibilities for nematicon-based signal routers and processors.
5.2 Basic Equations
In this chapter, we refer to a planar cell of thickness L (along x, in a Cartesian system) and infinitely extended along the other dimensions. Naming θ the angle between the molecular director and the z axis, the anchoring conditions set the director to lie in the yz plane, with a uniform distribution θ = θ0 throughout the sample. An external control (either optical or electrical) can modify its distribution at rest, altering the refractive index environment where solitons can propagate. From the Euler–Lagrange equations, we can cast the conservation of angular momentum into a reorientation equation, which describes the NLC elastic response to electrical as well as optical excitations [5]:
where K is the scalar Frank's elastic constant [7] representing the intermolecular restoring forces that balance the torques externally induced by optical and/or electric control fields A and E, respectively. As the anchoring imposes boundary conditions at the cell interfaces ![]() , for arbitrary distributions of the external fields (and thus director), it is θ = θ(x, y, z).
, for arbitrary distributions of the external fields (and thus director), it is θ = θ(x, y, z).
Let us now consider a wave packet propagating in a director background, with its wave-vector distribution centered in ![]() . It is convenient to deal with the magnetic field associated to the extraordinary (e-) polarized wave, namely
. It is convenient to deal with the magnetic field associated to the extraordinary (e-) polarized wave, namely ![]() [13]; from the expression of the dielectric tensor
[13]; from the expression of the dielectric tensor ![]() , it follows that the electric field components are Ex = 0 and
, it follows that the electric field components are Ex = 0 and ![]() . Therefore, beam propagation is described by
. Therefore, beam propagation is described by
where ω = k0(μ0ϵ0)−1/2 is the optical frequency and k0 is the vacuum wave-vector. When considering—as in the rest of this chapter—beams with ![]() , the extraordinary refractive index and the walk-off can be expressed as
, the extraordinary refractive index and the walk-off can be expressed as ![]() and
and ![]() , respectively. Even if the latter quantities are pointwise functions of the field intensity, in typical experimental conditions their profiles are much wider than the beam width owing to nonlocality [14, 15]. This allows one to assume both of them to be constant all over the beam profile, their values taken on the beam axis, namely
, respectively. Even if the latter quantities are pointwise functions of the field intensity, in typical experimental conditions their profiles are much wider than the beam width owing to nonlocality [14, 15]. This allows one to assume both of them to be constant all over the beam profile, their values taken on the beam axis, namely ![]() and δ(b). If the magnetic field has the form
and δ(b). If the magnetic field has the form ![]() , we can reduce Equations 5.2 and 5.3 to
, we can reduce Equations 5.2 and 5.3 to
where A is the field in the slowly varying envelope approximation (SVEA) and ![]() is the change in the extraordinary index. There are two contributions to
is the change in the extraordinary index. There are two contributions to ![]() : a linear portion that stems from the control field E and a nonlinear one that depends on the soliton field and responsible for self-confinement. Equation 5.4 is an NLSE that describes the evolution of an optical field in an anisotropic medium with an arbitrary index profile [
: a linear portion that stems from the control field E and a nonlinear one that depends on the soliton field and responsible for self-confinement. Equation 5.4 is an NLSE that describes the evolution of an optical field in an anisotropic medium with an arbitrary index profile [![]() ], the latter fixed by Equation 5.1, including linear/nonlinear changes in walk-off via tanδ(b). To calculate the soliton trajectory in the presence of a generic distribution of the dielectric tensor, we can consider the coordinate z as an equivalent time t and assume
], the latter fixed by Equation 5.1, including linear/nonlinear changes in walk-off via tanδ(b). To calculate the soliton trajectory in the presence of a generic distribution of the dielectric tensor, we can consider the coordinate z as an equivalent time t and assume ![]() . The latter render nematicon propagation formally equivalent to the motion of a charged particle in an electromagnetic potential. The corresponding Hamiltonian is Heq = (1/2m)[peq − (e/c)Aeq]2 + eUeq, where m is the particle mass, e is its charge, c is the speed of light in vacuum, peq is the equivalent momentum (given by the slope of the trajectory), and Aeq and Ueq are the effective vector and scalar potentials, respectively; the expression of the associated electric field is Eeq = − ∇TUeq + ∂Aeq/∂t (
. The latter render nematicon propagation formally equivalent to the motion of a charged particle in an electromagnetic potential. The corresponding Hamiltonian is Heq = (1/2m)[peq − (e/c)Aeq]2 + eUeq, where m is the particle mass, e is its charge, c is the speed of light in vacuum, peq is the equivalent momentum (given by the slope of the trajectory), and Aeq and Ueq are the effective vector and scalar potentials, respectively; the expression of the associated electric field is Eeq = − ∇TUeq + ∂Aeq/∂t (![]() ). In analogy to potential terms generating a force acting on charged particles, we can derive an equivalent transverse force that modifies the soliton trajectory:
). In analogy to potential terms generating a force acting on charged particles, we can derive an equivalent transverse force that modifies the soliton trajectory:
5.5 ![]()
where the first two terms represent the refractive index gradient (corresponding to the scalar potential Ueq) and the last term comes from the longitudinal variations in walk-off as perceived by the beam (owing to the equivalent vector potential Aeq). The position of the soliton “center of mass” ![]() can be found by applying the Ehrenfest theorem [16] to Equation 5.4
can be found by applying the Ehrenfest theorem [16] to Equation 5.4
5.6 ![]()
with the NLC highly nonlocal response accounted for on the right-hand side. Summarizing, Equation 5.4 models the propagation of a finite size light beam in an NLC cell accounting for anisotropy, walk-off, and nonlinear index changes. The beam trajectory can get modified by a nonhomogeneous index profile generated by external electrical and/or optical fields as described by Equation 5.1. Moreover, the high nonlocality allows adopting a particle-like model for soliton propagation, illustrating the trajectory of a self-confined beam within the ray-optics approximation; hence, once the linear index background is defined, we can predict the resulting path of a nematicon.
5.3 Nematicon Control with External Light Beams
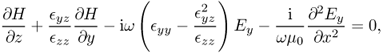
Let us address the effect of an inhomogeneous index profile produced by an external beam. The setup is sketched in Figure 5.1: a nematicon is excited by launching an extraordinary polarized beam with ![]() , with a control beam focused on the sample and normal to the nematicon wave-vector, in the yz plane. In this section, we discuss the role of control beams with various shapes on the nematicon path.
, with a control beam focused on the sample and normal to the nematicon wave-vector, in the yz plane. In this section, we discuss the role of control beams with various shapes on the nematicon path.
Figure 5.1 Typical setup used to optically induce a nonuniform index distribution.
5.3.1 Interaction with Circular Spots
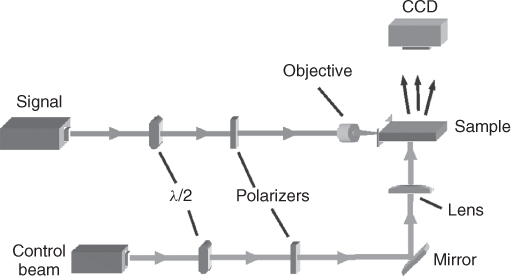
Figure 5.2a shows the calculated refractive index perturbation due to a circular beam of size comparable with the thickness L = 75 μm of the sample. We recall that, given the boundary conditions in x = 0 and x = L (planar anchoring), the director distribution depends also on x; however, when dealing with nematicons propagating in the middle of the cell, we can simply consider the (planar) contribution in x = L/2. A nematicon will be deflected by such an inhomogeneous potential: Figure 5.2b shows a self-confined near-infrared beam (1064 nm) probed by a weak signal of different wavelength (633 nm) in a standard planar cell with the commercial mixture E7. The external (near infrared, in this case) control beam is focused in the yz plane with a waist of 8 μm, at intensity high enough to produce optical reorientation and linear polarization chosen in order to lower the refractive index “sensed” by the nematicon: a repulsive potential well acts on the nematicon and deviates its trajectory, with paths as shown in Figure 5.2b [17].
Figure 5.2 (a) Absolute value of the index profile induced in the plane x = L/2 by a circular control beam propagating along ![]() and centered in (yc, zc), carrying a power of 32 mW and with a waist of 8 μm. (b) Effect of a circular defect (white circle): as the polarized control beam lowers the index, the soliton propagating with
and centered in (yc, zc), carrying a power of 32 mW and with a waist of 8 μm. (b) Effect of a circular defect (white circle): as the polarized control beam lowers the index, the soliton propagating with ![]() (top panel) is repelled away (center and bottom panels). The acquired photographs show a red probe signal guided by the near-infrared self-induced waveguide.
(top panel) is repelled away (center and bottom panels). The acquired photographs show a red probe signal guided by the near-infrared self-induced waveguide.
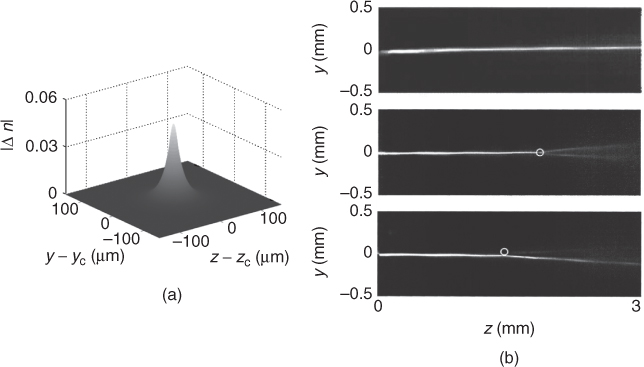
Figure 5.2b displays a few photographs of a red probe confined by the nematicon waveguide and illustrates the interaction of a nematicon with a circular index perturbation induced by a control spot focused to a waist of wc ≈ 8 μm (Figure 5.2a). If the latter is placed exactly along the soliton trajectory, the axisymmetric reduction in refractive index splits it into two identical lower power beams, thereby forming a Y-junction; both arms of the Y can remain self-localized or diffract after the interaction, depending on the initial power; the weak probe undergoes the same behavior. When the perturbation is shifted sideways in y, the system symmetry is broken and the soliton (as well as the probe) is “pushed” away in yz toward higher index regions.
The soliton deviation induced by the control beam is a function of both its position Δy with respect to the nematicon axis and its power Pc: considering the resulting soliton trajectories in a limited range of Pc (Fig. 5.3, with Pc ≤ 32 mW to avoid detrimental thermal effects), a linear dependence exists between Pc and the corresponding steering angle α.
Figure 5.3 Soliton deflection for various control beam powers. (a) Nematicon trajectories and (b) angular steering for a control spot placed in Δy = 9 μm with respect to the unperturbed nematicon path.
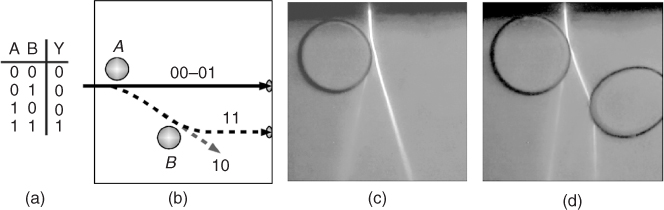
Besides the interaction, the control of soliton paths by way of external beams can be exploited toward simple all-optical logic functions. For instance, the control beam(s) can play the role of input variable(s) in a logic gate, associating a position in the plane yz to the logic output: switching from high to low output can be made to correspond to the displacement due to the control spot(s). Figure 5.4 shows the implementation of an AND gate: in this example, the two perturbing pins are generated via molecular photoisomerization of an azo-NLC [18, 19].
Figure 5.4 Nematicon-based AND logic gate. (a) Truth table. (b) Principle of operation: the position corresponding to a “true” output is reached just in the presence of both control spots (i.e., logic “11”). (c and d) Photographs corresponding to the logic inputs (c) “10” and (d) “11”, respectively.
5.3.2 Dielectric Interfaces
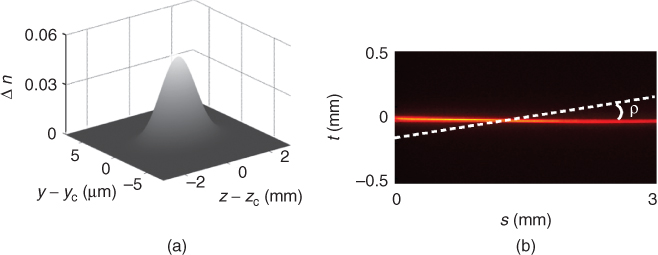
Changing the shape of the perturbation, it is possible to access different regimes of interaction with nematicons; using an elongated control beam, a double-graded interface can be defined. A typical index distribution obtained in the middle of the cell is shown in Figure 5.5a for an attracting potential well.
Figure 5.5 (a) Pictorial sketch of the index profile Δn generated by an elliptical control beam with long axis parallel to axis z. (b) Unperturbed soliton propagation. The dashed line indicates the long axis of the control spot, at an angle ρ with respect to the nematicon Poynting vector.
In the experiments, we used a commercial NLC mixture 5CB doped with a small amount of Methyl Red dye (0.1% in weight) in a planar cell where only one of the glass–NLC interfaces was rubbed to provide anchoring, whereas the other one was left untreated. The exposure of this particular dye to visible light is known to modify its interaction energy with the surfaces: the consequent molecular adsorption/desorption [20] mediates a rearrangement of the NLC director around the dye molecules next to the boundaries. Owing to the dye dichroism in this guest–host system, the rearrangement is polarization dependent and determines a preferred NLC orientation, affected by intensity, exposure time, and impinging wavelength [21]. Although the rigorous physical explanation goes beyond our scope, we can simply state that, illuminating the untreated surface, the control beam actually sets new anchoring conditions, thus affecting the director orientation in the whole thickness of the sample via intermolecular forces [22]. In the actual experimental conditions [using a cw (continuous wave) laser at λ = 532 nm and moderate intensities], the dye-mediated field–NLC interaction tends to reorient the molecular director perpendicularly to the polarization of the control field.
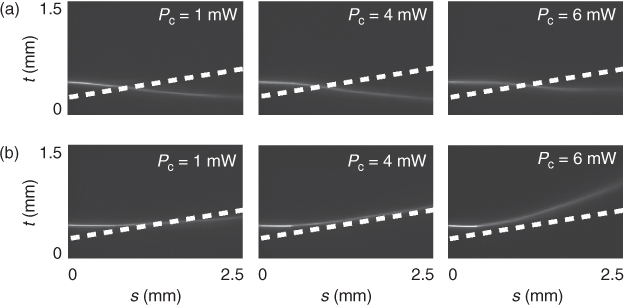
Figure 5.6 elucidates the effects of an elliptical beam with 5 μm and 3 mm long axes, impinging in the plane yz with its major axis at an angle ρ ≈ 9° with respect to the nematicon Poynting vector [3] (see Figure 5.5b): when the control beam is polarized perpendicular to the soliton wave-vector, the index gradient is positive and the soliton undergoes double refraction as it crosses the two graded interfaces (Fig. 5.6a); the beam displacement is a nontrivial function of the control power Pc, the particular dye-NLC guest–host, the beam ellipticity, and the NLC anisotropy. For control light polarization along z, the index gradient is negative: at low Pc and moderate changes in director orientation, the nematicon goes through the double interface, whereas at higher Pc it undergoes total internal reflection (TIR) and is repelled by the interface (Fig. 5.6b). From refraction and reflection we estimated a maximum refractive index variation Δn ≈ 0.05.
Figure 5.6 Optically induced double interface: (a) double refraction and (b) total internal reflection of a nematicon. The dashed lines indicate the long axis of the elliptical control beam.
5.3.3 Comments
Although we illustrated three examples of all-optical control on nematicons, from pure optical reorientation to dye-enhanced field–NLC interactions, the trajectory of nematicons depends only on the resulting modulation of the director background, consistent with the behavior expected from the model discussed in Section 5.2. All the experimental observations confirm that self-confinement is preserved after propagation through a region with nonconstant refractive index: the soliton robustness to such collisions and the great NLC versatility to control the director distribution suggest the feasibility of all-optical signal readdressing based on self-trapped waves in highly nonlocal media.
5.4 Voltage Control of Nematicon Walk-Off
Another means to induce changes in optic axis rely on external electric fields: to this extent Indium Tin Oxide (ITO)-transparent electrodes are often deposited on the inner glass–NLC interfaces of planar cells to apply a bias. Typical rms voltages are of a few volts, and the slow elastic response of NLC allows to employ frequencies down to 100 Hz (the upper limit depends on the equivalent capacitance). The high NLC birefringence corresponds to large walk-off angles, making soliton steering feasible with very large displacements; at the same time, electrode patterning permits to engineer the induced perturbation of director distribution, that is, refractive index for extraordinarily polarized light waves. Here, we describe various electrically defined potentials and their interaction with nematicons.
5.4.1 Out-of-Plane Steering of Nematicons
The simplest electrode geometry is one with a uniform thin film of conductor (ITO) deposited on both upper and lower glass–NLC interfaces. To maximize the steering, the surfaces are mechanically rubbed to enforce a planar alignment of the molecular director with θ0 = 45° with respect to the z axis [2]. As visible in Figure 5.7, the extraordinary polarization of an input beam launched with ![]() is parallel to y and the corresponding walk-off is δ ≈ 7° for the NLC mixture E7 at wavelength λ = 1064 nm (Δn ≈ 0.2). As expected, whereas the ordinary component is subject to the Freedericksz threshold [7] and propagates linearly at milliWatt powers, a nematicon can be excited by the extraordinary beam once sufficient power is injected.
is parallel to y and the corresponding walk-off is δ ≈ 7° for the NLC mixture E7 at wavelength λ = 1064 nm (Δn ≈ 0.2). As expected, whereas the ordinary component is subject to the Freedericksz threshold [7] and propagates linearly at milliWatt powers, a nematicon can be excited by the extraordinary beam once sufficient power is injected.
Figure 5.7 (a) Sketch of the sample. (b) Propagation of a mixed polarization beam in the absence of bias. At low power (top panel) both ordinary and extraordinary waves diffract, with corresponding Poynting vectors at an angle, owing to walk-off. At high power (bottom panel) the extraordinary wave is self-confined and the nematicon propagates at the linear walk-off angle with respect to z. (c) Bias induced electric potential inside the cell. The arrow indicates increasing voltages.
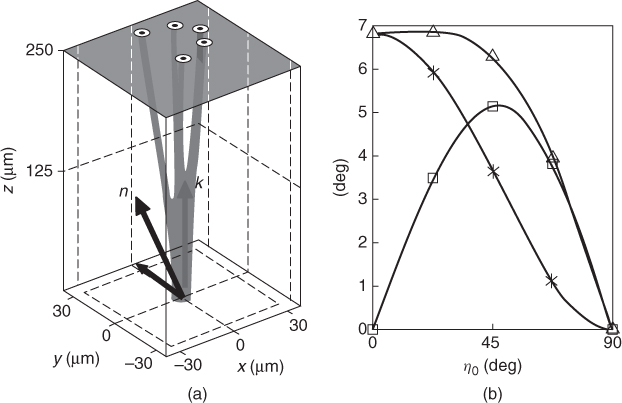
The application of a bias reorientates the molecular director toward the x axis in the whole cell: the elevation η0 = η0(x) becomes a function of the applied voltage (Fig. 5.7), defining a new optic axis for each V. Consequently, the principal plane for the extraordinary eigenwave varies with voltage following the elevation angle. As the Poynting vector always lies in the plane defined by wave-vector and optic axis, it will be modified by the electric field as well, with the effect of precessing the nematicon path. As Figure 5.8 shows, when V = 0V, the walk-off is defined by the geometry, namely δ ≈ 7°; after a nearly flat trend versus η0, the walk-off gradually reduces for increasing η0 (in turn a function of V) and eventually approaches 0° for V ≈ 3V, corresponding to the director being parallel to the x axis (η0 ≈ 90°). Owing to the initial θ0, the corresponding nematicon “center of mass” moves in the xyz describing a semicone (Fig. 5.8a).
Figure 5.8 (a) Sketch of nematicon evolution versus applied voltage. Out-of-plane reorientation causes the trajectory to precess in a half cone. (b) Calculated walk-off (triangles) and its projection on xz (squares) and yz (asterisks); the latter is the apparent walk-off observable in experiments.
A direct comparison of the model with the top-view experimental observation is not possible, as the latter can only give information on the projection of the nematicon path on the yz plane. Naming ϕ the (voltage-dependent) angle formed by the extraordinary principal plane with axis y (corresponding to the angle between projection of η0 on xy and axis y) and using geometric considerations, it is straightforward to find the apparent walk-off ![]() , that is, the walk-off observable in the yz plane.
, that is, the walk-off observable in the yz plane.
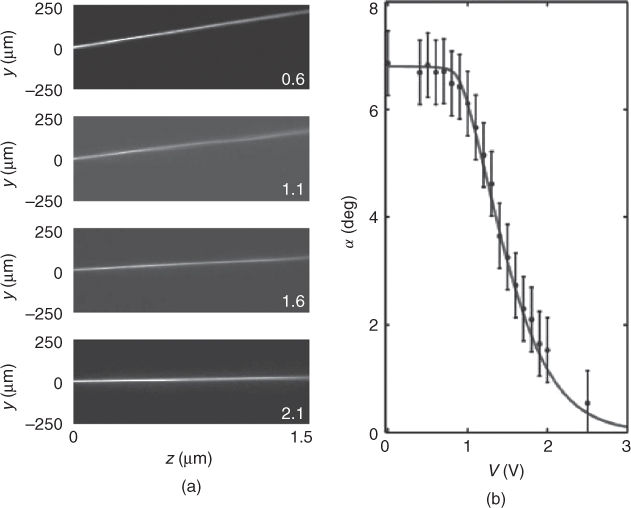
Figure 5.9a shows the experimental results for an extraordinarily polarized beam of waist 5 μm and power 5 mW; the measured apparent walk-off versus bias, interpolated with the previously calculated expression, demonstrates voltage-controlled soliton steering over the whole available angular interval: above the Freedericksz threshold (V ≈ 1 V), the apparent walk-off monotonically decreases (see Figure 5.9b) until reorientation starts to saturate at high voltages (V ≈ 2.7 V) and the nonlinearity becomes less effective, letting the light beam propagate without walk-off in a quasi-linear diffractive manner.
Figure 5.9 (a) Photographs of voltage-controlled soliton steering for λ = 1064 nm. (b) Experimental (points) and theoretical curve of the apparent walk-off versus applied voltage.
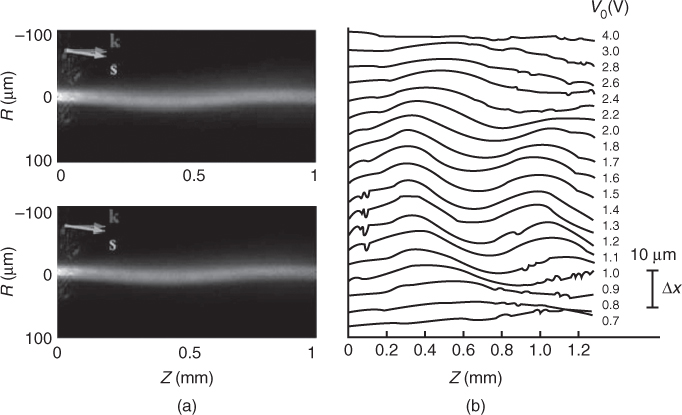
The nonplanar evolution of a nematicon is also determined by the confinement across x by way of the boundaries and the applied bias: as the soliton moves toward the upper (lower) interface x = L (x = 0) owing to walk-off in xz, the refractive gradient introduced by V attracts the self-confined beam to the mid-plane x = L/2 where the index increase is maximum. Eventually, the self-trapped beam bounces across the cell as it propagates along z, with a periodic behavior depending on the elevation angle. The observation of the transverse dynamics of nematicons can be carried out by tilting the image-plane of the microscope objective by 45° (Fig. 5.10), revealing the voltage-tunable oscillations in nematicon trajectories [23].
Figure 5.10 (a) Photographs of nematicon propagation in an observation plane rotated about 45° with respect to x, for two applied voltages. (b) Voltage-dependent nematicon trajectories.
5.4.2 In-Plane Steering of Nematicon
The geometry above emphasizes the role of walk-off and the possibility of skew trajectories: interactions of solitons with boundaries [24, 25] and the intrinsic 3D nature of this steering are hardly compatible with a planar technology. Alternative electrode geometries can overcome this problem and result in in-plane nematicon steering [26].
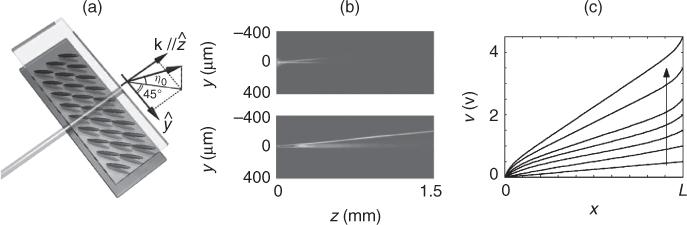
Let us consider the sample sketched in Figure 5.11a–c: in a standard planar NLC cell, ITO electrodes are patterned on each interface (top and bottom) with a double interdigitated comb layout, each comb of period 2Λ and electrically connected to the same external bias, the teeth separated by Λ along z. By applying a low frequency voltage V between the electrodes, an alternating electric field ELF is generated with period 2Λ: we can assume ELF = 0 in the NLC under (above) the electrodes and ![]() between them (l being the tooth width), with an exponential decay e−κx along the cell thickness, the coefficient κ modeling the coupling between the quasi-static field and the NLC molecules [27]. For Λ
between them (l being the tooth width), with an exponential decay e−κx along the cell thickness, the coefficient κ modeling the coupling between the quasi-static field and the NLC molecules [27]. For Λ ![]() L and moderate voltages, the x-component of the field is averaged out by the nonlocal response and the dominant component is along z; hence, molecular reorientation essentially occurs in the yz plane. To model this geometry, we impose periodic boundary conditions to Equation 5.1, considering
L and moderate voltages, the x-component of the field is averaged out by the nonlocal response and the dominant component is along z; hence, molecular reorientation essentially occurs in the yz plane. To model this geometry, we impose periodic boundary conditions to Equation 5.1, considering ![]() and
and
5.7 ![]()
for |x| < L/2, with rectd(z) equal to 1 for ![]() , 0.5 in z = ± d/2 and 0 elsewhere. Numerical simulations of E7 director distribution in 0 < z < Λ for L = 100 μm, Λ = 30 μm, and l = Λ/2 confirm that disturbance in the director distribution do not penetrate appreciably the NLC slab: the applied electric field reorients the molecules near the electrodes, whereas the optic axis rotation around the mid-plane (x = L/2) is ensured by the elastic response. As a consequence, the distribution of θ is flat in x = L/2 and depends on the voltage [θ(L/2, y, z) = θ0(V), see Fig. 5.11d]; in other words, the comb-patterned electrodes tune the uniform director distribution and the walk-off in the plane yz of the cell. When an extraordinarily (y)-polarized beam is launched in the sample, its propagation takes place in the principal plane yz, and the soliton trajectory is affected by variations in walk-off rather than in apparent walk-off as in the previous configuration.
, 0.5 in z = ± d/2 and 0 elsewhere. Numerical simulations of E7 director distribution in 0 < z < Λ for L = 100 μm, Λ = 30 μm, and l = Λ/2 confirm that disturbance in the director distribution do not penetrate appreciably the NLC slab: the applied electric field reorients the molecules near the electrodes, whereas the optic axis rotation around the mid-plane (x = L/2) is ensured by the elastic response. As a consequence, the distribution of θ is flat in x = L/2 and depends on the voltage [θ(L/2, y, z) = θ0(V), see Fig. 5.11d]; in other words, the comb-patterned electrodes tune the uniform director distribution and the walk-off in the plane yz of the cell. When an extraordinarily (y)-polarized beam is launched in the sample, its propagation takes place in the principal plane yz, and the soliton trajectory is affected by variations in walk-off rather than in apparent walk-off as in the previous configuration.
Figure 5.11 Details on the sample for in-plane soliton steering. (a) Top-view of the cell with indication of the initial director distribution. (b) Top and (c) side sketch of the electrode pattern: the arrows indicate the electric field lines. (d) Calculated director profile in the cell with interdigitated electrodes, for various applied voltages. In the middle of the cell the director distribution is flat.
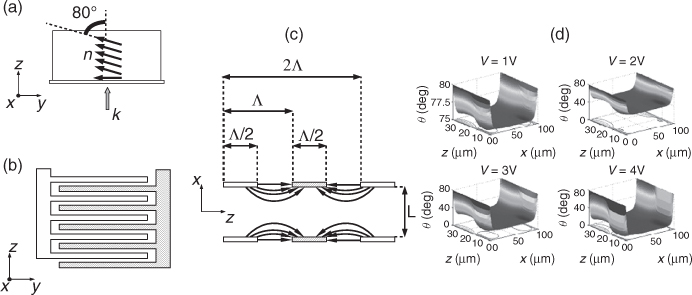
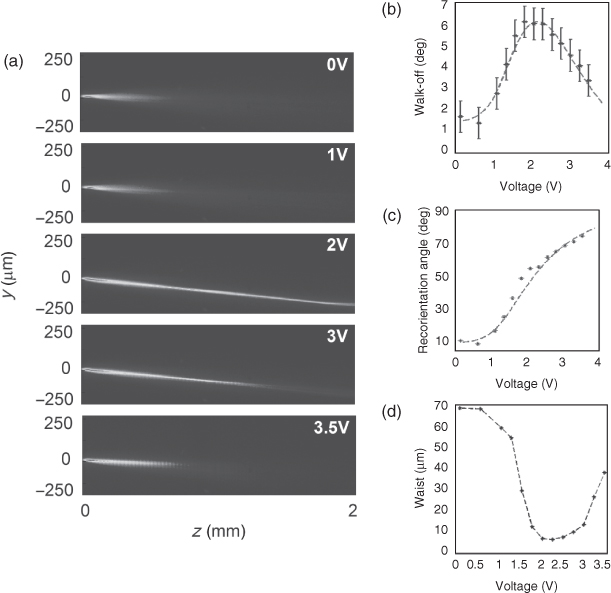
Figure 5.12a shows photographs of a near-infrared beam of power P = 2 mW launched along z in a cell with interdigitated electrodes and θ0 = 80° at rest: for V = 0 V the Poynting vector of the extraordinary beam propagates at the walk-off δ(80°) ≈ 2° with respect to z. Increasing the voltage, the nematicon trajectory is steered to higher angles up to δM ≈ 6.2° for V = 1.75 V (rms value), the maximum walk-off corresponding to θ0 ≈ 50°. Considering molecular reorientation in the principal plane x = L/2 due to an effective electric field along z, the equivalent θ0vsV reorientation equation is
5.8 ![]()
where, ![]() , with α being a fitting parameter depending on the electrode periodicity but not on the cell thickness. Figure 5.12b and c demonstrates the excellent agreement between calculated and measured walk-off and reorientation angle for α ≈ 0.62.
, with α being a fitting parameter depending on the electrode periodicity but not on the cell thickness. Figure 5.12b and c demonstrates the excellent agreement between calculated and measured walk-off and reorientation angle for α ≈ 0.62.
Figure 5.12 In-plane nematicon steering. (a) Photographs of a near-infrared (λ = 1064 nm) extraordinary beam for various cell biases. (b) Measured (dots) and calculated (dashed line) walk-off and (c) reorientation angle versus applied voltage. (d) Beam waist versus bias after propagation over 10 Rayleigh lengths. The θ dependence of the nonlinear response limits the range of voltages over which a nematicon is generated.
Noticeably, self-confinement occurs only in a limited range of voltages, because the reorientational response in Equation 5.4 depends on θ0 (see Chapter 11): in this kind of cell, the nonlinearity is therefore tuned by bias, thus changing the amount of self-focusing for a given power [27, 28]. Figure 5.12d plots the beam waist after 10 Rayleigh lengths versus applied bias: nematicons are generated only when the voltage-tuned nonlinearity can compensate linear diffraction. Thus, besides being an ideal setting for in-plane beam steering, the geometry described can be used to adjust the core index of the nematicon-induced waveguide, allowing, for example, the nonlinear control (via soliton power) of the number of supported guided modes of a copolarized probe.
5.5 Voltage-Defined Interfaces
The previous examples of electrically driven nematicon steering were based on controlled changes of the optic axis—and thus walk-off—in a uniform birefringent medium. By properly patterning the electrodes, however, regions with different refractive indices can be realized into the same cell: this section deals with voltage-defined dielectric interfaces in NLC [29].
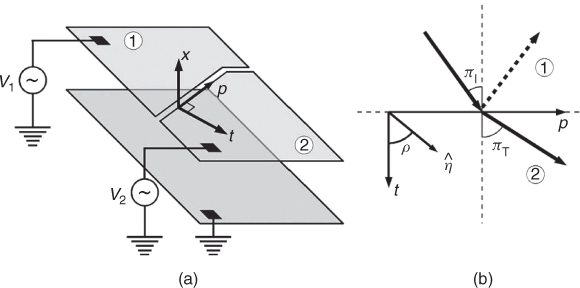
We consider a planar cell with a pattern of electrodes as sketched in Figure 5.13a, 100 μm thick and filled with E7. The top electrode is split into two regions across a 100 μm wide gap, each region biased at a different voltage with respect to the uniform bottom electrode operating as ground terminal. The direction p along the gap forms an angle Θ with respect to z and the initial director distribution is uniform, with the optic axis at an angle ρ with the normal t to p (Figure 5.13b).
Figure 5.13 (a) Sketch of the sample with two top electrodes. (b) Geometry of the sample in the reference system of the interface.
The application of in-phase voltages V1 and V2 to the two top electrodes induces distinct reorientations in the NLC under them, defining a graded interface in the region underneath the gap. The resulting director distribution can be calculated using a modified version of Equation 5.1, taking into account the elevation angle η(V) and suitable boundary conditions.
An extraordinary wave interacting with this bias-controlled interface will perceive an index gradient, which is a function of ΔV = V1 − V2. By launching an extraordinarily polarized beam of sufficient power across the interface (from first to second region), the trajectory of the resulting nematicon can be affected by the difference between the two corresponding extraordinary refractive indices ne1 and ne2.
We stress that the two top electrodes allow to independently control the reorientation in each NLC region, i.e. the two indices, the nonlinearities, the walk-off angles, and the refractive gradient across the interface.
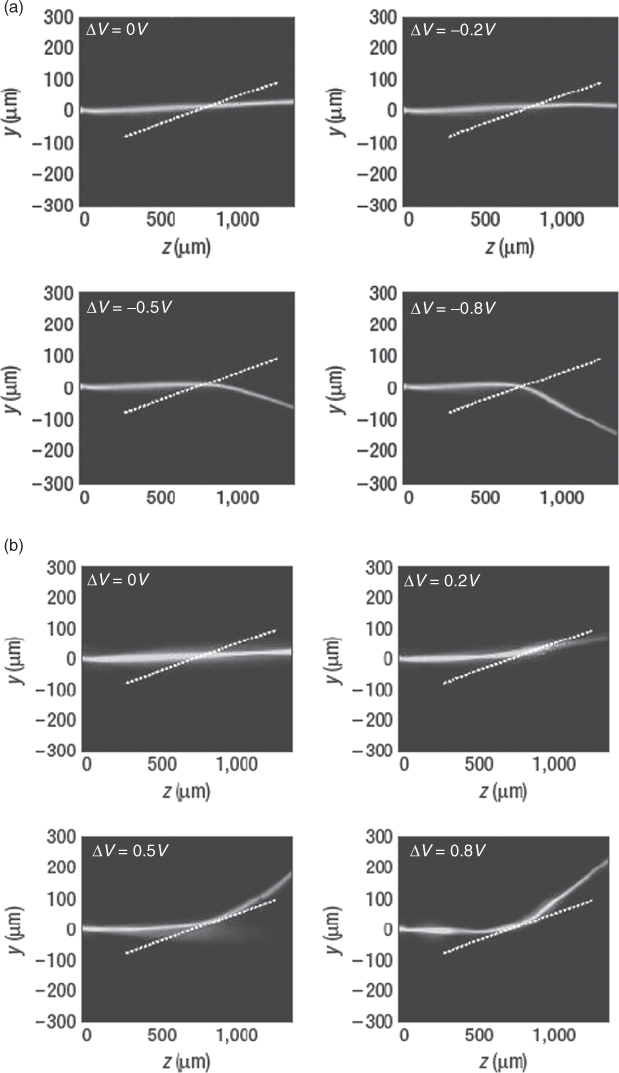
The ray-optics approximation is valid in this regime of propagation: the phenomenology is analogous to that of a plane wave impinging on an interface, thus Snell's law can be applied with corrections for anisotropy. With the letter Ψ we will indicate the angle measured on the plane yz, the quantities actually measured in experiments. For negative ΔV the refractive index in the first region is lower than that in the second one, and the angle of refraction ΦT (with respect to t) is smaller than the angle of incidence ΦI; conversely, when V1 > V2, it is ΦT > ΦI until TIR can take place (for suitable ΦI and ΔV). To maximize soliton steering, the initial director is set parallel to p (ρ = 90°). In this case and with reference to Figure 5.14 nematicon impinges on the interface with ΦI = 80°. For V2 = 0.7 V and − 0.8 V < ΔV < 0 V (refraction, Fig. 5.14a), it undergoes a maximum angular deviation of 18°; conversely, for positive ΔV (0V < ΔV < 0.8V) the nematicon is reflected at the interface (Fig. 5.14b) with a resulting steering of 22°. In this sample, the overall electrically driven nematicon deviation reaches 40°, the largest electro-optical soliton steering ever reported.
Remarkably, as visible in the photographs, the adiabatic rotation of the director in the graded region allows for polarization adjustment of the extraordinary beam and conservation of self-confinement; as predicted by the particle-like model for solitons in nonlocal media (see Section 5.2), the nematicon survives the interaction with the interface even for large ΔV, when its transverse dynamics across x becomes appreciable due to variations in walk-off [11, 23].
Figure 5.14 Nematicon interaction with a voltage-defined interface, for an incidence angle Φ = 80°. (a) For ΔV < 0 V the nematicon undergoes refraction; (b) for ΔV > 0 V and a suitable Δn TIR occurs.
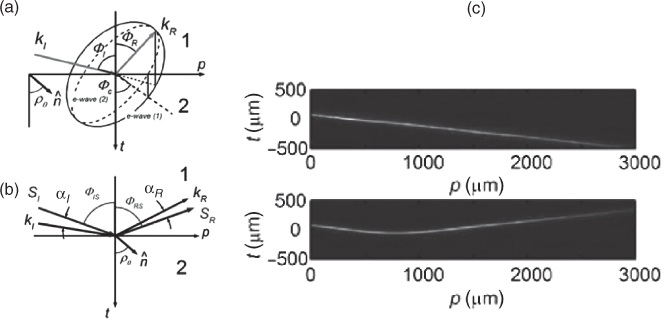
Because soliton steering is measured by the angular deviation of the corresponding Poynting vector (subscript S), the angles ΦI, ΦT, and ΦR are found by considering the measured apparent walk-off (see Section 5.4.1) αI, αT, αR, respectively. In the case of TIR, the above choice of ρ ensures that, considering the three dimensional nature of the reflection, the angles of the Poynting vectors of incident and reflected beams are always larger than those of the corresponding wave-vectors; moreover ΦT = ΦI due to the symmetry and, therefore, the reflection is specular with regards to wave-vectors.
Conversely, a different ρ may cause nonspecular TIR owing to anisotropy [30]. The conservation of soliton wave-vectors can be visualized by employing the inverse surface wave normals (Fig. 5.15a) [6]. Conservation of wave-vector components along p requires a reflection angle larger than the incident one if the refractive index perceived by the impinging wave is larger than sensed by the reflected one (difference arising from the anisotropic nature of the medium); clearly, a necessary condition is ΔV positive and large enough to ensure TIR [30]. To illustrate this, we take ρ = 50° and light impinging at an angle ΦI ≈ 80°. In these conditions, the geometric construction leads to ΦI = ΦIS + αI and ΦR = ΦRS − αR (Fig. 5.15b). If we consider V1 = 1.5V and V2 = 0V, TIR is ensured; then, we can calculate αI = 2.1° and αR = 2.4°, quantities required to link the Poynting vector directions with the corresponding wave-vectors. Experimentally, ΦIS = 79° and ΦRS = 79.5° are measured (Fig. 5.15c). The observable (in plane yz) nonspecularity of the Poynting vectors upon TIR is very slight owing to the opposite sign of the apparent walk-off [30]. In fact, from the measurements, we can estimate for the wave-vector ΦI = 81.1° and ΦR = 76.6°, with a significant nonspecularity ΔΦ = 4.5°, in quite good agreement with theoretical predictions [30].
Figure 5.15 (a) Projection of the inverse surface of wave normals on the plane tp, for an extraordinary wave crossing the interface. Solid and dashed ellipses represent the indices in the first and second regions, respectively, the latter defining the critical angle ΦC. If ΦI < ΦC, ΦR ≠ ΦI owing to anisotropy. (b) Geometric construction of the reflected wave and Poynting vectors. (c) Images of a soliton crossing the interface for V1 = V2 (top) and its TIR for V1 = 1.5 and V2 = 0 (bottom).
5.6 Conclusions
Spatial solitons in NLC are robust and lend themselves to realizing a variety of routing schemes via their interactions with voltage or light defined dielectric perturbations. In this chapter, we reviewed a few selected examples of nematicon steering and processing using localized NLC defects as well as graded interfaces, in a variety of configurations, including uniform and patterned electrodes, external beams, and combinations of voltage and light. Although other noticeable examples of nematicon steering have been reported in the literature, including the use of air bubbles [31], the escape from a trapping potential [32, 33], nematicon–nematicon interactions [34–37], the use of light valves [11, 38, 39] and more [4, 40], a number of novel possibilities are still available using solitons in NLC and are likely to be exploited in the near future.
Acknowledgments
We are particularly grateful to Marco Peccianti, Malgosia Kaczmarek, Cesare Umeton, Francesco Simoni, and Claudio Conti for their essential contributions to the work reported hereby. A.A. thanks Regione Lazio for financial support.
1. M. Peccianti, A. De Rossi, G. Assanto, A. De Luca, C. Umeton, and I. C. Khoo. Electrically assisted self-confinement and waveguiding in planar nematic liquid crystal cells. Appl. Phys. Lett., 77(1):7–9, 2000.
2. M. Peccianti, C. Conti, G. Assanto, A. De Luca, and C. Umeton. Routing of anisotropic spatial solitons and modulational instability in nematic liquid crystals. Nature, 432:733, 2004.
3. A. Piccardi, G. Assanto, L. Lucchetti, and F. Simoni. All-optical steering of soliton waveguides in dye-doped liquid crystals. Appl. Phys. Lett., 93:171104, 2008.
4. A. Piccardi, A. Alberucci, and G. Assanto. Self-turning self-confined light beams in guest-host media. Phys. Rev. Lett., 104:213904, 2010.
5. I. C. Khoo. Liquid Crystals: Physical Properties and Nonlinear Optical Phenomena. Wiley Interscience, New York, 1995.
6. M. Born and E. Wolf. Principles of Optics. Pergamon Press, New York, 1975.
7. P. G. De Gennes and J. Prost. The Physics of Liquid Crystals. Oxford Science, New York, 1993.
8. A. Alberucci and G. Assanto. Propagation of optical spatial solitons in finite-size media: interplay between nonlocality and boundary conditions. J. Opt. Soc. Am. B, 24(9):2314–2320, 2007.
9. Ch. Mauguin. Sur les cristaux liquid de Lehmann. Bull. Soc. Fr. Miner., 34:71–117, 1911.
10. A. Alberucci, M. Peccianti, G. Assanto, G. Coschignano, A. De Luca, and C. Umeton. Self-healing generation of spatial solitons in liquid crystals. Opt. Lett., 30:1381–1383, 2005.
11. A. Alberucci, A. Piccardi, U. Bortolozzo, S. Residori, and G. Assanto. Nematicon all-optical control in liquid crystal light valves. Opt. Lett., 35(3):390–392, 2010.
12. A. W. Snyder and D. J. Snyder. Accessible solitons. Science, 276:1538–1541, 1997.
13. A. Alberucci and G. Assanto. Nematicons beyond the perturbative regime. Opt. Lett., 35(15):2520–2522, 2010.
14. C. Conti, M. Peccianti, and G. Assanto. Route to nonlocality and observation of accessible solitons. Phys. Rev. Lett., 91:073901, 2003.
15. C. Conti, M. Peccianti, and G. Assanto. Observation of optical spatial solitons in a highly nonlocal medium. Phys. Rev. Lett., 92:113902, 2004.
16. J. J. Sakurai. Modern Quantum Mechanics. Addison-Wesley, Reading, MA, 1994.
17. M. Peccianti A. Pasquazi, A. Alberucci and G. Assanto. Signal processing by opto-optical interactions between self-localized and free propagating beams in liquid crystals. Appl. Phys. Lett., 87:261104, 2005.
18. N. Tabiryan, U. Hrozhyk, and S. Serak. Nonlinear refraction in photoinduced isotropic state of liquid crystalline azobenzenes. Phys. Rev. Lett., 93:113901, 2004.
19. S. V. Serak, N. V. Tabiryan, M. Peccianti, and G. Assanto. Spatial soliton all-optical logic gates. IEEE Photon. Technol. Lett., 18:1287, 2006.
20. E. Ouskova, Y. Reznikov, S. V. Shiyanovskii, L. Su, J. L. West, O. V. Kuksenok, O. Francescangeli, and F. Simoni. Photo-orientation of liquid crystals due to light-induced desorption and adsorption of dye molecules on an aligning surface. Phys. Rev. E, 64(5):051709, 2001.
21. E. Ouskova, D. Fedorenko, Y. Reznikov, S. V. Shiyanovskii, L. Su, J. L. West, O. V. Kuksenok, O. Francescangeli, and F. Simoni. Hidden photoalignment of liquid crystals in the isotropic phase. Phys. Rev. E, 63(2):021701, 2001.
22. L. Lucchetti, D. E. Lucchetta, O. Francescangeli, and F. Simoni. Sine: Surface induced nonlinear effects. Mol. Cryst. Liq. Cryst., 375:1641–650, 2002.
23. M. Peccianti, A. Fratalocchi, and G. Assanto. Transverse dynamics of nematicons. Opt. Express, 12:6524, 2004.
24. B. Alfassi, C. Rotschild, O. Manela, M. Segev, and D. N. Christodoulides. Boundary force effects exerted on solitons in highly nonlocal nonlinear media. Opt. Lett., 32:154, 2006.
25. A. Alberucci, M. Peccianti, and G. Assanto. Nonlinear bouncing of nonlocal spatial solitons at the boundaries. Opt. Lett., 32(19):2795–2797, 2007.
26. A. Piccardi, M. Peccianti, G. Assanto, A. Dyadyusha, and M. Kaczmarek. Voltage-driven in-plane steering of nematicons. Appl. Phys. Lett., 94(9):091106, 2009.
27. A. Alberucci, A. Piccardi, M. Peccianti, M. Kaczmarek, and G. Assanto. Propagation of spatial optical solitons in a dielectric with adjustable nonlinearity. Phys. Rev. A, 82(2):023806, 2010.
28. A. Piccardi, A. Alberucci, and G. Assanto. Power-dependent nematicon steering via walk-off. J. Opt. Soc. Am. B, 27:2398–2404, 2010.
29. M. Peccianti, A. Dyadyusha, M. Kaczmarek, and G. Assanto. Tunable refraction and reflection of self-confined light beams. Nat. Phys., 2:737–742, 2006.
30. M. Peccianti, G. Assanto, A. Dyadyusha, and M. Kaczmarek. Non-specular total internal reflection of spatial solitons at the interface between highly birefringent media. Phys. Rev. Lett., 98:113902, 2007.
31. Y. V. Izdebskaya, V. G. Shvedov, A. S. Desyatnikov, W. Krolikowski, and Y. Kivshar. Soliton bending and routing induced by interaction with curved surfaces in nematic liquid crystals. Opt. Lett., 35(10):1692–1694, 2010.
32. M. Peccianti, A. Dyadyusha, M. Kaczmarek, and G. Assanto. Escaping solitons from a trapping potential. Phys. Rev. Lett., 101(15):153902, 2008.
33. G. Assanto, A. A. Minzoni, M. Peccianti, and N. F. Smyth. Nematicons escaping a wide trapping potential: modulation theory. Phys. Rev. A, 79:033837, 2009.
34. M. Peccianti, K. A. Brzdakiewicz, and G. Assanto. Nonlocal spatial soliton interactions in bulk nematic liquid crystals. Opt. Lett., 27(16):1460–1462, 2002.
35. M. Peccianti, C. Conti, G. Assanto, A. De Luca, and C. Umeton. All optical swit ching and logic gating with spatial solitons in liquid crystals. Appl. Phys. Lett., 81(18):3335–3337, 2002.
36. M. Peccianti, C. Conti, G. Assanto, A. De Luca, and C. Umeton. Nonlocal optical propagation in nonlinear nematic liquid crystals. J. Nonlin. Opt. Phys. Mater., 12(4):525–538, 2003.
37. Y. V. Izdebskaya, V. G. Shvedov, A. S. Desyatnikov, Y. Kivshar, W. Krolikowski, and G. Assanto. Incoherent interaction of nematicons in bias-free liquid crystal cells. J. Eur. Opt. Soc., 5:10008, 2008.
38. A. Piccardi, U. Bortolozzo, S. Residori, and G. Assanto. Spatial solitons in liquid crystal light valves. Opt. Lett., 34(6):737–739, 2009.
39. A. Piccardi, A. Alberucci, U. Bortolozzo, S. Residori, and G. Assanto. Readdressable interconnects with spatial soliton waveguides in liquid crystal light valves. IEEE Photon. Technol. Lett., 22(10):694–696, 2010.
40. M. Peccianti and G. Assanto. Signal readdressing by steering of spatial solitons in bulk nematic liquid crystals. Opt. Lett., 26(21):1690–1692, 2001.