CHAPTER 11
The Ladder and Why You Need One
Only buy something that you'd be perfectly happy to hold if the market shut down for 10 years.
—Warren Buffett
Fixed income markets tend to carry the reputation of being very complex. This is accurate in some cases; however, it doesn't have to be. Truth be told, investing in fixed income markets is as complex as you want it to be. This is true in every sense imaginable. Investors have the tendency to get caught up in the details and complexities of the bond market. This mind-set is driven by all the different investment types and vehicles. If you let yourself fall into the trap, you will see that it is very easy to be pulled further into the complexities and find yourself inundated with Greek letters. This is, of course, only if you let yourself. It is easier than you think to get pulled in, and why not? All you have to do is turn on a business channel or pick up the financial paper and you are sure to read an article on mortgage securities, currencies, or structured debt. The times have definitely changed. There are many strategies that may hold complex characteristics. These complex strategies may be very rewarding, but as with anything, the greater the potential for reward, the greater the chance is for risk.
A successful fixed income strategy doesn't have to be complex; just well-constructed. Leave your risk taking to other asset classes where risk is well rewarded. Taking risk in an equity fund or hedge fund is likely to be much more fruitful than the return of a bond fund.
Whether embarking on a new strategy, balanced with other asset classes, or working with only fixed income securities, a sound strategy is very important. Regardless of how the portfolio will eventually be structured, a fixed income component is an integral part of your investment strategy. This strategy is applicable in varying degrees, whether you are an advisor, generalist portfolio manager, or an asset manager who specializes in a specific sector. You should know common terminology such as duration, coupon, yield, and call date like the back of your hand. Convexity, skewness and kurtosis, and paydown have a tendency to be viewed as more complex concepts, because understanding and successfully applying them is challenging even for the most seasoned asset manager. It is important not to get overwhelmed, to get back to basics and implement a solid and successful fixed income strategy.
There are many different strategies that are viable within the fixed income market. The end investor or portfolio guidelines will determine which strategy is the best fit. A straightforward strategy that I find very successful, particularly if you are in the distribution phase of investing, is a low-turnover strategy called a bond ladder. A laddered bond strategy is one of the most straightforward fixed income strategies and easiest to understand and feel confident about. Simple or straightforward does not mean ineffective, though. Over time, a well-executed and maintained bond ladder is, in my opinion, one of the most successful low-volatility fixed income strategies.
There are many benefits to the laddered bond strategy, which I will dive into later in this chapter. This strategy is not constrained to a particular sector or asset class. It can be implemented using multiple sectors that include municipals, government corporate securities, or any combination thereof. The strategy is also not limited to these sectors; I just view them as the most popular.
HOW IT WORKS
A laddered bond strategy involves evenly investing a portfolio of bonds in different maturities, sometimes referred to as buckets. This occurs over a set time frame. The concept should be easy for an investor to understand. The key principle of the strategy is that there need to be maturities in each year of the ladder. Is this a hard and fast rule? Not necessarily, but an evenly distributed ladder works best for the strategy to accomplish its stated goals. These goals will be discussed later in this chapter.
The Concept
When a bond matures, the proceeds are invested in a bond in the subsequent year of the strategy. This is known as investing in the next rung of the ladder. Let's walk through an example of a how a five-year laddered bond strategy would be constructed. For this example, assume you have a portfolio of $100,000 to invest. We know the amount to invest, and we know the time frame to invest, which is five years. Now let me demonstrate how straightforward the concept really is. What needs to happen is an even investment of the available cash across the five years. In a five-year strategy, that would mean investing 20 percent of the portfolio in each year, since dividing 100 percent by 5 gives you 20 percent. If it is a 10-year ladder, a similar calculation occurs; in that example, 100 percent is divided by 10 to get a 10 percent allocation, which is then invested accordingly across the strategy horizon. Figure 11.1 represents a five-year ladder from a percentage viewpoint and what it would look like invested. If invested properly, each year has an equal weight of investments or maturities, or sometimes a combination of both. You can see how the years invested look like the rungs of a ladder. A sideways ladder, but a ladder nonetheless. Figure 11.2 shows the same ladder, with the incremental yield pickup represented across each rung. In a normal yield curve environment, the further out you extend the yield curve, the greater the yield. Figure 11.2 also depicts how the ladder process works. When the highlighted bond in Year 1 matures, it is reinvested out to the next rung of the ladder. In this example, that would be Year 5. Figure 11.3 shows an uneven ladder and how the cash flows and maturities would not be even.
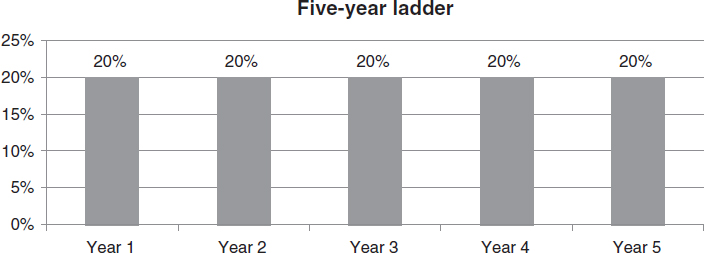
FIGURE 11.1 A Well-Constructed Ladder Investing in Equal Percentage Weights over the Term of the Ladder
You can see that Year 2 and Year 3 are underinvested. Although this is not detrimental, it does depict how uneven the maturities would run. Less maturities each year creates two possible problems. First, an unevenly invested ladder provides less of an ability for a manager to attempt to reduce the portfolio's interest rate risk. It also creates inconsistent yearly cash flows. Remember, reducing interest rate risk is accomplished by reinvesting maturing bonds in the last leg of the ladder at the current market interest rates.
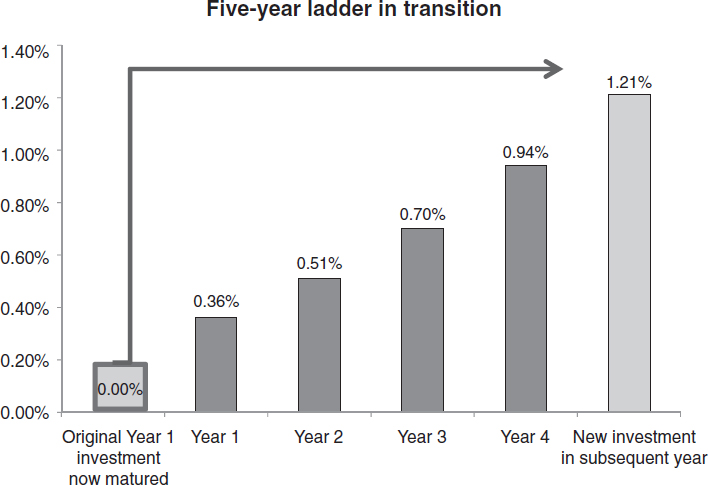
FIGURE 11.2 A Ladder in Transition with Represented Yields
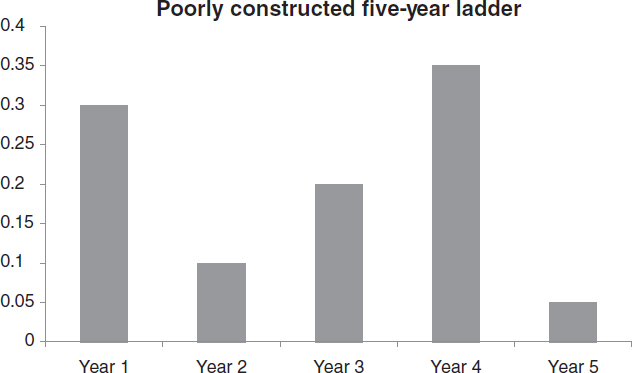
FIGURE 11.3 A Poorly Constructed Laddered Strategy Shown by the Uneven Weights
The structure of a laddered strategy naturally helps to insulate the portfolio from adverse or unfavorable market conditions. The goal of a laddered strategy is to provide, over time, suitable performance in any interest rate environment and markets. The goal relating to its construction is to invest in bonds that can handle the test of time. That means no high-flyers. What do I mean by this? When you are looking for suitable bonds to build out your strategy, don't just buy the cheapest bond on the block. Buying out-of-favor bonds for the wrong reason is asking for trouble. For example, it is very easy to find yourself investing in non-U.S. banks. To start, supply within this sector is a spigot that can't be turned off. The recent yield advantage will also test your discipline. If you feel that you are being pulled into this trap, take a step back and ask yourself, should my portfolio be heavily concentrated in the financial sector? A heavy concentration could be detrimental due to ongoing risks from the financial institution's balance sheet. Additionally, the noise from headline news that resurfaces from time to time has the ability to disrupt the structure of the ladder, resulting in potential losses if a company falls on difficult times. Many European financial institutions are trading at a discount to financial institutions within the United States and other countries. Ultimately, you need to take a disciplined approach, keeping close to your heart how quickly trouble can arise. Even in the good times, you need to acknowledge that a portfolio full of bank names is not a well-diversified portfolio.
The Goal
An investor may implement a bond ladder if he or she is seeking consistent results that may be generated in different interest rate environments. To elaborate, the strategy will do well in a bull market, which is when prices are rising and yields falling. Over time, it should also do well in a bear market, when prices are falling and yields are rising. The added benefit of this strategy is that it is designed to hold up well in a range-bound market as well. Performance should be defined—in all previous examples, and for the rest of the chapter—as preservation of capital and the ability to receive consistent current income. Key to achieving solid performance is to avoid defaults or bonds that have a deteriorating credit profile. High-quality bonds are purchased with the view that all coupons are to be made and the company's balance sheet is strong enough to minimize the odds against ratings action. Remember, in the end, for a low-turnover strategy, ratings actions will create volatility. Volatility will not impact the end result if the bonds are held to maturity and you receive the repayment of your funds.
Navigating through the ins and outs of markets is challenging, to say the least. Market gyrations, even if expected, can be daunting. And let's be honest, it is very difficult to consistently predict market moves, even for professionals. The best fund manager misses the mark from time to time. Let's face it, we are all human. The trick is to get more right than wrong. The beauty of a ladder strategy is that the goal of a laddered portfolio is straightforward. Straightforwardness with transparency is welcome after the chain of events that occurred within the markets beginning in the summer of 2007. The events that occurred could not have been scripted any better. The asset backed commercial paper (ABCP) and structured investment vehicles (SIV) came under pressure near the beginning of the trauma, which started the ball rolling. Following that, the straw that broke the camel's back was the “too big to fail” dilemma within the financial sector in 2008 and the start of the global recovery in 2009. Remember, it didn't stop there. The U.S. economy showed signs of strengthening; however, global economies started to come under pressure. Debt burdens across the globe started to impact financial markets, affecting investors. Uncertainty fell across various regions, from Ireland to the Middle East, finally settling within the eurozone. With the recent turn of events, it is easy to say that all markets, not only the fixed income market, have been challenging. After the headaches and turbulence of recent years, I have found that investors are eager to implement a strategy that has straightforward goals and will provide a benefit them in almost any period. At this point, the direction of interest rates, although a concern, is not at the top of everyone's list.
Look at the strategy from a different angle. Investments are made within the strategy that simply and clearly help mitigate interest rate risk. How does that work? If interest rates move higher, the portfolio will perform well within that interest rate environment. Why is that? Remember, as bonds mature, the proceeds are invested in the next rung or year of the ladder. If interest rates are moving higher in a bear market, the bonds that are maturing have a lower yield than the bonds that will be purchased. If a bond maturing was purchased at par yielding 2 percent and paying a coupon of 2 percent, it is providing $200 a year for every $10,000 invested. If the maturing bond is replaced with a bond yielding 3 percent and paying a coupon of 3 percent, not only is the average coupon of the portfolio going to increase, but you just increased your income by 1 percent, or $100 a year. That is pretty straightforward.
A similar scenario occurs in a bull market environment. If interest rates are rallying, you find your investment portfolio is in the midst of a bull market. This might be a time when volatility is increased. Volatility or not, the fixed income market does not stop. Usually, in this environment, it just so happens that you have a bond maturing. Even a rallying market is a positive for a portfolio with maturing bonds. In a bull market, the yields on your securities will move lower as the price of the bonds moves higher. In this scenario, your fixed income positions are appreciating as prices move higher. The downside is that you are replacing a maturing bond with one that may have a lower yield and coupon. The positive is that there will likely be a significant amount of supply. Companies always like to issue in a bull market. The nature of the strategy helps to mitigate this risk in this market as well. The maturing bond is replaced with another bond, which is placed in the next rung of the ladder. In a five-year strategy, the maturing bond is replaced with a bond that has a five-year maturity. This helps mitigate reinvestment risk because the bond with the longer maturity usually carries a higher yield than the maturing bond.
A benefit of a well-constructed laddered bond strategy is that it satisfies income needs while preserving capital. This strategy provides investors the ability to forecast and receive income from a fixed coupon payment. Due to these characteristics, there are many reasons that an investor may look to implement this strategy. It is a popular strategy where the portfolio is geared for consistent distributions. That is, the portfolio will be managed for income with a set amount of funds. The asset manager should not expect the ongoing addition of new funds. In addition, a primary reason to implement this strategy is the preservation of capital.
To a fixed income investor, preservation of capital is usually one of the most important characteristics. A laddered bond strategy accomplishes this in a number of different ways. First, the portfolio has minimal turnover. Portfolio turnover is a term that is used frequently within the equity market and when discussing certain fixed income bond funds. Turnover is exactly what it sounds like: the percentage of the holdings within the portfolio that is turned over. Another way to look at this is how frequently the manager of the fund or separate account buys and sells securities. There should be little turnover within a laddered bond strategy. The lack of turnover does not burden the portfolio with realized gains or losses—losses that could inadvertently reduce the portfolio value, not to mention create additional tax measures on the investor.
THE LONG END POSES CHALLENGES
I will say it right up front: The long end of the yield curve should be left alone unless you have specific and unique goals. Before we go any further, let's define the long end. This is the part of the curve that represents 20- to 30-year maturities. Primarily, institutional investors utilize this part of the curve. These investors are who you would think they are; for example, corporations and pension funds. Institutional investors have a completely different investment goal. They are usually not looking for current income derived from a coupon stream. These investors are utilizing the long end for different strategies. For example, institutional investors may utilize the long end of the curve to match liabilities through various strategies, one known as LDI or liability driven investing.
The long end of the yield curve is known for market volatility. Market volatility leads to portfolio volatility. Volatility is usually a negative characteristic for an investor who is seeking income or concerned about the potential for realized or even unrealized losses. Some investors, institutional or otherwise, may not want to worry about having to time a redemption in a volatile market. A few examples might be an education expense or an unexpected capital outlay. Why put yourself in the situation where you may be forced to take a loss holding a high-quality bond just because of market volatility?
Here lies the problem. The 20- and 30-year part of the yield curve may be enticing to investors in a low-turnover strategy. One reason is that additional supply goes hand in hand with that particular part of the curve. Depending on the interest rate cycle, the long end of the yield curve may be very favorable for companies to issue debt in. Low interest rates equal cheap long-term funding for corporations. It makes sense that a company would term out its debt; that is, retire current debt at the front end of the curve and reissue it for 30 years at low yields. Therefore, depending on the cycle, there may be ample supply in this part of the yield curve. We saw this happen when the fed funds rate was held in the range of 0 to 25 basis points. The other alluring characteristic of the long end of the curve is that bonds with longer maturities usually carry an increased yield and potentially larger coupons. This is very enticing to some investors, particularly if they are looking to achieve a certain coupon to provide a specified amount of income from the portfolio. Duration, a concept we all know well, is another characteristic that usually increases as a bond moves out the yield curve. This trait is not as appealing to those accounts in a low-turnover strategy or that subscribe to the notion that volatility may be negative. Unless the bond has specific optionality or unique characteristics, the longer the bond, the greater the duration the bond carries. A bond that has a longer duration is impacted more by changes to interest rate movement. This increased duration could create an increase in general market volatility and an increase in the price volatility of a bond. The extra yield that you may pick up, and I did say yes you may pick up, is not worth the extra risk that is attached to the bond. I am sure you have heard before that there is no such thing as free ride; this holds true within the fixed income market as well. Investors have learned over the years, particularly since the Great Recession, that when something looks too good to be true, it probably is.
For example, if bond (A) has a higher yield than bond (B), but both have similar maturities and credit ratings, the bonds are not truly similar. Take a hard look at the characteristics of each bond. The additional yield you are receiving is likely indicating that the credit profile or liquidity characteristics between the two bonds are different.
The Front End Is Technical
When discussing the yield curve or credit curve, let me first clarify what I determine to be the front end. For the purpose of discussing appropriate terms for ladder strategies, the front end of the yield curve is the spread between overnight securities and those with a final stated maturity of 13 months. This particular section of the curve is very unique. It trades unlike like other sectors within the fixed income market. Excluding the financial companies, such as banks, insurers, and broker dealers, issuance is secondary to most companies. From my experience, financial institutions represent approximately 60 percent of issuance within the very front end of the credit curve. Because so much supply comes from the financial sector, it is, at times, very challenging to remain diversified. It isn't always this way, though more often than not, it seems to be.
The front end is like the bastard child of the fixed income market. Excluding government securities, it is also essentially viewed as second-best by the issuing community. Why are banks so involved in the front end? They need overnight funding to maintain and run their business.
Varieties of Short-Term Strategies
There are passive strategies that are created in an effort to provide an enhanced yield to a money market strategy. There are also different active strategies that aim to take advantage of the dislocations within the money market and short-term arena. These strategies have different risks that are always fully uncovered through different market cycles. They are not always present, but have a tendency to rear their ugly heads when investing in this type of strategy. There are significant differences between these cash alternative strategies and a laddered strategy. Most of these strategies require a more active approach. A key difference is that the active mandate will have a higher turnover ratio, which may generate both realized gains and losses. As discussed earlier, the turnover ratio is how many times the bonds are changed within the portfolio. A laddered strategy, even with a low turnover ratio, is also able to take advantage of certain dislocations within the front end of the credit and yield curve.
You do give up yield by investing within the front end of the curve, which hinders your creation of annual income. Unless you are designing your strategy with a short-term goal in mind, it may make more sense to incorporate the front end of the yield curve within a longer-dated strategy. In other words, leave the front end alone unless you are creating a strategy designed to replace a money market strategy or the front end is a compliment to a longer-dated strategy.
THE SWEET SPOT
Okay, so if I am telling you to avoid securities that reside within the first 13 months in the yield curve, the front end, and I am also stating to avoid the long end or the 20- to 30-year portion of the curve, than what is left? The sweet spot is the place to be. What is the sweet spot? The sweet spot is what I refer to as the belly of the yield curve. The term “belly of the curve” is sometimes thrown around representing different time periods or buckets. The six- to 12-year time frame within the yield curve is usually viewed as the belly, but some investors may narrow this range to the eight-to 10-year frame, and others may expand it. For building a ladder, I make a minor modification when defining the belly of the curve, stretching the range by three years. By stretching the range to include the 3-year to 10-year points or buckets, you have now created the sweet spot. From a pure market perspective, this range contains the optimal years to use when creating a ladder strategy. Let me be clear that ladder strategies can be utilized throughout other maturity buckets. Investors have different needs and goals, which may present the need to structure a strategy outside the sweet spot, which makes complete sense. But the sweet spot carries true beneficial characteristics. There are three characteristics that are represented in the sweet spot: liquidity, consistent coupons, and ample supply.
LIQUIDITY
If you ask five individuals to define liquidity, you will likely receive three to five different definitions. There are a handful of ways to describe liquidity. Although you may receive five different answers for the definition of liquidity, there is only one correct answer.
Liquidity does not just represent the ability to be able to buy and sell bonds. Transacting is easy. Liquidity represents the ability to buy and sell your individual holdings at a price that is acceptable to you. There are two key pieces to this definition. First, notice that I said “buy and sell.” Second, and more importantly, you need to be able to transact at a price that is acceptable to you. An acceptable price to you is an important piece and is a significant differentiator in the marketplace. There is always someone to take the other side of a trade, but just because there is a buyer for your bond doesn't mean that the price is acceptable to you.
Not to pick on Lehman Brothers, but on the day that company declared bankruptcy, there were buyers of the debt. Unfortunately—or fortunately, depending on which side of the trade you were on—the price was somewhere in the range of 10 cents to 29 cents on the dollar. You may say that Lehman Brothers debt was a special occurrence. Well yes, it was; however, the demise of the company didn't just affect its debt. It sent shock waves throughout the markets, hitting the financial sector the hardest. Roughly two weeks after the financial crisis was near its peak, all financial institutions remained under pressure. That includes banks, brokers, insurance companies, and anyone else that might have had a financial arm. This list included the automakers, companies that make heavy machinery, and even some very diversified companies that have a finance arm. In some cases, the finance arm only existed to help a company execute its ongoing funding needs, to help it remain a going concern. The bottom line: Companies other than broker-dealers were negatively affected by the recent activity and moved lower in sympathy. In other words, these names were guilty by association. It shouldn't be a surprise that liquidity was a concern. The shock and lack of liquidity did not just affect the lower-rated or esoteric debt—that would have been too easy and sensible.
Higher-quality credits were impacted as well. Names from both the financial and nonfinancial sector were affected. One name in particular within the financial sector comes to mind. The company was a triple-A bank that issued and sold debt frequently to investors in the money market sector. The money market sector can be defined as the same time frame as the front end of the yield curve. There are different criteria that provide money market managers the ability to extend past the 13 months and buy longer-dated debt. Different structures, such as callable bonds and those with put dates, allow this to happen. I am not going to go into the details, but it is important to mention. At any rate, the triple-A bank's balance sheet was strong, very strong. Fundamentally, it was a sound institution deserving of its triple-A status. Where the breakdown occurred was within the markets. Investors or traders changed their perception of the bank. Thinking back, the perception of the bank might not have changed; what changed might have been how risk was evaluated. I have to admit, my view at the macro level changed as well. The red flags went up over the entire sector, just not fundamentally for the company. Throughout the weeks the company remained strong and a going concern. The company's profile didn't change. What did change was how the equity market was falling, sharply impacting and taking along with it the financial names, including the triple-A bank. Equity traders were on a witch hunt looking for the next victim. Credit spreads were widening, pushing prices to new and unheard-of levels for high-quality paper.
The triple-A bank that we owned matured in less than two weeks. To be clear, that is less than 14 days. Due to all the volatility and uncertainty within the financial sector, we shopped the bond to different dealers looking for a bid. We were not necessarily looking to sell it. It was about price discovery. Now let me frame this a bit further. We owned a bond that would mature within days and carried a triple-A rating. The bond should have been trading right around par, carrying a price of $100. The par amount of the bond was roughly $50 million. It was not an odd lot that, in stressed times, will likely receive a below-market bid. Unfortunately, the price that we received on our round lot offer was nowhere near the level a triple-A, strong financial bank should trade at—which is par. The price that was quoted from the dealer community was around 80 cents on the dollar. 80 cents! We could have hit the bid and sold the bond at this level but chose not to. It was tradable, but did not offer very good liquidity. This is a prime example of how a bond can be traded but still remain illiquid by my definition. Again, the important piece is that the bond out for bid must receive an acceptable price. It is clear that the 80-cent bid was not an acceptable price. We held the bond for the remaining days and received par—100 cents on the dollar. It clearly makes sense that, as an investor you are always searching for the best price. Don't let anyone throw the blanket statement out there that the bond is liquid. Yes, of course it is liquid, but at what price? In this case, the market environment was hindering the liquidity of the bond. In some cases, the characteristics of the bond may detract from its liquidity, and sometimes the entire sector may be out of favor, which could negatively affect the ability for a bond to be traded.
There are multiple reasons that a bond could become illiquid; some inherent to the actual bond and, like in the example above, some due to the environment impacting liquidity. Because there are so many factors that can impact your bond's liquidity, remember to take advantage of what is given to you. This is why it makes sense to use the sweet spot of the curve, if at all possible. It is usually the most liquid holding with the highest probability to receive best prices. One reason for this is that there are many different buyers and different strategies that utilize the selected time frame.
CONSISTENT COUPONS
Capturing sizable coupons within fixed income investing is always very important, because a portion of your total return is driven from the income. Capturing sizable coupons in a laddered or low-turnover strategy is paramount. As we work through this section it will become apparent why it is so important to achieve the highest possible coupons. First, let's answer why it is so important to attain strong coupons. In a low-turnover or passive strategy, the investor is looking for income. More times than not, this income is used as a key contributor to performance. Preservation of capital and current income are attractive qualities to investors within these strategies. Coupons are generally not the focus in a total return strategy, whether it is in a mutual fund or separate account structure. Coupons may be part of the strategy; however, they play second fiddle to other strategy components.
Now that we have established that coupons are an integral component to a laddered strategy, we need to focus on the coupon itself. You might have noticed that I keep using the word strong when referring to the coupon. Why is that? Coupons, like anything else, have characteristics. A strong coupon may be looked at as greater than current market levels. The benefit: The income that is generated will be greater than the market average. The downfall: There may not be a great abundance or availability of these types of coupons. What is more important than the one bond that provides a higher coupon is finding the right mix of coupons to create that consistent stream of income. Finding that consistency within a portfolio that places a heavy emphasis on coupons sounds a lot easier to accomplish than it really is.
Consistency allows you to create and distribute a weighted average coupon at the portfolio level without having to overweight or underweight different parts of the yield curve. This is more important than you may think. If you deviate from the structure of the strategy, you chance losing the benefit of mitigating interest rate risk. It is not as simple as it may sound. Portions of interest rate risk may be gained or lost depending on the severity of the deficiency. As you know, the yield curve doesn't always shift in parallel fashion. It may steepen or flatten at various points. If the current allocation to the portfolio is under- or overweight in that section, your portfolio may be disadvantaged. With that said, it may work in your favor and you may be overweight the point of the curve that is rallying or underweight the point that is selling off. The problem is the uncertainty and the unknown that could create adverse end results for the portfolio.
Having the ability to invest and create a consistent coupon stream aids in reducing various risks and allows the portfolio, once implemented, to run in an efficient manner. It must be mentioned that there are times when a premium must be paid at the time of purchase. This usually happens in a bull market, when interest rates are moving lower and when companies are issuing debt or replacing or adding to existing debt. The higher premium that you pay will equalize the yield to maturity of the bond. The search for consistent coupons is imperative for consistent income.
For example, if the goal of the portfolio is to generate $500,000 in income a year, a $10,000,000 portfolio would need to have a weighted average coupon of five percent. In an ideal setting, the manager would be able to invest in bonds that all carry a five percent coupon. This is not always possible, for many reasons. Usually when constructing a well-diversified portfolio, investments are made over the course of several weeks. This is also determined by the strategy that the manager is implementing. For instance, a Treasury-only or government portfolio will take far less time to invest than a state-specific municipal portfolio. Over time, as interest rates move, volatility is created and within volatility comes an interest rate roller coaster ride. This ride usually will create an environment that is not conducive to finding consistent coupons. There is, however, a greater likelihood of accomplishing this with a ladder implemented in the sweet spot of the curve.
WHY IS SUPPLY IMPORTANT?
First, supply is a term that is used to describe bonds that are available for purchase. You may have heard this expressed in other ways as well, such as new issue calendar and visible supply. Supply is the amount of issuance that is brought to market. It is the number of bonds that companies offer to investors in the marketplace, measured on a daily basis or aggregated to yearly figures. It is straightforward—the larger the supply is, the more bonds that are available for purchase. What needs to be assessed and determined is the net supply amount. This is exactly what it sounds like. The net amount is the difference between new supply brought to market and the amount of debt that is retiring. For instance, if there is $200 billion of new supply brought to the market, that might sound like a lot (or it may not). In all seriousness, if $100 billion of the supply is replacing $100 billion of bonds that are maturing, you only have $100 billion of net new issuance. Now the number doesn't look as significant. Trends also need to be looked for, as history paints a picture of supply trends. If you look back over 2011, issuance totaled 858.1 billion. Net issuance was 460.6 billion (data according to Barclays Capital). If you track the data, trends will start to appear. Think about it this way: If you know that supply increased every March, you should be able to structure and build your portfolio with maturities to coincide with the months that provide ample supply. The greater the number of bonds for purchase, the better diversified the portfolio is. If you were in the market for a new car, would you go to the dealer that has three cars on the lot to choose from? No, you would go to the auto dealer with 300. The same holds true when buying bonds: The greater the supply, the more options you have for your portfolio. Think back to the discussion about the front end of the curve and how the majority of issuance was from the financial sector. If 60 percent of your portfolio is invested in the financial sector, you may feel that your portfolio is not well diversified. You would not want to run into this scenario unless you are building a highly concentrated or specialized portfolio. The bottom line is that supply is important because it allows you to better diversify your portfolio and invest in an efficient manner.
Supply comes in waves, and this is one area where history is able to help predict future activity. Each sector has its own unique trends and supply activity. August, for example, is well known in the industry as the summer month that is very slow. Activity is almost nonexistent. The running joke is that the market and Wall Street shut down. Traders, analysts, and portfolio managers are using the remaining warm summer days to hit the beach. And just like that, the new issue calendar dries up. However, the first week of September usually brings an onslaught of new deals. Patience is rewarded if you wait. As an investor, it is in your best interest not to fund or fully implement a strategy toward the end of summer if you do not need to. It pays to wait.
There is another time of the year when investors can count on seeing additional supply. This time around, it is from the government and in the form of Treasury securities. Fast forward six months from the end of August. We're now in the February-to-March time frame. Around this time every year, the market is hit with an abundance of new supply from the U.S. T-bill market, as the government issues additional debt leading up to Tax Day. This is important because with additional supply there are likely more sellers than buyers, or not enough buyers to take down all the debt. This imbalance creates an environment where prices fall, pushing yields higher. Dealer balance sheets are full, and in order to reduce them, they must cheapen the bills to try to entice additional buyers. This occurred in February 2012. U.S. Treasury bills were carrying a negative yield to 10 basis points, depending on what maturity you were looking at. Prior to the backup, one-year bills were paying 8 to 10 basis points, and the one-month bill around 5 to 6 basis points. What paltry yields. This was the period when Greece was on the verge of defaulting and the Fed was anchoring the front end at zero interest rates. To start, whether interest rates were at 10 basis points or five percent, the pickup for extending your maturity 11 months was not really significant. Remember that yields, particularly in the front end of the Treasury curve, were at historic lows. They were supported at these levels by the loose monetary policy and ongoing threat of default by Greece or any of the European financial institutions. At these low levels, it almost seems not even worth mentioning for a couple of basis points. In this type of environment, a couple of basis points can make or break your year. Prepare for a backup in yields by temporarily building a larger percentage of cash ready to take advantage of the yield dislocations. This period in time creates an excellent buying opportunity on the backups or dips.
The construction of the ladder takes one shape and one shape only. This is the even distribution of bonds across a set time frame. Although a ladder can be constructed over any time frame, short or long, the front end of the curve or long end, the sweet spot is the optimal spot for implementation. A ladder strategy can utilize different asset classes that range from Treasuries to municipal securities, and potentially, anything in between.
PERFORMANCE AND HOW TO MEASURE IT
In this day and age, everyone and everything is measured on performance. Individuals at their place of employment are measured on their productivity—a form of performance. Computers are measured on the speed of the processor. What about cars? Let's stick with the speed theme. One performance measurement for a car is how fast it goes. What is its top speed? If you line up a high-performance sports car against a sport utility vehicle, chances are the sports car is going to outperform the sport utility on the straightaway. Let's be serious, the sports car will blow it away. It is a faster car. But what happens if we take the race off-road where there is not a smooth surface, there is mud and brush. There is a greater chance that the sport utility will be victorious. One reason the sport utility outperforms the sports car this time around is that there is a different set of circumstances. Each car is a winner under a particular set of circumstances or rules. Just as there are different ways to measure performance when judging cars, it is a similar story when measuring investment portfolios.
The question that I am always asked is, what is the most appropriate way to capture and measure portfolio performance? Just like in the example of the sports car racing the sport utility, it depends on the surroundings. If you use your imagination, what needs to happen is to swap out the mud and brush for the investment policy statement that outlines the portfolio characteristics or portfolio surroundings. Within the fixed income world, there are different categories that strategies fall under. Looking down from above, there are actively managed strategies and passively managed strategies. There are ways to measure performance on both styles. As you may have guessed, a different road needs to be taken for each style, because each style has different characteristics. At first, you need to take a step back as it may be difficult to gather the different attributes that need to be analyzed. Different strategies have unique and inherent goals that require an open mind to performance measurement. I say an open mind because depending on the strategy goals, you may need to think outside the box on how to judge and measure the portfolio. This is not an overnight process and may take some time to figure out. No matter how much time and effort is required, it is imperative to figure this out so that an accurate assessment can take place.
LOW-TURNOVER DILEMMA
Measuring performance is an age-old conundrum as it relates to passive or low-turnover fixed income strategies. As just mentioned, the question that is always asked is what is the best way to judge the account? Should the investor grade the manager? The simple answer is yes, but how? Should the manager be measured on how he or she does versus a benchmark? If so, what benchmark? Should the portfolio be judged on how much income it generates, its yield, or a combination of any of the above? All of these characteristics can be measured. The difficult decision is which characteristics to use, and then, how to measure them. When deciding how you plan to measure the portfolios, keep in mind the basics. This is where the customization comes into play. Don't lose sight of the strategy's goal. If the primary goal is the preservation of capital, and the income the strategy generates is secondary, these should be incorporated in the performance measurement. This is an important notion: to look at performance in a different light. The traditional way investors measure the performance of a manager is to calculate alpha.
Too many investors get hung up on the alpha concept. Alpha is the portfolio's excess return over a stipulated benchmark. This concept is not a proper way to measure performance for all strategies. For an active strategy, yes, absolutely, calculating how a manager generated alpha and the amount is the proper measurement. However, a laddered bond strategy is run in a passive manner. This strategy has a very low turnover ratio and is not run in a total return fashion. This should be no surprise, due to the usual goals of this type of mandate. In the end, the return of the portfolio should be measured with other goals that are more in line with the strategy goal and not alpha in its typical sense.
Aside from a total return bond fund, in a low-turnover or passive strategy, there should not be a return or alpha target and there should be no benchmark used to manage against. Take out the notion of managing and the need of a benchmark and you head off many problems. I know because I have dealt with numerous questions on this topic. It is sometimes difficult for the end client to grasp this concept. This concept easily becomes confusing to some investors because performance and alpha target are ingrained into everyone's head as soon as they are old enough to understand what an investment is. It is understandable, because investors are brainwashed with stock market ideals and commonality, as equity portfolios are measured versus a benchmark, striving for alpha.
A laddered strategy is an investment that is a long-term solution that provides the preservation of capital and current income. Because the portfolio carries these two characteristics, performance needs to be measured in a way that captures these traits. One way I like to assess the success of a portfolio is to look at and compare the yield at purchase of the portfolio to the yield of a market benchmark. I use the yield at purchase over current yield or yield to maturity to measure the success of the strategy. This measure is important. For a strategy that has little to no turnover, efficiencies are one way to garner strong performance.
SUCCESS OF A STRATEGY
The trade and executed price will drive the success of the strategy. Driven by capitalizing on dislocations at the security level, you must create a strategy with a higher yield at purchase than the current market yield to represent a successful solution. The yield at purchase is chosen because a well-implemented portfolio has little to no turnover. The yield to maturity takes into account the current market price and provides a snapshot of the portfolio, but not an accurate read of the overall portfolio yield. Using the current market price represents a yield that an investor would expect to capture if the portfolio was funded at that point in time. From that viewpoint, it is clear why that information is good information to have, but not relevant to the portfolio performance. Since the goal of this strategy is to have minimal turnover, new securities will not be added to the portfolio on a regular basis. There will be additions when bonds mature; however, not in the interim through the new issue calendar or dislocations arising from market volatility—two components that impact an index.
If you are set on measuring your portfolio by the amount of alpha it generates, you will need to set a benchmark to measure it against. There are many different indexes to choose from. The important aspect of choosing an index is to pick one that represents your goals and the characteristics of your portfolio accurately. What I mean by this is that you would not want to use an all-Treasury index if your portfolio holds corporate government and mortgage debt. (Well, you may, however it would not be a true comparison.) Also make sure the characteristics are the same, or at least similar. You don't want to compare your portfolio that is invested in the sweet spot of the yield curve to an index that has 30 percent allocation to the 30-year part of the curve. This type of inconsistency will likely create havoc on calculating performance attribution. If needed, go back to Chapter 10, “The Yield Curve,” as it will provide the different shapes of the curve and potential impacts. There are many different index providers, so the task in finding one that is a good fit should not be too difficult. If using a benchmark is the path you choose, I can't stress enough: Make sure that you are comparing apples to apples with your index and portfolio.