CHAPTER 7
Asset Allocation
In the business world, the rearview mirror is always clearer than the windshield.
—Warren Buffett
Asset allocation is an integral piece of investing. This chapter will discuss the broad theme of asset allocation and why it is necessary. I will walk you through laying the groundwork for tracking the markets and applying what you see to your strategy, and show the specific need for going global. A more detailed outline of creating an asset allocation mix was covered in Chapter 6, Portfolio Construction.
Image you are driving across the country and you come to a fork in the road. This fork is unique. Instead of the typical fork with three or four prongs, you are faced with a six-pronged fork yielding multiple decisions to make. This a daunting task, to say the least, that all investors at one time or another have encountered. Adding uncertainty to the mix is the fact that not one of the prongs is labeled. There is no information showing up on your car's GPS system, and even your map is blank. All you have to go on is your instinct. Unfortunately, your instinct doesn't go too far, and may fall short even when it comes to providing comfort to the passengers in your car.
Now picture each prong of that fork as a different segment of the fixed income market. From an investment perspective, markets rarely telegraph a direct route or paint a clear picture of future movements. This opaqueness can leave investors disorientated and less than 100 percent confident in the current and future state of the economy and markets. If you have ever been in that state, you know how it feels, and it is not pleasant. Looking through clouded glasses is not a position that anyone wants to find themselves in when there is money on the line.
Markets do, however, provide data points. It is these data points that need to be embraced and utilized to provide direction. These points are to be used as a guide. While some of the best investors have incredible instincts, proper tools still aid in the decision-making process. These tools are used to capture the turning points, reversals, and momentum shifts that may impact the fixed income strategies. To capture the different indicators, you need a starting point. Just as a map is needed at the fork in the road, a map needs to be developed to help navigate through the ins and outs of the market and economy, providing to you and any passengers that are picked up along the way a path to success.
THE ROAD MAP
Markets today are tightly intertwined, which can make them that much more difficult to dissect. If you had a time machine to take you back a decade or two, the interaction between markets would look very different. As with anything, markets evolve. New products are engineered to create wealth and to protect the wealth that has already been created. At first glance, the launch of any new securities sets the expectation of increased efficiencies. Efficiencies are then followed by added transparency, and in the world of investing that means everything.
Transparency is much sought after today as global markets are converging. Once, what seems like many years ago, sectors were not viewed as one functioning entity. The notion of being intertwined to the extent that markets and sectors are today didn't exist. Even prior to the financial crisis that surfaced in 2007, the markets were separated in what I refer to as silos. Each sector or asset class had its own unique silo. Information was not crossbred or transferred frequently from a manger within one asset class to one in another. At the time, it didn't seem as necessary as it does today. Asset managers who ran money market funds were focused primarily on securities within the money market arena, as were portfolio managers within other asset classes as well. I am not saying that they didn't follow other sectors or express views about the economy. They did, and I am speaking from experience here—when I ran a money market mutual fund, we tracked and followed numerous indicators and followed different sectors. The difference is that today, what is happening on the mortgage or swap desk is more closely watched and analyzed with the goal of pinpointing any, if not all, possible risks and outcomes if there were a meltdown or problem within that sector.
Prior to 2007, many money market managers were probably not as concerned with what was happening on the swaps desk as they would be, or better said, should be today. The question was most certainly always raised, how the current swap activity would affect or change any decisions on what commercial paper to buy or how would it directly affect the short-term issues already owned. Maybe it is that the markets are much more correlated, as activity impacts each sector more directly. Or possibly, asset managers are that much smarter today because we have all lived through the market disruptions and activity. Either way, the stronger asset managers are keeping closer tabs on any sector that has the ability to disrupt or impact their positions.
Yes, I do think any asset manager who has successfully made it through the recent years of bank closures, government bailouts, and market disruptions has learned many lessons. Asset managers today should have the attitude and view that anything is possible, and as I mentioned early on in this book, expect the unexpected. Hold that statement close to you heart, because what you don't prepare for will likely hurt you. The markets are tightly linked, and that needs to be a starting point that creates an analysis broad enough to capture any disruption or dislocation within the markets.
The starting point on my road map is finding the right tools to help guide and answer any questions that come my way. I always start with the 10,000-foot view and work my way down. There are two ways to accomplish this. You either need to find a broad metric that helps telegraph the points that are needed to start your assessment, or to create a customized model or sentiment index. There is no question that finding an already-existing index or model is easier, but one potential problem is that it may not provide the exact information you are looking for. There may be a crucial piece missing. If you are lucky enough to find one that captures the pieces you are targeting, it will save you many hours of construction and updating. Ultimately, if you have the necessary time or you are looking to target a specific sector or section of the economy, a custom model is likely to provide the best result.
Figure 7.1 represents one of the two sentiment indicators that I created and look at daily. It is based on various metrics that help telegraph the fixed income landscape. It goes without saying that any model should not be used in isolation. It provides the starting blocks, and when combined with fundamental research, analysis, and instinct, helps form the necessary tools to help create or maintain your asset allocation. A benefit of using different models and various types of tools is that they add a nonemotional element to the mix, helping formulate views and ultimately, decisions.
This model captures broad market indicators, which are weighted accordingly, to provide a snapshot of the general health of the fixed income market. More specifically, through design, it captures a few volatility metrics that help portray the tone of the market. At the 10,000-foot level, it is important to use indicators that capture the breadth of the market. A too-specific or detailed input is not appropriate. To gain a sense of the broader market, I chose to use a combination of both equity and fixed income statistics. Historically, the model or index shows a strong record of representing turning points within the fixed income markets. Index peaks back in early 2006 and early 2009 represent the start of a massive move tighter in spreads and a march to a healthier market environment.
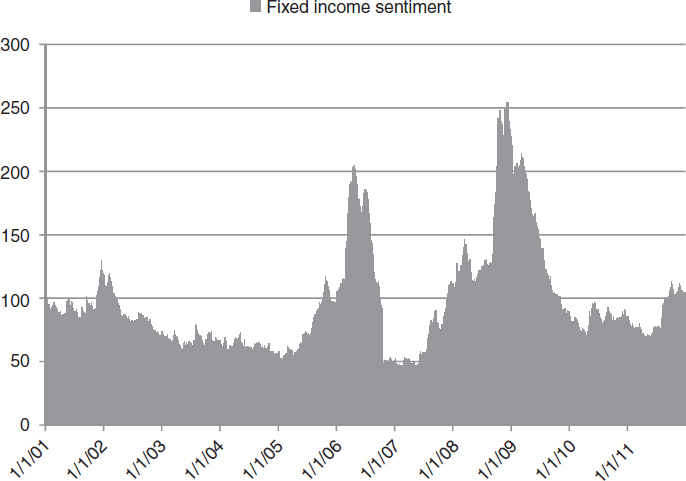
FIGURE 7.1 Fixed Income Sentiment Index Measuring Volatility
Source: Bloomberg data, Barclays Capital data.
Carving out the time span from the fourth quarter of 2006 to the third quarter of 2007, we see in the model that the fixed income markets were complacent and looking frothy. At that point in time, the housing market bubble was stretched to extremes, ready to pop. Spreads were at unwarranted tight levels, and risk was abundant, even though it was perceived not to be. Clearly, caution needed to be taken. The model is not a crystal ball and does not forecast an exact turning point. A model such as this one requires you to use your skill set and knowledge of the current environment to add to the data the model provides.
Fast forward two years. The market continues to regress back toward the mean. Barring any exogenous event, at this point in time we would expect the fixed income market to remain healthy, anticipating further tightening within credit markets as the broader market continues to normalize.

FIGURE 7.2 Economic Climate Index
Source: Bloomberg data; the Association of American Railroads, http://www.aar.org/NewsAndEvents/Freight-Rail-Traffic.aspx.
To navigate through the turbulent sea of indicators while piecing together the broad yet intertwined data points, I utilize not only the fixed income sentiment model but also another sentiment index that closely tracks economic activity. Figure 7.2 adds another piece to the puzzle as it captures on a timely basis the release of various economic indicators and tracks their progress. This model, combined with the other, provides a deeper technical view of the market landscape.
An economic model used with the market sentiment model sets forth a clearer picture for you to make decisions. The combination of the models allows you to see a picture not only of market sentiment, but also the economy, and how one might drive the other.
The history over the past two years proved to be a challenge for the U.S. economy. There were plenty of false starts before the data gained traction, finally taking hold in the first quarter of 2012. The model shows what looks like a bottom in mid-November 2011. Support was found, as there were two attempts to move lower before the sharp move higher that commenced over the subsequent weeks.
There is no doubt that the U.S. economy has embarked on the road to recovery over the past few years. It has been a choppy ride, with different sectors taking turns on providing multiple starts, stops, and at times what felt like false hope. There are many differing views on the path ahead, but as the models show, the path looks bright. The economy and global markets will all play roles in the outcome of the journey. The task at hand is laying the groundwork to successfully reach the endgame. The game plan will need to be able to face different markets with periods of stabilization and bouts of turmoil thrown in the mix. The best way to navigate the markets and uncharted areas is with the right mix of sectors and securities. This is accomplished through asset allocation.
GOING GLOBAL
One goal of asset allocation is to reduce systemic risk. Proper asset allocation will help mitigate risk, but it will not remove it completely from your portfolio. Let's be honest here: If the global economy is slowing and on the fringe of entering a recession, the U.S. markets and those abroad will trade in similar fashion. That is to say, they'll trade lower as well. In that case, diversification will allow the portfolio to receive the varying degrees of negative returns, which may help the portfolio stay ahead of where it would have been if investing in only one or two asset classes. That is the goal. What investors have going for them today is the availability of global strategies right at their fingertips. Developed or emerging markets, or a combination of both, are much easier to implement today through a mutual fund or in a separate account structure than it was 20 years ago. North America—that is, Canada and the United States—accounts for approximately 28 percent of global gross domestic product (GDP).1 That means that 72 percent of GDP comes from other regions. That fact alone should provide enough fodder to drive any manager to diversify a portfolio globally.
When striving for consistent long-term results, it is imperative to utilize all possible levers. By opening the portfolio borders, you give yourself a fighting chance for success. This is witnessed in monthly total returns between the Barclays Capital U.S. Aggregate index and the Barclays Capital Global Aggregate index ex-USD. Figure 7.3 shows a low correlation between the two. In the period beginning in 2005, these indexes carry a 58 percent correlation, even with the globalization of economies and growing intertwined markets. This low correlation is usually a welcome feature when you are looking to diversify. In the chart there are times when the two indexes move in similar fashion. It is also clear that the global markets do not always move in tandem with the U.S. market. Geopolitical events and different business cycles are two of many drivers that usually have a hand in creating different results.

FIGURE 7.3 Correlation between Barclays Global Aggregate Index ex-USD and the Barclays Capital Aggregate Index.
Source: Barclays Capital Index data.
Ultimately, the purpose of asset allocation is to reduce risk within your portfolio. Different combinations of assets or sectors will attempt to provide different results through the changing market environments. Asset allocation is as simple as investing in multiple asset classes that, over time, have provided low correlation to one another. Cash, stocks, and bonds are the most basic way to diversify through asset allocation. It shouldn't stop at this level. Today's investing environment allows investors to achieve an even greater mix of assets through specialty mutual funds or unique separate account strategies.
Here is a simple yet effective example of how risk may be reduced not only through investing with different asset classes, but if taken yet another step in an attempt to further reduce risk within an asset class. The agency sector is one that many investors probably don't give the proper time of day in preparation for placing a trade. It is a known fact is that this sector carries the implied guarantee of the U.S. government. For some investors, the analysis may stop there because these securities carry that implied government guarantee. I disagree with that approach. Remember, the government has the ability to change the rules whenever it feels it is necessary. At any point in time, it can phase out or modify the implicit guarantee. A phase-out is probably not likely to happen without proper warning. Even with warning, once that news hits the tape, the sector will underperform as spreads blow out. The news doesn't have to be this drastic to cause headaches for investors within the sector. Headlines as simple as minor restructuring or increased regulation have the ability to create a nervous buzz that could impact the sector.
I will focus on the three primary, well-known companies that issue debt within the sector: Fannie Mae, Freddie Mac, and the Federal Home Loan Bank (FHLB). The agency sector historically trades with a tight spread over and above the U.S. Treasury sector. In “normal” market conditions, the spread or additional yield over comparable Treasury for the 10-year agency may fall between 25 and 65 basis points (bps). The Bloomberg Fair Value 10-year index shows an average spread of 55 bps from January 2000 through December 2011. It is difficult to classify what is normal, because a turbulent environment appears to have prevailed over the past 10 years. Turbulence and uncertainty don't have to be present within the sector. Direct or indirect uncertainty affects the spread and price action within the sector. The market doesn't play favorites, but investors do. The outcome within the sector isn't always the same for each security—in this case the agencies. Historically, the spreads of the three primary agency issuers trade within a narrow margin of each other. This isn't always the case. The details that surround the company's book of business, or exposure and the support for their debt, are key drivers for how the issued debt will perform. Varying circumstances, positive or negative, create different opportunities as well as price action.
Investors within this sector have had to wrestle with the ongoing balance sheet concerns of Fannie Mae, Freddie Mac, and the FHLB. Investors have focused more heavily on Fannie Mae and Freddie Mac due to their structure. Complicating matters is the continual threat of the government removing the implied guarantee that investors demand. If the government pulled its implied guarantee, there would be severe ramifications to the sector. Fannie Mae and Freddie Mac are perceived to have the closest ties to the government and would be impacted the hardest if the aforementioned events occurred (that is, with all else being equal). The FHLB might not be as affected due to its structure, with 12 regional federal home loan banks that are each supported by one another through a cooperative ownership.2 This is a key difference from the other agencies. The ownership structure is looked at as additional support. Proper analysis would view the ownership structure as the primary piece and the governmental support the backup or additional layer of comfort. If problems arise within the agency sector, the FHLB debt will likely underperform in sympathy. As headlines rock the agency sector, pushing spreads wider and prices lower, the increased support and structural differences help the securities' overall performance. This would be one of those situations where I would look to add exposure on a dislocation. Similar to the corporate sector, different securities within the agency sector may perform differently.
Over the past three years, the threat of imminent default was not a concern with any of the aforementioned issuers. Investors have had to deal with reduced liquidity and wider bid-ask spreads. Wider bid-ask spreads and reduced liquidity helped formulate my opinion about the sector. When I was involved in the sector over the past few years, I regularly favored the FHLB over the other issuers. At times, I may have had exposure elsewhere, as the goal was to find the relative value and diversify within the sector.
Just remember that regardless of the shape of the yield curve or the sector allocation, the landscape and need for asset allocation are always evolving. The lesson learned over the past few years is that all markets are intertwined with each other in more ways than are imaginable. Not only does the financial system need to be healed, but so do the balance sheets of corporations and households alike.
For these reasons and many others, a broader view of the fixed income market needs to be taken, capturing a variety of metrics broad enough—yet acutely interrelated—to provide an accurate representation. Instinct will always play a key role in assessing the market, although proper tools will provide an edge. This edge will help dissect the key components within the fixed income market. The technical view will remove the emotional aspect of investing, allowing the data points to be looked at as just that: data points. These raw data will then be used in conjunction with fundamental analysis and instinct to help anticipate the ever-evolving fixed income landscape and remain ahead of the curve.
1USDA Economic Research Service, “International Macroeconomic Data Set,” updated July 5, 2012, http://www.ers.usda.gov/data-products/international-macroeconomic-data-set.aspx.
2FHL Banks homepage, www.fhlbanks.com.