
CHAPTER 5
QUALITY MANAGEMENT IN SERVICE
“It is important for a firm to manage service quality well, but it is critical for it to manage service failures even better.”
INTRODUCTION
After discussing the nature of service and relationship quality in Chapter 4, We now turn to various models for the management of quality in service contexts. In this chapter the gap analysis framework and other holistic models for service quality management are discussed. The tolerance zone concept and the shape of the quality function are also described. Then quality management is considered at some length, in situations where a service failure or another problem has occurred. Service recovery, as opposed to traditional complaints handling, as well as elements of a service recovery process, are discussed. In addition, the timing of service recovery and various timing strategies are put forward. After having read the chapter the reader should understand how quality can be managed in service; for example, by using the gap analysis approach and following a quality development structure, and he should know how service recovery should be taken care of in situations where a service failure has occurred.
WHY MANAGERS HESITATE TO INVEST IN SERVICES AND SERVICE QUALITY
Managers often believe that developing and offering services with 100% quality is impossible. Consequently, the organization accepts that mistakes happen, and failures are allowed. Psychologically, the battle for excellent performance is over before it has even begun.
Tom Gillett, when Director of Services of the telecommunications firm GTT, used to tell his employees the following anecdote when they argued that in the complex telecommunications business top quality could not be achieved and thus could not be offered to their customers: ‘Imagine a large international airport with hundreds of take-offs and landings each day. If they accepted a quality level of 99%, they would have a number of accidents every day. That just cannot be allowed to happen. And can you imagine a more difficult and technically complicated service and service production system than that of an airport?’ The conclusion is, of course, that if an airport can offer and maintain a 100% quality level, you can do it as well, whatever your business is.
Saying and perhaps even believing that a particular firm’s service is so complex and difficult that to produce that top quality cannot be achieved is just an excuse for not trying hard enough. True, hard work and long-term effort may be required, but it is never impossible.
SOME REASONS WHY QUALITY IMPROVEMENT PROCESSES FAIL
In spite of the obvious benefits of improving quality, many firms that have implemented quality programmes feel that it did not pay off. Normally, the problem is in a firm’s approach to quality improvement. If it is only considered as a project, if a limited time frame is given to the effort, and it is perceived by everybody in the organization, top management and all other employees alike, as simply a tactical issue, the risk of failure is high. For some managers, quality improvement is a matter of time-and-motion studies or investment in machinery or equipment that allows the firm to reduce its labour force. For others, it means a training programme, or introducing a new monetary reward system.
While all these elements can be part of a quality improvement process, as isolated activities they are bound to fail in the long run. The main problem is in the approach. Quality development must not be considered as a project, or even worse as a campaign, but has to be an ongoing process. A continuous appreciation of the importance of quality and an understanding of how to influence good service quality is required of every individual in the organization, and this has to be constantly reinforced by management. Quality, and hence quality improvement and quality management processes, are strategic issues, which require continuous attention by top management.
HOW GOOD SHOULD QUALITY BE?
A question that is often asked is how good should the optimal quality of a given service be? First of all, the answer depends on the strategy of the firm and the expectations of the customers for whom its service is intended. And these two factors are dependent on each other. A service provider, where the strategy is to be the best on the market and cater to customers demanding excellent service, should first create such expectations among its potential customers, and second provide a service quality that is perceived as excellent. The strategy of another firm may be to provide a less demanding target group of customers with service of a lower quality, at a lower price. In this case, the level of service quality can be lower, but the expectations that the customers are given should not deviate from the real level of quality. If, in this situation, expectations and experiences meet, the perceived quality is still good.
There is an often-mentioned ground rule that customers should be surprised by getting a little bit more than they expect. Acceptable quality (confirmed quality where expectations are met but no more) satisfies a customer but does not necessarily make him feel that this is a relationship with a service provider that must not be broken. It does not make the customer talk about his experiences to friends, neighbours and business associates, and write positive comments in social media. Perceived quality which exceeds expectations to some extent, which is sometimes also called customer delight, may make customers more interested in continuing the relationship with the service provider, and this also creates good word-of-mouth benefits. The positively surprised customer remembers the experience and often likes to talk about it.1
Critics of this ground rule argue that customers learn from their experiences and the next time their expectations are higher. This will lead to an upward spiral where the firm in the end cannot, profitably at least, produce a quality level that meets the increased level of expectations. However, surprising customers does not necessarily mean providing them with something that raises expectations. Normally the surprise effect can be achieved by a small gesture that does not cost anything and leads to a similar positive feeling on the part of the customer every time. It is also important to note that customers’ expectations can be exceeded and customers can be surprised regardless of the level of the quality of a given service. The same positive effects on loyalty and on word of mouth can be achieved by small surprises in situations where the level of service quality is low. It does not matter whether the level of expectations is high or low or in between.
Service providers should not, however, provide customers with a surprising effect once, and then revert to a previous quality level. Rust and Oliver call this ‘hit-and-run delight’.2 According to them, a firm which does this will be worse off than if it had not, because a one-time rise in quality experience will increase expectations, and the next time customers will be dissatisfied. Dissatisfaction causes more negative effects than the positive effects created by one-time surprise. However, when a higher level of experiences is constantly offered, customers may forget the surprise element from one occasion to another. The surprise-creating element may be remembered, but the feeling of surprise it causes is not. Then the same feeling of surprise can be repeated again, and the same positive quality effect be achieved every time.3
MANAGING SERVICE QUALITY: THE GAP ANALYSIS APPROACH
Berry, Parasuraman and Zeithaml have developed what they call a gap analysis model, which is intended to be used for analysing sources of quality problems and for helping managers understand how service quality can be improved.4 The model is illustrated in Figure 5.1.
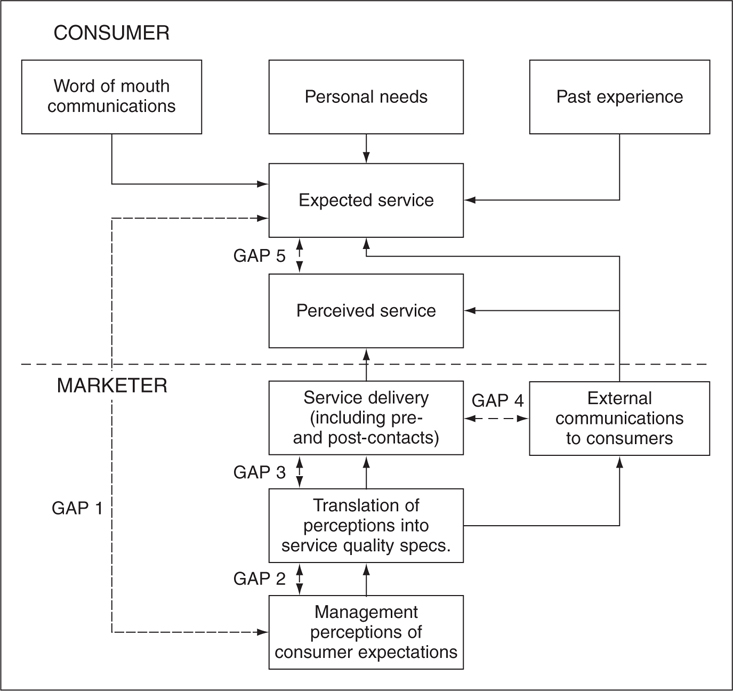
FIGURE 5.1
The gap analysis model of service quality.
Source: Parasuraman, A., Zeithaml, V.A. & Berry, L.L., SERVQUAL: a multi-item scale for measuring consumer perceptions of service quality. Journal of Retailing, 64(1); 1988: p. 36. Reproduced by permission of the New York University.
First of all, the model demonstrates how service quality emerges. The upper part of the model includes phenomena related to the customer, while the lower part shows phenomena related to the service provider. The expected service is a function of the customer’s past experience and personal needs and of word of mouth communication from various channels. It is also influenced by the firm’s market communication.
The service experienced, which in this model is called the perceived service, on the other hand, is the outcome of a series of internal decisions and activities. Management perceptions of customer expectations guide decisions about service quality specifications to be followed by the organization, when service delivery (the execution of the service process) takes place. The customer, of course, experiences the service delivery and production process as a process-related quality component (creating a functional quality impact), and the technical solution received by the process as an outcome-related quality component (creating a technical quality impact). As is illustrated, marketing communication can be expected to influence the perceived service as well as the expected service.
This basic structure demonstrates the steps that have to be considered when analysing and planning service quality. Possible sources of quality problems can then be detected. In Figure 5.1 five discrepancies between the various elements of the basic structure, so-called quality gaps, are illustrated. These quality gaps are the result of inconsistencies in the quality management process. The ultimate gap – that is, the gap between expected and experienced (labelled ‘perceived’ in the model) service (Gap 5) – is, of course, a function of the other gaps that may have occurred in the process. The five gaps, their consequences and implications for management, and the reasons why they occur are discussed in the next section.
MANAGING THE QUALITY GAPS
THE MANAGEMENT PERCEPTION GAP (GAP 1)
This gap means that management perceives the quality expectations inaccurately. This gap is due to:
• Inaccurate information from market research and demand analyses.
• Inaccurately interpreted information about expectations.
• Non-existent demand analysis.
• Bad or non-existent upward information from the firm’s interface with its customers to management.
• Too many organizational layers, which stop or change the pieces of information that may flow upwards from those involved in customer contacts.
There may be various cures. If problems are due to bad management, obviously either a change of management or an improvement in the knowledge of the characteristics of service competition on the part of management is required. Probably the latter action is more appropriate, because normally the problems have not occurred because of a genuine lack of competence but rather because of a lack of knowledge or appreciation of the nature and demands of service competition and service management among managers.
Part of any cure is always better research, so that the customers’ processes and their needs and wishes are better observed and appreciated. The information obtained through market research and from internal flows of information from the customer interface is perhaps not good enough or only partly appropriate. New methods to gain deeper insight about the customers and their lives and businesses may be needed, and better ways of using customer feedback from service encounters or customer complaints systems may be required.
THE QUALITY SPECIFICATION GAP (GAP 2)
This gap means that service quality specifications are not consistent with management perceptions of quality expectations. This gap is a result of:
• Planning mistakes or insufficient planning procedures.
• Bad management of planning.
• Lack of clear goal-setting in the organization.
• Insufficient support for planning for service quality from top management.
Depending on the size of the first gap, the potential planning-related problems vary. However, even in a situation where there is enough and sufficiently accurate information on customer processes and expectations, planning of quality specifications may fail. A fairly normal reason for this is a lack of real commitment to service quality among top management, because quality is not considered an issue of highest strategic priority. An obvious cure in such a situation is to change a firm’s priorities. Quality as perceived by customers is such a vital success factor today, certainly in service competition, that it is imperative that commitment to quality ranks high on management’s priority list.
Of course, the problem may be in the planning process itself. Those providing service also have to feel a commitment to the quality specifications. This has to be taken into account in goal-setting and planning routines. Planning from the top without the collaboration of those who actually produce the service should be avoided. Ideally, goals and specifications should be agreed upon by the service providers as well as by the planners and management. Also, it is good to remember that too-rigid specifications damage flexibility and decrease the willingness of employees to take flexible actions involving risks. And again, this usually damages service quality.
In summary, commitment to service quality among management as well as service providers is far more important in closing the quality specification gap than any too-rigid goal-setting and planning procedure.
THE SERVICE DELIVERY GAP (GAP 3)
This gap means that quality specifications are not met by performance in the service production and delivery process. This gap is due to:
• Specifications that are too complicated and/or too rigid.
• Employees not agreeing with the specifications and therefore not fulfilling them.
• Specifications not being in line with the existing corporate culture
• Bad management of service operations.
• Lacking or insufficient internal marketing.
• Technology and systems not facilitating performance according to specifications.
The possible problems here are many and varied, and normally the reasons for the existence of a service delivery gap are complicated. There is seldom only one reason, and the cure is, therefore, usually complicated. The reasons for this gap can be divided into three categories: management and supervision, employee perception of specifications and rules/customer needs and wishes, and lack of technological/operational support.
Management- and supervision-related problems may also be varied. For example, supervisors may not be encouraging and supportive of quality performance, or the supervisory control systems may be in conflict with good service or even with quality specifications. In any organization where control and reward systems are decided upon separately from the planning of quality specifications, which is the case far too often, there is an inherent risk of a service delivery gap occurring. And this risk is not small. Too often non-essential or unimportant activities are controlled, perhaps even rewarded; and activities that contradict quality specifications are encouraged by the control system. They too may even be rewarded. Of course, this puts employees in an extremely awkward position. Control and reward systems partly determine the corporate culture, and goals and specifications that do not fit the existing culture tend not to be well executed. The cure here involves changes in the way managers and supervisors treat their employees, and in the way supervisory systems control and reward performance. Larger issues related to the culture of the firm and internal marketing may also have to be attended to. We will return to the issues of internal marketing and service culture in Chapters 14 and 15.
From what has been discussed above it follows, among other things, that employees may feel that their role as service providers is ambiguous. We have already mentioned the way in which performance requirements of the specifications, on the one hand, and existing control and reward systems, on the other hand, are in conflict with each other. An awkward situation could also occur for personnel when a customer contact person realizes that a customer requires different behaviour on the part of the service provider than what the company’s existing specifications allow. The customer contact employee knows that the customer is not getting what he expects and may feel that the demands and wishes of the customer are justified and perhaps could be fulfilled, but he is not allowed to perform accordingly. This slowly but surely kills any motivation for quality-supporting performance among the service employees.
The cure in situations like these is to remove all reasons for ambiguity on the part of the personnel. This may, on the one hand, require changes in the supervisory systems so that they are in line with the quality specifications. It may, on the other hand, also require better employee training, so that they are aware of the limitations for performance due, for example, to strategic considerations or profitability reasons. Here again the issue of internal marketing is critical.
Further, the skills and attitudes of personnel may cause problems. It may be that the wrong people have been recruited in the first place. The firm may have people who cannot adjust to the specifications and systems that guide operations, however justifiable they are. The cure in this situation is, of course, to improve recruitment processes so that poor decisions can be avoided. Furthermore, the workload perceived by employees may be a problem. There may, for example, be too much paperwork or too many other administrative tasks involved, so that quality specifications cannot be fulfilled. Because of this, the service provider does not have time to attend to customers as expected.
The cure is to clarify the tasks of all personnel and find a solution where necessary tasks are dealt with without interfering with quality performance. Finally, problems may be caused because the technology or the systems of operating, including decision-making and other routines, cannot be successfully used by the employees. The problem may be the employees, of course, but it is more probable that technology and operational and administrative systems have been introduced in the wrong way. Perhaps technology and the company’s systems do not support quality behaviour, or they have not been properly introduced to the employees who are expected to live with them. The remedy is either to make proper changes to technology and systems so that they are supportive of the execution of the quality specifications or, again, to improve training and internal marketing.
THE MARKET COMMUNICATION GAP (GAP 4)
This gap means that promises made by marketing communication are not consistent with the service delivered. This gap is due to:
• Marketing communication planning not being integrated with service operations.
• Lacking or insufficient co-ordination between traditional external marketing and operations.
• The organization failing to perform according to specifications, whereas marketing communication campaigns follow these specifications.
• An inherent propensity to exaggerate and, thus, promise too much.
The reasons for the occurrence of a market communication gap can be divided into two categories, namely, the planning and executing of external marketing communication and of operations, and a company’s propensity to overpromise in sales and marketing communication.
In the first case, the cure is to create a system that coordinates planning and execution of external marketing communication with service operations. For example, every major campaign should be planned in collaboration with those involved in executing the service process. Two goals can be achieved by this. First, promises in marketing communication become more accurate and realistic. Second, a greater commitment to what is promised in external campaigns can be achieved, which also has the effect that more can be promised than would otherwise be the case.
The second category of problems, overpromising because of the very nature of marketing communication and sales where superlatives are far too easily used, can only be dealt with by improving planning of marketing and sales tasks. The cure may be better planning procedures, but closer management supervision also helps.
THE PERCEIVED SERVICE QUALITY GAP (GAP 5)
This gap means that the perceived or experienced service is not consistent with the expected service. This gap results in:
• Negatively confirmed quality (bad quality) and a quality problem.
• Bad word of mouth and negative comments in social media.
• A negative impact on corporate or local image.
• Lost business.
The fifth gap may, of course, also be positive, which leads either to a positively confirmed quality or overquality. If a perceived service quality gap occurs, the reason for this could be any of those discussed in this section, or any combination of these. Of course, there may also be other reasons in addition to those mentioned here.
The gap analysis model should guide management in finding out where the reason or reasons for the quality problem lie and in discovering appropriate ways to close this gap. Gap analysis is a straightforward and appropriate way of identifying inconsistencies in the market research, service process planning and execution, and external communication about the service. Addressing these gaps is a logical basis for developing service processes in which expectations and experiences consistently meet. In this way the likelihood of good perceived service quality will be increased.
MANAGING TOLERANCE ZONES
According to the perceived service quality model’s disconfirmation concept – customers’ experiences are compared with their expectations – customers’ expectations of the level of a given service attribute are thought of and measured as one singular level of expectation. No variation in expectations is included. The zone of tolerance concept has been suggested by Berry and his colleagues,5 because they considered the underlying assumption of this concept too simplistic.
The zone of tolerance concept assumes that customers do not have expectations of a service attribute on one given level. Rather, they can tolerate a variation in the real experiences and still consider them acceptable according to their expectations. This concept implies that customers’ expectations exist on two levels, a desired level and an adequate level. The desired level reflects on what level the service should be, whereas the adequate level is what customers believe it could be. The latter level is the least acceptable level of the service experience. These two levels of expectations form the borders of customers’ zones of tolerance. If the real experiences of a customer fall in between these borders, they are tolerated by him and the perceived quality is considered good.
The zone of tolerance can of course vary from customer to customer, and from service attribute to service attribute. It may also, for a given customer, vary from time to time. It is suggested that, in general, it is narrower for outcome-related service features and broader for process-related features. This means that customers generally tolerate more variation in the process (expectations related to the functional quality dimension) than in the outcome of the process (expectations related to the technical quality dimension). In addition, if there is a service failure which has to be corrected, the zone of tolerance diminishes, regarding both outcome-related and process-related service features.
Measuring the zones of tolerance of expectations and comparing them with the experiences of customers may give management useful information about where service quality problems exist, and where there is no need for immediate action. For those attributes where the experience measurement falls in between the desired and adequate levels of expectations, the level of perceived service quality is at least tolerable. Again, for those attributes where the experience measurement is lower than the adequate level, immediate corrections may be required, so that the overall level of perceived service quality does not decrease. It is of course more urgent to take action if such an attribute is considered central to customers’ quality perception, than if its impact is only marginal.
THE SHAPE OF THE QUALITY FUNCTION
In the service quality models it is normally assumed that the quality function is linear; that is, as the performance of a service provider improves, the perceived quality increases at the same pace, and vice versa. In Figure 5.2 this assumption is illustrated at the left of the figure. In reality, this relationship varies between customers and between quality attributes, and probably also between one customer’s perception of different service encounters. However, the quality function is probably not linear at all.6
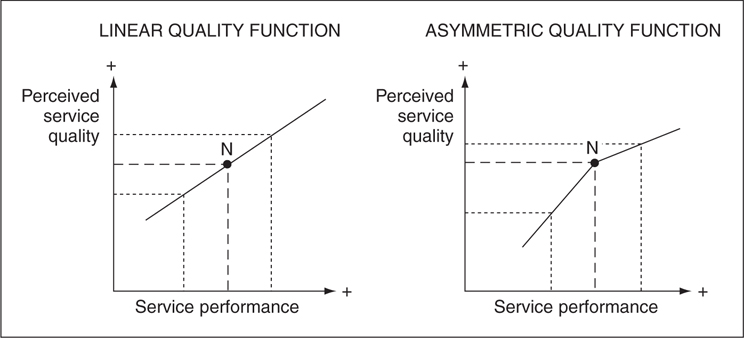
FIGURE 5.2
Linear and asymmetric quality functions.
Source: Expanded from Strandvik, T., Tolerance Zones in Perceived Service Quality. Helsinki: Hanken Swedish School of Economics, Finland, 1994, p. 154. Reproduced by permission of Tore Strandvik, Hanken Swedish School of Economics.
At the right of Figure 5.2 a typical quality function is illustrated. When the service firm performs better than normal (denoted by the letter N in the figure), perceived service quality increases at a lower pace than it decreases when the firm performs below its normal level. This asymmetric shape of the quality function7 means, among other things, that it is easier to make a bad impression when quality deteriorates than it is to please a customer with quality above the normal expected level. Another conclusion is that it is dangerous for a service provider to let its overall performance, or performance on some critical attributes, drop below normal expectations, because the quality perception then decreases quickly. On the other hand, it is difficult to increase the quality perception above normal, because the service performance has to be improved (relatively speaking) much more to lead to significant results. As the figure demonstrates, a given increase in service performance has a much smaller effect on the perceived service quality than does a similar decrease.
For example, if an Internet shop responds to a customer’s inquiry or order more slowly than this customer considers normal, speeding up the response time can be expected to have a rapid impact on the perceived quality. However, improving perceived quality by answering even faster than this normal level will have a much smaller impact on the customer’s quality perception.
Another assumption that is often made in the literature is that all quality attributes are equally important. However, there may be a clear distinction between the effects on perceived quality of different attributes. Again, there is probably a difference between customers and between various types of services, but generally it seems as if different attributes have a different impact on the quality perception. The main thing is that some attributes may be necessary for a good perception of service quality, but if they are improved then this does not have a significant positive effect on perceived quality. Reliability, functionality and competence could be examples of such hygiene factors. A hygiene factor must be on a given level, otherwise quality is perceived as low, but increasing the level of a hygiene factor does not improve the quality perception.
Other quality attributes may be quality-enhancing factors, where a higher level of performance has a positive effect on the quality perception, whereas there is no significant additional negative effect once it has reached a certain low level. Friendliness, attentiveness, cleanliness and availability could be examples of such attributes. Improving such quality-enhancing factors above a minimum level improves the perception of service quality. There may also be quality attributes that influence perceived quality both ways. Comfort, communication and courtesy could be examples of such attributes.8
For example, the reliability of an airline assuring a passenger that he will arrive at the destination on time is an essential hygiene factor. Delays have major negative effects on quality perception. Arriving ahead of time probably has limited positive effect. On the other hand, the friendliness and attentiveness of the in-flight personnel and the cleanliness of restrooms are quality-enhancing factors that linearly increase the quality perception. However, when they have reached a certain low point, passengers will have become so frustrated or annoyed that an even worse performance will not further decrease their quality perception.
Another related way of studying quality attributes is to divide them into satisfiers and dissatisfiers.9 According to a major study in the banking industry in the UK,10 attentiveness, care and friendliness are examples of predominantly satisfying determinants. Good performance on such determinants causes an increase in perceived service quality, whereas poor performance below a certain expectations level does not necessarily have a further damaging effect on quality. Integrity, reliability, availability and functionality are examples of dissatisfiers. Good performance above a certain expectation level on such attributes does not increase the perceived service quality, whereas poorer performance has a negative effect on quality.
In this study responsiveness was found to be both a satisfier and dissatisfier. This is a crucial observation, because this quality attribute is often considered to have a decisive impact on satisfaction with quality. The different ways satisfiers and dissatisfiers work are illustrated in Figure 5.3. On the left one can see how changes in the performance level of satisfiers impact perceived quality, whereas the reverse effects of dissatisfiers are shown. The normal expected level of quality attributes is denoted by the letter N.
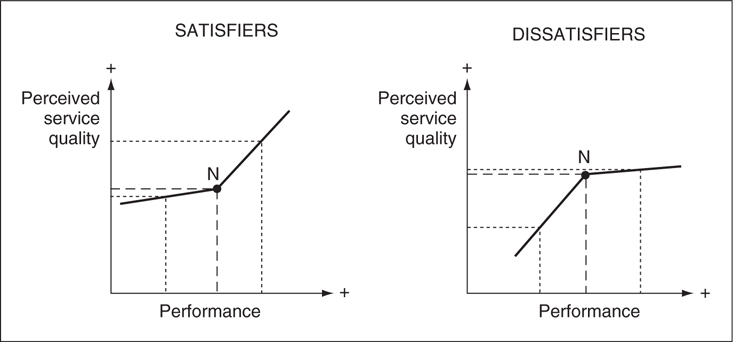
FIGURE 5.3
Service quality attributes: the effects of satisfiers versus dissatisfiers.
The research results reported in this section are somewhat contradictory, which may be a result of cultural or industry differences or different ways of measuring quality. However, it is important for managers responsible for service quality to bear in mind that various quality attributes or factors may function in different ways. The examples mentioned are relevant for some service and some customers, and function in this way in some cultures, but in other cases other attributes may function as hygiene, quality-enhancing or two-way factors, and as satisfiers or dissatisfiers. Investing in further improvement of hygiene factors and neglecting investments in quality-enhancing or two-way factors, or investing in dissatisfiers above the acceptable expectations level, are clearly ineffective strategies and a waste of money. Such investments are, however, easily made, if one does not have a clear picture of the quality-influencing nature of various quality attributes.
LESSONS OF SERVICE QUALITY AND QUALITY MANAGEMENT RESEARCH
The models and frameworks of customer perceived service quality and how to manage service quality presented in this chapter demonstrate a number of important lessons learned from research into service quality. Some of these issues have also been focused on in studies of good quality management. The lessons are as follows.
Quality is what customers perceive. Quality cannot be determined by management alone; it has to be based on customer needs, wishes and expectations. Moreover, quality is not what is planned in objective measures; instead it is how customers subjectively perceive what is delivered.
Quality cannot be separated from the service process (the service production process). The outcome of the service production process is only part of customer perceived service quality (the technical quality dimension). The service process itself is perceived by customers who also actively participate in this process. Therefore, the perception of the process and of the buyer–seller interactions or service encounters of this process becomes another part of total quality (the functional quality dimension). From a competitive point of view, functional quality is frequently equally important as, or even more important than, technical quality of the outcome.
Quality is produced locally in a series of moments of truth of service encounters or buyer–seller interactions. Because of the existence of the important functional quality dimension of total service quality, the service encounters, including a number of moments of truth (or moments of opportunity) become a pivotal factor in quality perception. Since service encounters take place locally, where the customer meets the service provider, and not in centrally located quality design and planning departments, perceived quality is also produced locally. Therefore, the planning and design of quality has to move out to the local level. Technical quality aspects and the overall design of how to create quality can, of course, be planned centrally, but the interface between the organization and its customers has to be involved in quality management and design as well. Otherwise, well-designed quality may remain a desk product that does not materialize in good customer perceived quality.
Everyone contributes to customer perceived quality. As quality is created and produced in buyer–seller interactions of service encounters, a large number of employees become involved in the production of quality. Since these customer contact employees who handle customer contacts in order to serve their customers well are dependent on the support of people beyond them in the service process, these ‘support’ people also become responsible for the ultimate customer perceived quality. Hence, most employees contribute to quality. If someone in the customer services department or beyond the direct customer interface fails, quality suffers.
As co-producers in service processes customers have to be managed as a quality-producing resource. A central characteristic of services is the fact that customers participate as co-producers in the service production process. In that capacity they can influence both the process and its outcome, and hence, their own as well as fellow consumers’ perception of quality. Therefore, the firm should guide the customer through the production process so that he does not, by mistake or because of a lack of knowledge or motivation, behave in a way that has a negative impact on quality. Customers may have to be informed about what is required of them and motivated to act in a certain manner. Sometimes customers may even have to be trained to make a positive contribution to quality.
Quality has to be monitored throughout the organization by the whole organization. As quality is produced by a large number of people and departments throughout the organization, quality performance has to be monitored and assured at the point where a quality contribution is produced. A centrally located quality control and management staff cannot normally do this. The task is overwhelming; and having a separate department for this has a negative effect psychologically on the people in the organization. The mere fact that such a department exists can easily draw the attention of those producing quality away from quality assurance. It is easy for other employees to stop worrying about the tricky issue of constantly producing, maintaining and monitoring quality when there is a group of specialists to turn to, and to blame when problems occur. In the final analysis, the organization itself has to do the job of assuring quality.
External marketing has to be integrated into quality management. Customer-perceived quality is a function of expectations as well as of real experiences. Therefore, improvement of quality experiences may be counteracted by, say, a marketing campaign that gives customers reason to believe that improvements will be greater than they really are. Customer expectations which are not met by reality will be created. The perceived quality will be bad, although quality improvements, objectively measured, may have taken place. Such negative external marketing effects may have far-reaching consequences, for example, because this creates negative publicity and the image of the firm may be damaged. If marketing campaigns are planned in collaboration with those responsible for the quality improvement process, these mistakes can be avoided. Hence, external marketing, marketing communication and sales have to be integrated with quality management.
A SERVICE QUALITY MANAGEMENT PROGRAMME
In this chapter we have discussed concepts and models of perceived service quality, in order to develop an understanding of how service quality is formed and perceived by customers, as well as an understanding of how important aspects of service quality can be managed. In the present section we will sum up these concepts and models in the form of a management-oriented service quality management programme. This programme is intended to help management implement a service strategy to respond to the challenges of the constantly increasing service competition. If the organization has decided to pursue a service strategy, the service quality management programme should, for managerial purposes, give adequate guidance in what to do. Such a programme must, of course, be grounded in sufficient insight about target customers’ everyday processes and goals, and about their needs and expectations.
The service quality management programme consists of seven subprogrammes. These are:
Service concept development.
Customer expectations management programme.
Service outcome management programme.
Internal marketing programme.
Physical environment (servicescape) and physical resources management programme.
Information technology management programme.
Customer participation management programme.
These will now be described separately in more detail.
Service concept development. The establishment of customer-oriented service concepts which guide the management of resources and activities to be used in the service process is, of course, the first task in the service quality development process. The service concept must clearly indicate the intended customer benefits.
Customer expectations management programme. Traditional external marketing and sales activities should never be planned and implemented in isolation. They should always be related to the experiences the service provider is willing and able to provide to its customers. Otherwise, there will always be a quality problem, irrespective of the other quality development subprogrammes. Therefore, managing customer expectations must always be an integral part of any quality programme. This makes, for example, managing external marketing communication and sales part of quality management.
Service outcome management programme. The outcome of the service process (i.e. what customers get as a technical quality of the service) is part of the total service experience. The outcome of the service production process has to be developed and managed according to the service concepts agreed upon, and the specific needs of the target customers.
Internal marketing programme. As we have demonstrated, the functional quality of the process (i.e. how the service process is perceived by customers) is the key in most cases to an excellent service quality and to achieving a winning competitive edge. Most frequently this quality dimension is predominantly due to the courtesy, flexibility and general service-mindedness of the customer contact employees, and to their ability and willingness to perform in a customer-focused fashion. Hence, the employees, customer contact employees, managers and other employee categories, have to be considered a first, internal market of the service provider. A continuous and strategically backed up internal marketing process is, therefore, a vital part of any quality development and management program. (Internal marketing will be discussed in detail in Chapter 14.)
Physical environment (servicescape) and physical resources management programme. The physical resources, technology and computing systems of service organizations are too frequently developed according to internal efficiency standards. The external effects of, for example, a computer system failure are seldom taken into account to a proper degree. Consequently, these resources, which constitute a technology base for service production as well as the physical environment for service consumption, may have a negative impact on customers’ perception of the service process. Hence, a physical environment and physical resources management programme should be part of an overall quality programme, to support the functional quality perception.
Information technology management programme. Customers make increasing use of information technology-based systems; for example, using a website on the Internet to get access to information, feedback or support from a service firm, to making purchases on the Internet or to use Internet and mobile applications as part of a service process. Therefore, the service provider must invest in appropriate information technology and must upgrade software and hardware as technology and applications advance. Hence, an information technology management programme is required. This is needed to secure both a good technical quality and functional quality impact.
Customer participation management programme. Customers should be advised how to act in the service process, so that they have a favourable impact on the process themselves. Especially functional quality, but sometimes also technical quality, can be destroyed by customers who either do not know what to do or do not want to perform according to the service provider’s intentions. Negative effects of fellow customers, causing queues, for example, must also be avoided, if possible. Eliminating unfavourable effects on the service process of a misfit between customer segments and individual customers is also part of a customer participation management programme.
SERVICE RECOVERY: MANAGING QUALITY WHEN SERVICE FAILURES OCCUR
The real test of the customer orientation of a service provider takes place when a service failure has occurred. Ideally, quality should be high all the time and failures should not occur. However, employees make mistakes, systems break down, customers in the service process may cause problems for other customers, or a customer may not know how to participate in the process or may change his mind regarding some aspect of the service during the process. As a consequence, the planned service process will not lead to a good result for the customer. The intended level of quality is not achieved. It is important to realize that such a failure does not always result from mistakes made by the service provider; the customer or fellow customers can also cause service failures. However, regardless of whether the firm, the customer, or something else is to blame, every problematic situation for a customer is an opportunity for the service provider to demonstrate its commitment to service.
Hence, regardless of the reason for a failure, the service provider has to take care of the situation and is responsible for solving the problem in a way that satisfies the customer. Unless this is done, the customer will feel that he received poor quality, and the risk of losing that customer grows. Or, if complaining customers feel that their complaint is not handled quickly enough and with enough attention and empathy, the quality of the whole relationship will deteriorate. If there is a quality problem in the service process, the recovery of the problem has to be performed very carefully and accurately.11 Research shows that service providers are often offered a second chance to create a positive quality perception by customers even though a service process has broken down.12 The way a firm manages service recovery forms a platform for strengthened or weakened customer relationships. A well-managed recovery has a positive impact on the development of a trusting relationship between a firm and its customer and it also may deepen the customer’s commitment towards the service provider.13
As discussed in the previous chapter, service recovery is a factor influencing perceived service quality. It is a process-related service criterion that can have a positive effect on functional quality. After a good recovery, satisfaction with services can be increased.14 It has even been claimed that good service recovery can make angry and frustrated customers more satisfied with service quality than they would have been if no problem had occurred in the first place.15
SERVICE RECOVERY VERSUS COMPLAINTS HANDLING
Service recovery is a concept that was introduced in the service management literature to help firms manage service failures and complaints in a service-oriented way.16 The traditional way of handling service- or goods-related failures is complaints handling, where customers who have experienced problems are requested to make formal complaints. Such complaints are analysed and handled by the firm usually following legal and administrative procedures. Frequently it seems as if the objective of complaints handling is to make sure that, regardless of who caused the failure, the firm does not have to compensate the customer unless absolutely necessary. Complaints handling has a significant effect on customers’ perception of the service orientation of a service firm or a manufacturer, and the complaints-handling approach is inherently non-service-oriented. Service recovery is a service-oriented approach to managing the same situations that, in an administrative way, are managed by complaints-handling routines.
For traditional complaints handling internal efficiency, keeping costs as low as possible and not compensating a customer unless this cannot be avoided for legal reasons, seems to be the standard. The result is unsatisfied customers and lost business. For service recovery external effectiveness, good perceived quality, is the main guideline. The objective of service recovery is to satisfy customers in spite of a service failure as well as to maintain and possibly improve long-term relationship quality, to retain customers and long-term profitable business rather than short-term cost savings.
Tax and Brown17 define service recovery in the following way:
Service recovery is a process that identifies service failures, effectively resolves customer problems, classifies their root cause(s), and yields data that can be integrated with other measures of performance to assess and improve the service system.
Customer problems caused by a service failure or some other problem are usually twofold; factual problems and emotional18 problems. Both have to be attended to by the firm.
In a problematic situation when service recovery is called upon, customers are often frustrated and also tend to have a narrower zone of tolerance than normal.19 Service recovery may therefore be risky.20 It has to be managed well. It seems that the more committed the employees of a firm feel to the firm’s visions, strategies and service concepts, the better their service recovery performance will be. Moreover, employees who are empowered to make independent decisions can be expected to do better in recovery situations; they are inclined to deal quickly and effectively with service failures.21 It is important that customers who have suffered from a service failure or some other mistake in the service process feel that they are treated fairly by the firm. The service recovery process should therefore be developed and exercised to maximize fairness as perceived by the customer.22
SERVICE RECOVERY AND PERCEIVED FAIRNESS
Since the late 1990s, following the initial work by Stephen Tax, there has been a stream of studies on how customers perceive service recovery in terms of perceived fairness or justice.23 In most of the studies the term ‘justice’ is used. However, as this term has a legal meaning, the term fairness is more appropriate in a service management context and is used here as a synonym.
According to this model customers’ perception of a service recovery process is divided into three parts, which describe three different aspects of how fair or unfair the process is considered:
Distributive fairness: the degree to which the outcome of the service recovery process equals what the customer thinks he deserved or needed, including the level of compensation and apology.
Procedural fairness: the degree to which customers feel that they could influence the recovery process, and the convenience and timeliness of the process.
Interactional fairness: the degree to which customers consider interpersonal interactions during the process to be fair, honest and empathetic, including fair communication and behaviour.
The three types of perceived fairness represent different aspects of the service recovery process and its outcome. It is important to realize that customers assess the fairness of the recovery process in more than one dimension. If the process itself and the interactions and communications taking place during the process are perceived as unfair, it is not enough to provide customers with a fair outcome in terms of compensation that recovers a factual loss and apology that reduces the emotional stress felt by the customer. As a well-managed and favourably perceived recovery is a way of turning a quality disaster into a positive overall experience of the service provider’s way of operating and thus into a positive quality experience, it is important for firms to develop service recovery procedures that make customers feel that they are treated well on all fairness dimensions and thus perceive total fairness.24
GUIDELINES FOR SERVICE RECOVERY
Service recovery is a strategy for managing mistakes, failures and problems in customer relationships. It can be applied by all types of organizations, regardless of the firm’s core business. A manufacturer or an organization in the public sector can benefit from this approach in the same way as a service firm, and the customers of any firm will certainly benefit from an organization that takes a service recovery approach instead of a traditional complaints-handling approach to managing mistakes and quality problems. Unlike traditional complaints handling, service recovery offers a service-oriented approach to managing problems. Below is a list of guidelines for the development of an effective service recovery process.
• It is the organization’s responsibility to spot service failures and other types of mistakes or quality problems. Customers should only have to notify the firm about the situation or make a complaint if the firm has been unable to do so.
• If formal complaints are required, it should be made as easy as possible for the customer to complain. The complaints procedure should be made as unproblematic and free from bureaucracy as possible. Written complaints should be used only when absolutely necessary, for example for legal reasons or when large amounts of money are involved. Remember that most customers who are dissatisfied do not bother to complain; they just take their business away without saying what went wrong.
• The organization should take the initiative to inform the customer about the failure or mistake and, in cases where immediate corrections cannot be made, keep the customer up-to-date about the progress of rectifying the mistake.
• The organization should actively take measures to correct failures and mistakes, and not wait until the customer demands action. Corrections should be made as quickly as possible. Every mistake or failure should be rectified immediately it occurs, if possible.
• The customer should be compensated immediately and, in cases where immediate compensation cannot be given, no unnecessary delays should be allowed. A lost customer, if profitable, has a greater negative effect on long-term profits than an overcompensated, satisfied customer who continues his relationship with the firm and probably also contributes to favourable word-of-mouth communication.
• If for some reason, legal or otherwise, a customer cannot be compensated for the problem that has occurred, a swift and service-oriented recovery process may still make the customer feel satisfied with the relationship, because a positive functional quality impact has been created in this situation. However, this requires that customers perceive the procedures and interactions as having been fair. For long-term profitability it may be wise to compensate customers even when they are wrong or have caused the failure themselves. Taking short-term losses for the sake of long-term revenues in strengthened customer relationships often makes sense.
• Emotional reactions, such as anxiety and frustration, which customers often feel because of a service failure or some other mistake, must also be managed, in addition to recovering the problem itself. Such emotions should be attended to first.
• Apologizing is important, but is not enough in most situations. Customers must also be compensated for losses they feel they have suffered and the failure must be dealt with.
• To make full use of the potential of successful recovery, a systematic service recovery system should be developed. In such a system empowered employees such as customer contact employees, customer-oriented supervisors and managers as well as support persons, are in a central position.
• Complaints departments and managers of complaints-handling departments often only impede customer-oriented service recovery. However, a service recovery manager may be needed to develop and support the recovery system.
SERVICE RECOVERY PROCESSES
Customer contact employees may spot problems and service failures and take action but, as stated in the previous section, to make full use of the potential of successful service recovery the firm should develop a recovery system. The following guidelines may be helpful in developing such a system.25
Calculate costs of failures and mistakes. Customers who defect because they are dissatisfied have to be replaced by new customers, and in addition they often engage in negative word of mouth. Acquiring new customers is always several times more expensive than keeping existing customers. Negative word of mouth also has a damaging effect on image. This makes the acquisition of new customers more difficult and expensive. Correcting mistakes and recovering problematic situations adds costs that could have been avoided had the service functioned well in the first place. However, management too seldom realizes the financial effects of bad service. Therefore, careful measurements of the costs involved may warn management of the negative financial effects of badly managed service processes. In view of the high cost of losing customers, the need for a service recovery system is easily appreciated and the cost of compensating, and even overcompensating, customers for their losses becomes marginal.
Solicit complaints. Most customers never tell a firm about problems with services or goods that they have faced. They just disappear to a competitor. It is important to get information about failures that occur, mistakes that are made, systems that do not function in a service-oriented way, and other reasons for poor perceived quality and dissatisfaction. Employees, especially those in contact with customers, should be able to monitor the service processes for mistakes and service failures, so that the firm realizes there is a problem, if possible even before the customer does. However, many problems are first and perhaps only perceived by the customer. Because dissatisfied customers form a firsthand source of information regarding what needs to be improved, it must be made as easy as possible for customers to complain about quality problems and failures in the service system. Some firms use information technology to help customers inform the firm about a mistake that has occurred.26 When customers complain, they must be shown respect and attention by the employee to whom they make the complaint.27
Identify recovery needs. Mistakes can happen and failures can occur almost anywhere. However, by carefully analysing the service process, human resources, systems used in the process and customers’ need for information and guidance, it is possible to spot areas with high risk of failure. Situations where one error can lead to a chain reaction (for example, a delayed incoming flight) are particularly problematic. Complicated IT systems are another risky area. The introduction of new systems is always critical. By being aware of such areas where the risk of mistakes is especially high, management can prepare the organization for taking care of possible failures.
Recover quickly. An old rule of thumb says that disappointed customers tell 12 others about their negative experiences, whereas satisfied customers tell much fewer about their positive experiences. With the introduction of social media, these effects can be much more dramatic today. The more slowly a problem is attended to and corrected, the more negative word of mouth is created. In addition, the impact of a slow recovery process on a damaged quality perception is much greater than if there is a quick recovery. We shall turn to this aspect of service recovery in the next section.
Train employees. Customer contact employees must understand why service failures need to be attended to and recovered quickly, and they need to understand and appreciate why they, in the front line, have a responsibility, first of all, for spotting problems, mistakes and customers who seem to become disappointed with the service process or who do not understand how to participate effectively in the process. Second, they need to understand and accept their responsibilities for taking action to manage a disappointed customer’s frustration and make efforts to quickly correct mistakes and compensate the customer for his losses. Training is required so that employees have the service-oriented perspective needed to take care of problematic situations and also the skills required in these situations. Without this perspective the employees may have a different view of recovery needs to the customers.28 This is part of internal marketing, which will be discussed at length in Chapter 14.
Empower and enable customer contact employees. Training gives employees a better understanding of the situation and their central role in service recovery, and also the knowledge and skills for doing the job. However, to handle dissatisfied and frustrated customers, employees need authority to make decisions about what to do and how much to compensate. They also need to know how far their authority goes and when the recovery of a failure has to be handed over to someone else in the organization, or when a formal written complaint needs to be made. Employees have to be empowered with authority and enabled with access to information, databases and compensation systems, such as vouchers, free tickets or money. In Chapter 15, empowerment and enabling are discussed at length.
Keep the customer informed. The customer should always be told that the failure or mistake has been acknowledged and that the recovery process is underway. If a recovery cannot be made on the spot and if the process takes time, customers must be kept informed about its progress. Finally, when a problem has been corrected, the customer should be notified about the result but also about what the firm has learnt from the failure and which corrective actions they have taken to improve the service process.
Learn from mistakes. The firm must have a system for using service recovery experiences in a productive way. Service failures, quality problems and other mistakes can often be traced back to either a structural problem in some process in the organization or to employee or management attitude. It is important that the firm analyses the root cause of a problem and corrects the underlying processes or attitudes. Situations that have led to problematic situations must be handled better the next time they occur.29
In summary, a system for effective service recovery includes three areas of focus:30 constantly monitor service processes to identify problems, solve problems effectively and learn from problems and the recovery process. Table 5.1 shows the necessary recovery steps expected by customers.31
TIMING OF RECOVERY PROCESSES
In addition to correcting the mistake, quick response and adequate compensation are usually considered crucial elements of service recovery.32 This final section of Chapter 5 will discuss some effects on perceived service quality resulting from various timing strategies.33 The relationship framework, including episodes (or service encounters) consisting of singular acts, sequences of interrelated episodes and the overall relationship itself, is used to illustrate various timing strategies. The three strategies are labelled administrative (a passive approach), defensive (an active approach) and offensive (a proactive approach), respectively. A lost-luggage situation is used as an example. A family of three is arriving by air at a distant beach resort for four days of vacation. Upon arrival they realize that all their checked-in luggage has been lost. This means that the family does not have more than their travelling clothes at their disposal. The need for service recovery is evident.
Customer expectations when service failures or problems occur.
Action expected |
How action should be handled |
Apology |
Delivered in person, even if the firm did not cause the problem (however, apology is often not enough). |
Fair compensation |
Reasonable compensation on the spot from customer contact employee. |
Caring treatment |
By showing empathy and treating each customer as an individual; attending to emotional problems. |
Value-added atonement |
Customer gets something as a symbol of appreciation of value as customer (sometimes a fair compensation may serve as such a symbol). |
Kept promises about recovery |
Contact employee describes what will happen and when, with confidence that it actually will happen that way (negative information is better than no information or wrong information; it is better to hear once that a flight is 60 minutes delayed than to hear four times that there is a 15-minute delay). |
Source: Amended from Zemke, R. (1992) Supporting service recovery: attributes for excelling at solving customers’ problems. In Sheuing, E.E., Gummesson, E. & Little, C.H. (eds), Selected Papers from the Second Quality in Services (QUIS 2) Conference. New York: St. John’s University and ISQA, International Service Quality Association, p. 46.
An administrative service recovery (passive approach to service failures) is shown in the top part of Figure 5.4. The airline agent does the required paperwork and gives the family a standard voucher for a nominal amount of money. The family realizes immediately that this sum will not cover more than a fraction of the purchases necessary to save their vacation. They are informed that if that is the case they will have to make a formal complaint to the airline after their vacation. The recovery of the service failure will thus be taken care of afterwards when this complaint has been duly processed. The recovery is managed as a separate service sequence following the main service sequence (the vacation consisting of, for example, three episodes: flight to the vacation resort, stay at the resort, and flight back). This configuration of the relationship is illustrated in the upper part of Figure 5.4. This way of handling service failure can be labelled administrative recovery, because the service failure is not fully recovered at all. Instead the responsibility to seek redress is left to the customer as a separate process (sequence). This type of recovery is similar to traditional complaints handling.
Furthermore, the emotional effects of the failure are not addressed, which will probably negatively influence the customer’s perception of service quality. Also, the damage to the perceived service quality caused by the failure is not likely to be diminished, even if the customer is fully compensated after the complaints-handling process.
A defensive service recovery (active approach to service failures) is illustrated in the middle part of the figure. Following this timing strategy the airline company suggests to the family that they buy what they need at their own expense and then get their purchases reimbursed at the airline’s office after the return trip. In this way the recovery of the failure is managed as a separate recovery episode, but as part of the main service sequence (as part of the vacation). This approach to managing service failures can be called defensive recovery, because there is a clear attempt to recover the situation without any formal complaints procedure. In this sense it is an active approach. However, it is defensive, because it leaves the customer to sort out the problem for himself first. The formal recovery is taken care of later, however, as part of the main service sequence.
The emotional problems following the service failure are probably not managed very well in this way either, although they will have less influence on the perceived service quality than the administrative service recovery. As the customer knows from the beginning that he will be able to make the purchases required without economic consequences for himself, the intended service quality perception can probably be restored.
An offensive service recovery (proactive approach to service failures) is shown at the bottom of the figure. The airline company could also make the recovery of the service failure immediately as part of the episode where the failure occurred. The agent could, for example, offer the family the opportunity to make all the purchases they need at the airline’s expense in a number of listed shops at the resort. The firm takes a proactive approach to managing the problems caused by the failure, by removing all additional annoyance and problems. The recovery act becomes part of the episode where the failure took place, although some of the recovery-related activities (buying clothes, for example) are part of a later episode.
In this way the emotional problems caused by the service failure are much more likely to be diminished. The customer is likely to be surprised by the positive way the negative situation is handled by the service provider, and there is even a possibility that the originally intended level of perceived service quality will be exceeded.
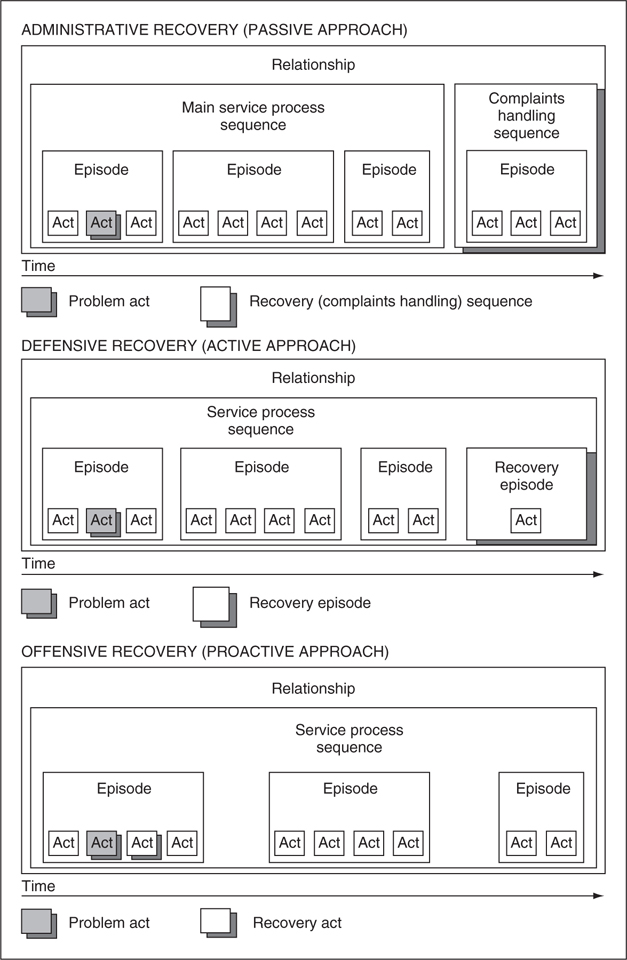
FIGURE 5.4
Timing of service recovery in a relationship framework.
Source: Grönroos, C., The role of service recovery: administrative, defensive and offensive management of service failures. In Fisk, R. & Glynn, L. (eds), Jazzing Into the New Millennium. 1999 SERVSIG Services Research Conference, Chicago, IL: American Marketing Association; 1999: pp. 40–42. Reproduced by permission of the American Marketing Association.
MANAGING SERVICE FAILURES AND QUALITY PROBLEMS: A SUMMARY
Some quality problems and failures cannot be corrected immediately. However, the customer’s emotional concerns, anxiety and frustration should always be attended to right away. Most failures can be taken care of and recovered on the spot, if there is a functioning recovery system in the firm and if the customer contact employees are empowered with authority, knowledge and skills, and enabled to perform with easily retrievable information, an appropriate compensation system and, when needed, supportive superiors.
Timing is essential. As a ground rule, the quicker recovery can be made, the better. A quick recovery will make the customer more satisfied with service quality than otherwise. In addition, a prompt recovery will cost the firm less than a slow recovery or a traditional complaints-handling process. First, the costs of handling recovery, including compensation paid, will probably amount to a smaller sum, and second, quick recovery will increase the likelihood of positive word of mouth and also of customer retention. If customers stay in the relationship, the much higher costs of getting new customers to replace lost ones can be avoided. Patrick Mene, Director of Quality at the Ritz-Carlton Hotel Company, an early Malcolm Baldrige Quality Award-winning service firm, coined the ‘1–10–100 rule of service recovery’.34 What costs the firm one pound, euro or dollar to fix immediately will cost 10 tomorrow and 100 later on. This is the financial logic of service recovery in a nutshell.35
NOTES
1. See Yang, C-C., Identification of customer delight for quality attributes and its applications. Total Quality Management and Business Excellence, 22(1), 2011, 83–98, where a customer delight barometer is developed. However, see also Correira Loureiro, S.M., Miranda, F.J. & Breazeale, M., Who needs delight? The greater impact of value, trust and satisfaction in utilitarian, frequent-use retail. Journal of Service Management, 25(1), 2014, 101–124, where the authors claim that in a retailing context at least delight may be less important for customers than perceived value, trust and satisfaction.
2. Rust, R.T. & Oliver, R.L., Should we delight the customer? Journal of the Academy of Marketing Science, 28(1), 2000, 86–94.
3. Rust & Oliver, op. cit.
4. The gap analysis model as well as reasons for gaps and ways of managing gaps are discussed in Parasuraman, A., Zeithaml, V.A. & Berry, L.L., A conceptual model of service quality and its implications for future research. Journal of Marketing, 61, 1985 and Zeithaml, V.A., Berry, L.L. & Parasuraman, A., Communication and control processes in the delivery of service quality. Journal of Marketing, 64(Apr), 1988, 35–48.
5. See Berry, L.L. & Parasuraman, A., Marketing Services. Competing Through Quality. New York: The Free Press, 1991. See also Yap, K.B. & Sweeney, J.C., Zone-of-tolerance moderates the service quality-outcome relationship. Journal of Services Marketing, 21(2), 2007, 137–148, and Wu, L-W. & Wang, C-Y., Satisfaction and zone of tolerance: the moderating roles of elaboration and loyalty programs. Managing Service Quality, 22(1), 2012, 38–57.
6. In a large study of the restaurant industry Tore Strandvik demonstrated that in general customers seem to show a loss aversion. See Strandvik, T., Tolerance Zones in Perceived Service Quality. Helsingfors/Helsinki: Swedish School of Economics, Finland, 1994.
7. See Strandvik, op. cit.
8. This classification of quality attributes and the examples of various types of attributes were suggested by Silvestro and Johnston. See Silvestro, R. & Johnston, R., The determinants of service quality: hygiene and enhancing factors. In Sheuing, E.E., Gummesson, E. & Little, C.H. (eds), Selected Papers from the Second Quality in Services (QUIS 2) Conference. New York: St. John’s University and ISQA, International Service Quality Association, 1992, pp. 193–210.
9. Johnston, R., The determinants of service quality: satisfiers and dissatisfiers. International Journal of Service Industry Management, 6(5), 1995, 53–71.
10. Johnston, op. cit.
11. Berry & Parasuraman, op. cit.
12. Boshoff, C. & Leong, J., Empowerment, attribution and apologising as dimensions of service quality. International Journal of Service Industry Management, 9(1), 1998, 24–47 and Andreassen, T.W., Dissatisfaction with Services. The Impact of Satisfaction with Service Recovery on Corporate Image and Future Repurchase Intentions. Stockholm, Sweden: Stockholm University, 1997.
13. Tax, S.S., Brown, S.W. & Chandrashekaran, M., Customer evaluation of service complaint experiences: implications for relationship marketing. Journal of Marketing, 62(Apr), 1998, 60–76.
14. Spreng, R.A., Harrell, R.A. & Mackoy, G.D., Service recovery: impact on satisfaction and intentions. Journal of Services Marketing, 9(1), 1995, 15–23.
15. Kelley, S.W. & Davis, M.A., Antecedents to customer expectations for service recovery. Journal of the Academy of Marketing Science, 22(1), 1994, 52–61.
16. An early publication where service recovery was suggested as a way of managing service failures is Hart, C.W.L., Heskett, J.L. & Sasser Jr., W.E., The profitable art of service recovery. Harvard Business Review, Jul/Aug, 1990, 148–156.
17. Tax, S.S. & Brown, S.W., Service recovery: research insights and practices. In Swartz, T.A. & Iacobucci, D. (eds), Handbook in Services Marketing & Management. Thousand Oaks, CA: Sage Publications, 2000, p. 272. See also Lovelock, C.H., Product Plus. New York: McGraw-Hill, 1994.
18. The emotional aspects of service failures and how they can be handled by service recovery procedures do not seem to be discussed very much in the literature. The emotional effects of how failures are recovered have been studied in Shoefer, K. & Ennew, C., The impact of perceived justice on consumers’ responses to service complaint experiences. Journal of Services Marketing, 19(5), 2005, 261–270. See also Chebat, J.-C. & Slusarczyk, W., How emotions mediate the effects of perceived justice on loyalty in service recovery situations: an empirical study. Journal of Business Research, 58(5), 2005, 664–674, and DeWitt, T., Nguyen, D.T. & Marshall, R., Exploring customer loyalty following service recovery: the mediating effects of trust and emotions. Journal of Service Research, 10(3), 2008, 269–281.
19. Tax, Brown & Chandrashekaran, 1998, op. cit. See also Zeithaml, V.A., Berry, L.L. & Parasuraman, A., The nature and determinants of customer expectations of services. Journal of the Academy of Marketing Science, 21(1), 1993, 1–12.
20. Smith, A.K. & Bolton, R.N., An experimental investigation of customer reactions to service failure and recovery encounters. Journal of Service Research, 1(1), 1998, 65–81.
21. Boshoff, C. & Allen, J., The influence of selected antecedents on frontline staff’s perception of service recovery performance. International Journal of Service Industry Management, 11(1), 2000, 63–90. The authors of this article suggest that managers must be prepared for their staff to make mistakes and that ‘they must adopt an “it’s better to try and fail than not to try at all” attitude’ (p. 82).
22. de Ruyter, K. & Wetzels, M., Customer equity considerations in service recovery: a cross-industry perspective. International Journal of Service Industry Management, 11(1), 2000, 91–108.
23. See Tax, S.S., Brown, S.W. & Chandrashekaran, M., op. cit. Studies following the justice approach are, for example, Yim, C.K., Gu, F.F. & Tse, D.K., Justice-based service recovery expectations: measurements and antecedents. Journal of Satisfaction, Dissatisfaction and Complaining Behavior, 16, 2003, 36–47; Mattila, A.S. & Cranage, D., The impact of choice on fairness in the context of service recovery. Journal of Services Marketing, 19(5), 2005, 271–279; Shoefer, K. & Ennew, C., op. cit.; and and Liao, H., Do it right this time: the role of employee service recovery performance in customer-perceived justice and customer loyalty after service failures. Journal of Applied Psychology, 92(2), 2007, 475–489.
24. See Tax, S.S., Brown, S.W. & Chandrashekaran, M., op. cit., p. 72. See also del Rio-Lanza, A.B., Vasquez-Casielles, R. & Diaz-Martin, A.M., Satisfaction with service recovery: perceived justice and emotional responses. Journal of Business Research, 62(8), 2009, 775–781.
25. See Hart, Heskett & Sasser, op. cit., Berry & Parasuraman, op. cit. and Tax, S.S. & Brown, S.W., Recovering and learning from service failure. Sloan Management Review, 40(1), 1998, 75–88. In these publications service recovery systems are discussed at length. See also Wang, K-Y., Hsu, L-C. & Chih, W-H., Retaining customers after service failure recoveries: a contingency model. Managing Service Quality, 24(4), 2014, 318–338, where the authors study ways of keeping customers after service recovery situations.
26. Tax & Brown, op. cit.
27. In a study of the food retailing industry Inger Roos observed that a lack of respect for customers’ complaints had a decisive effect on customers’ decisions to switch from one shop to another. See Roos, I., Switching Paths in Customer Relationships. Helsinki/Helsingfors: Swedish School of Economics, Finland, 1999.
28. In a study of the airline industry Edvardsson found a considerable difference between how employees and customers perceived critical incidents in the service process. See Edvardsson, B., Service breakdowns: a study of critical incidents in an airline. International Journal of Service Industry Management, 3(4), 1992, 17–29.
29. Bill Marriott, Managing Director of Marriott Corp., says that he demands that his firm not only do whatever is necessary to take care of guests in normal situations, but that employees also track, measure and follow up on how to handle things better in the future. See Bowen, D.E. & Lawler III, E.E., Empowering service employees. Sloan Management Review, 36(Summer), 1995, 73–84.
30. Compare Berry & Parasuraman, op. cit.
31. Zemke, R., Supporting service recovery: attributes for excelling at solving customers’ problems. In Sheuing, E., Gummesson, E. & Little, C.H. (eds), Selected Papers from the Second Quality in Services (QUIS 2) Conference. New York: St. John’s University and ISQA, International Service Quality Association, 1992, pp. 41–46.
32. See, for example, Johnston, R. & Fern, A., Service recovery strategies for single and double deviation scenarios. The Service Industry Journal, 19(2), 1999, 69–82.
33. Grönroos, C., The role of service recovery: administrative, defensive and offensive management of service failures. In Fisk, R. & Glynn, L. (eds), Jazzing Into the New Millennium. 1999 Servsig Services Research Conference. Chicago, IL: American Marketing Association, 1999, pp. 39–43.
34. Patlow, C.G., How Ritz-Carlton applies ‘TQM’. The Cornell H.R.A. Quarterly, August, 1993, 16–24.
35. See Stauss, B. & Seidel, W., Complaint Management. The Heart of CRM. Mason, OH: Thomson, 2004, where the authors demonstrate how well-handled customer complaints, following a service recovery system, help the firm save money and achieve sustainable revenues.
FURTHER READING
Andreassen, T.W. (1997) Dissatisfaction with Services. The Impact of Satisfaction with Service Recovery on Corporate Image and Future Repurchase Intentions. Stockholm, Sweden: Stockholm University.
Berry, L.L. & Parasuraman, A. (1991) Marketing Services. Competing Through Quality. New York: The Free Press.
Boshoff, C. & Leong, J. (1998) Empowerment, attribution and apologising as dimensions of service quality. International Journal of Service Industry Management, 9(1), 24–47.
Boshoff, C. & Allen, J. (2000) The influence of selected antecedents on frontline staff’s perception of service recovery performance. International Journal of Service Industry Management, 11(1), 63–90.
Bowen, D.E. & Lawler III, E.E. (1995) Empowering service employees. Sloan Management Review, 36(Summer), 73–84.
Chebat, J.-C. & Slusarczyk, W. (2005) How emotions mediate the effects of perceived justice on loyalty in service recovery situations: an empirical study. Journal of Business Research, 58(5), 664–674.
Correira Loureiro, S.M., Miranda, F.J. & Breazeale, M. (2014) Who needs delight? The greater impact of value, trust and satisfaction in utilitarian, frequent-use retail. Journal of Service Management, 25(1), 101–124.
de Ruyter, K. & Wetzels, M. (2000) Customer equity considerations in service recovery: a cross-industry perspective. International Journal of Service Industry Management, 11(1), 91–108.
del Rio-Lanza, A.B., Vasquez-Casielles, R. & Diaz-Martin, A.M. (2009) Satisfaction with service recovery: Perceived justice and emotional responses. Journal of Business Research, 62(8), 775–781.
DeWitt, T., Nguyen, D.T. & Marshall, R. (2008) Exploring customer loyalty following service recovery: the mediating effects of trust and emotions. Journal of Service Research, 10(3), 269–281.
Edvardsson, B. (1992) Service breakdowns: a study of critical incidents in an airline. International Journal of Service Industry Management, 3(4), 17–29.
Grönroos, C. (1999) The role of service recovery: administrative, defensive and offensive management of service failures. In Fisk, R. & Glynn, L. (eds), Jazzing Into the New Millennium. 1999 Servsig Services Research Conference. Chicago, IL: American Marketing Association, pp. 39–43.
Hart, C.W.L., Heskett, J.L. & Sasser Jr., W.E. (1990) The profitable art of service recovery. Harvard Business Review, Jul/Aug, 148–156.
Johnston, R. (1995) The determinants of service quality: satisfiers and dissatisfiers. International Journal of Service Industry Management, 6(5), 53–71.
Johnston, R. & Fern, A. (1999) Service recovery strategies for single and double deviation scenarios. The Service Industry Journal, 19(2), 69–82.
Kelley, S.W. & Davis, M.A. (1994) Antecedents to customer expectations for service recovery. Journal of the Academy of Marketing Science, 22(1), 52–61.
Liao, H. (2007) Do it right this time: the role of employee service recovery performance in customer-perceived justice and customer loyalty after service failures. Journal of Applied Psychology, 92(2), 475–489.
Lovelock, C.H. (1994) Product Plus: How Product Service Affects Competitive Advantage. New York: McGraw-Hill.
Mattila, A.S. & Cranage, D. (2005) The impact of choice on fairness in the context of service recovery. Journal of Services Marketing, 19(5), 271–279.
Parasuraman, A., Zeithaml, V.A. and Berry, L.L. (1988) SERVQUAL: a multiple-item scale for measuring consumer perceptions of service quality. Journal of Retailing, 64(1), 12–40.
Patlow, C.G. (1993) How Ritz-Carlton applies ‘TQM’. The Cornell H.R.A. Quarterly, August, 16–24.
Roos, I. (1999) Switching Paths in Customer Relationships. Helsinki/Helsingfors: Swedish School of Economics, Finland/CERS Centre for Relationship Marketing and Service Management.
Rust, R.T. & Oliver, R.L. (2000) Should we delight the customer? Journal of the Academy of Marketing Science, 28(1), 86–94.
Shoefer, K. & Ennew, C. (2005) The impact of perceived justice on consumers’ responses to service complaint experiences. Journal of Services Marketing, 19(5), 261–270.
Silvestro, R. & Johnston, R. (1992) The determinants of service quality: hygiene and enhancing factors. In Sheuing, E.E., Gummesson, E. & Little, C.H. (eds), Selected Papers from the Second Quality in Services (QUIS 2) Conference. New York: St John’s University and ISQA, International Service Quality Association, pp. 193–210.
Smith, A.K. & Bolton, R.N. (1998) An experimental investigation of customer reactions to service failure and recovery encounters. Journal of Service Research, 1(1), 65–81.
Spreng, R.A., Harrell, R.A. & Mackoy, G.D. (1995) Service recovery: impact on satisfaction and intentions. Journal of Services Marketing, 9(1), 15–23.
Stauss, B. & Seidel, W. (2004) Complaint Management. The Heart of CRM. Mason, OH: Thomson.
Strandvik, T. (1994) Tolerance Zones in Perceived Service Quality. Helsingfors/Helsinki: Swedish School of Economics Finland.
Tax, S.S. & Brown, S.W. (1998) Recovering and learning from service failure. Sloan Management Review, 40(1), 75–88.
Tax, S.S., Brown, S.W. & Chandrashekaran, M. (1998) Customer evaluation of service complaint experiences: implications for relationship marketing. Journal of Marketing, 62(Apr), 60–76.
Tax, S.S. & Brown, S.W. (2000) Service recovery: research insights and practices. In Swartz, T.A. & Iacobucci, D. (eds), Handbook in Services Marketing & Management. Thousand Oaks, CA: Sage Publications, pp. 271–285.
Wang, K-Y., Hsu, L-C. & Chih, W-H. (2014) Retaining customers after service failure recoveries: a contingency model. Managing Service Quality, 24(4), 318–338.
Wu, L-W. & Wang, C-Y. (2012) Satisfaction and zone of tolerance: the moderating roles of elaboration and loyalty programs. Managing Service Quality, 22(1), 38–57.
Yang, C-C. (2011) Identification of customer delight for quality attributes and its applications. Total Quality Management and Business Excellence, 22(1), 83–98.
Yap, K.B. & Sweeney, J.C. (2007) Zone-of-tolerance moderates the service quality-outcome relationship. Journal of Services Marketing, 21(2), 137–148.
Yim, C.K., Gu, F.F. & Tse, D.K. (2003) Justice-based service recovery expectations: measurements and antecedents. Journal of Satisfaction, Dissatisfaction and Complaining Behavior, 16, 36–47.
Zeithaml, V.A., Berry, L.L. & Parasuraman, A. (1988) Communication and control processes in the delivery of service quality. Journal of Marketing, 64(Apr), 35–49.
Zeithaml, V.A., Berry, L.L. & Parasuraman, A. (1993) The nature and determinants of customer expectations of services. Journal of the Academy of Marketing Science, 21(1), 1–12.
Zemke, R. (1992) Supporting service recovery: attributes for excelling at solving customers’ problems. In Sheuing, E.E., Gummesson, E. & Little, C.H. (eds), Selected Papers from the Second Quality in Services (QUIS 2) Conference. New York: St. John’s University and ISQA, International Service Quality Association, pp. 41–46.