12
Other Response Variables
Up to now, the response variable has been a continuous real number such as a weight, length or concentration. We made several important assumptions about the behaviour of the response variable, and it is worth reiterating those assumptions here, ranked in order of importance:
- random sampling
- constant variance
- normal errors
- independent errors
- additive effects
So far, when we found that one or more of the assumptions was wrong, our typical resort was transformation of the response variable, coupled perhaps with transformation of one or more of the explanatory variables.
In our line of work, we often meet with response variables where the key assumptions are rarely if ever met. In these cases, it is sensible to look for alternatives to transformation that might improve our ability to model these systems effectively. In this book we cover four new kinds of response variable that are very common in practice:
- count data
- proportion data
- binary response data
- age-at-death data
all of which routinely fail the assumptions about constancy of variance and normality of errors. It turns out that these different kinds of response variables have more in common than you might first imagine, and that they can all be dealt with in the framework of generalized linear models (GLMs). These models allow variance to be non-constant and errors to be non-normally distributed. It is worth noting, however, that they still assume random sampling and independence of errors. Effects in GLMs may be additive or multiplicative, depending on the circumstances.
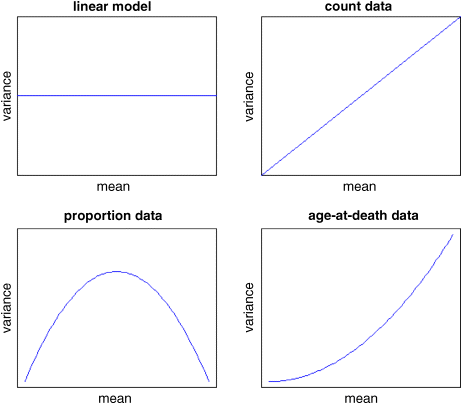
We begin by thinking about variance. Count data are whole numbers (integers) so you can see immediately that when the mean is low, the data are likely to consist only of zeros, ones and twos, with the odd three of four thrown in. This being the case, the variance of count data is bound to be low when the mean is low (recall that variance is the sum of the squares of the departures of the counts from the mean count, divided by the degrees of freedom). However, when the mean of count data is high, the range of individual counts can be from zero to potentially very large numbers, and when we work out the residuals and square them we can expect to obtain very large numbers, and a consequently high variance. For count data, therefore, the variance is expected to increase with the mean, rather than being constant as assumed in linear models. For the kind of count data we are talking about here, we know the number of times that something happened (lightning strikes, cells on a microscope slide, insects on a leaf), but not the number of times it did not happen.
For proportion data based we typically have a count of the number of individuals doing one thing and another count of the number not doing that thing. Both these counts are free to vary and both counts are important in analysing the data properly. In general the numbers doing the thing in question are known as successes and the numbers not doing it are known as failures. This can be rather macabre, as when the response variable is the number of people dying in a medical trail. Examples of proportion data based on counts are:
| Successes | Failures |
| dead | alive |
| female | male |
| diseased | healthy |
| occupied | unoccupied |
| pollinated | not pollinated |
| adult | juvenile |
You can see that this kind of proportion data based on counts arises in a great many kinds of circumstances. Let us think about the variance of proportion data like this. If the success rate is 100% then all the individuals are alike and the variance is zero. Again, if the success rate is zero, then all the individuals are alike and the variance is zero. If, however, the success rate is intermediate (50%, say) then some of the individuals are in one class and some are in the other, so variance is high. This means that unlike count data (above) where the variance increased monotonically with the mean, for proportion data the variance is a humped function of the mean. The binomial distribution is an important example of the kind of distribution used in the analysis of proportion data: if p is the probability of success and n is the number of trails, then the mean number of successes is np and the variance in the number of successes is np(1 − p). As you can see, the variance is 0 when p = 1 and 0 when p = 0, reaching a peak when p = 0.5.
Another sort of proportion data (such as percentage cover data from plant ecology), is not based on counts, but involves continuous numbers that are bounded both above and below (for instance, you cannot have negative percentage cover, or cover values that are greater than 100%). These kinds of proportion data are arcsine transformed prior to analysis, then analysed using linear models (see p. 257).
A very particular kind of response variable is analysed by medical researchers: this is the age at death. The research questions centre on the effect of a particular treatment on (hopefully) increasing the age at death of the patients receiving this treatment compared to patients receiving the placebo (the controls). Age-at-death data are notorious for their non-constant variance. We saw that for count data the variance increases with the mean, but for age-at-death data the situation is even more extreme than this: the variance increases with the square of the mean.
Here are graphs of the variance as a function of the mean for four contrasting kinds of response variable: data suitable for analysis using linear models (constant variance, top left); count data (linearly increasing variance, top right); proportion data (humped variance mean relationship, bottom left) and age-at-death data (quadratically increasing variance, bottom right).
Introduction to Generalized Linear Models
A generalized linear model has three important properties:
- the error structure
- the linear predictor
- the link function
These are all likely to be unfamiliar concepts. The ideas behind them are straightforward, however, and it is worth learning what each of the concepts involves.
The Error Structure
Up to this point, we have dealt with the statistical analysis of data with normal errors. In practice, however, many kinds of data have non-normal errors:
- errors that are strongly skewed
- errors that are kurtotic
- errors that are strictly bounded (as in proportions)
- errors that cannot lead to negative fitted values (as in counts)
In the past, the only tools available to deal with these problems were transformation of the response variable or the adoption of non-parametric methods. A GLM allows the specification of a variety of different error distributions:
- Poisson errors, useful with count data
- binomial errors, useful with data on proportions
- gamma errors, useful with data showing a constant coefficient of variation
- exponential errors, useful with data on time to death (survival analysis)
The error structure is defined by means of the family directive, used as part of the model formula like this:
glm(y ~ z, family = poisson)which means that the response variable y has Poisson errors. Or
glm(y ~ z, family = binomial)
which means that the response is binary, and the model has binomial errors. As with previous models, the explanatory variable z can be continuous (leading to a regression analysis) or categorical (leading to an ANOVA-like procedure called analysis of deviance, as described below).
The Linear Predictor
The structure of the model relates each observed y value to a predicted value. The predicted value is obtained by transformation of the value emerging from the linear predictor. The linear predictor, ![]() (eta), is a linear sum of the effects of one or more explanatory variables, xj, and is what we see when we ask for summary.lm:
(eta), is a linear sum of the effects of one or more explanatory variables, xj, and is what we see when we ask for summary.lm:
where the xs are the values of the p different explanatory variables, and the ![]() s are the (usually) unknown parameters to be estimated from the data. The right-hand side of the equation is called the linear structure.
s are the (usually) unknown parameters to be estimated from the data. The right-hand side of the equation is called the linear structure.
There are as many terms in the linear predictor as there are parameters, p, to be estimated from the data. Thus with a simple regression, the linear predictor is the sum of two terms whose parameters are the intercept and the slope. With a one-way ANOVA with four treatments, the linear predictor is the sum of four terms leading to the estimation of the mean for each level of the factor. If there are covariates in the model, they add one term each to the linear predictor (the slope of each relationship). Interaction terms in a factorial ANOVA add one or more parameters to the linear predictor, depending upon the degrees of freedom of each factor (e.g. there would be three extra parameters for the interaction between a two-level factor and a four-level factor, because (2 − 1) × (4 – 1) = 3).
The linear predictor can be inspected by typing summary.lm: there are as many rows as there are parameters in your model, and for every parameter you get the effect size and the standard error of the effect in the first two columns. The other columns are less important because you could easily work them out yourself: the t value, the p value and the significance stars.
What you will find difficult at first is knowing exactly what effects are being shown on each row. In an analysis of covariance, for example, the top row will contain an intercept and the second row might contain a slope, but the other rows will all be differences between intercepts and/or differences between slopes (i.e. there is only one slope in the table and only one intercept, no matter how many slopes or intercepts there are in the fitted model).
Fitted Values
One of the great strengths of GLMs is that different models can be compared on the same scale of measurement as the response variable. Up to now, we have used variance to measure the lack of fit between the model and the data: this was the sum of the squares of the difference between the response variable y and the fitted values predicted by the model ![]() , which is
, which is ![]() divided by the degrees of freedom. Now if you fit a different model, say log(y) = a + bx, then obviously the variance is completely different because it is based on
divided by the degrees of freedom. Now if you fit a different model, say log(y) = a + bx, then obviously the variance is completely different because it is based on ![]() . This makes model comparison difficult, because there is no common currency for measuring the fit of the two models to the data. In a GLM, however, we always compare y and
. This makes model comparison difficult, because there is no common currency for measuring the fit of the two models to the data. In a GLM, however, we always compare y and ![]() on the same scale on which the response was measured (as a count, for instance, or as a proportion based on two counts). This makes model comparison much more straightforward.
on the same scale on which the response was measured (as a count, for instance, or as a proportion based on two counts). This makes model comparison much more straightforward.
A General Measure of Variability
The difference is that the measure of lack of fit of the model to the data depends on the context. We give it the new, more general name of deviance. The technical definition won't mean much to you at this stage, but here it is:
where the log likelihood depends on the model given the data. We don't need to unlearn anything, because deviance is the same as variance when we have constant variance and normal errors (as in linear regression, ANOVA or ANCOVA). But for count data we do need a different measure of lack of fit (it is based on ![]() rather than on
rather than on ![]() ) and we need a different definition of deviance for proportion data, and so on. But the point is that for measuring the fit, we compare y and
) and we need a different definition of deviance for proportion data, and so on. But the point is that for measuring the fit, we compare y and ![]() on the same original untransformed scale. We shall discuss the various deviance measures in more detail in the following chapters, but so that you can compare them with one another, here are the main measures of lack of fit side-by-side:
on the same original untransformed scale. We shall discuss the various deviance measures in more detail in the following chapters, but so that you can compare them with one another, here are the main measures of lack of fit side-by-side:
| Model | Deviance | Error | Link |
| linear | Gaussian | identity | |
| log linear | Poisson | log | |
| logistic | binomial | logit | |
| gamma | gamma | reciprocal |
To determine the fit of a given model, a GLM evaluates the linear predictor for each value of the response variable, then back-transforms the predicted value to compare it with the observed value of y. The parameters are then adjusted, and the model refitted on the transformed scale in an iterative procedure until the fit stops improving. It will take some time before you understand what is going on here, and why it is so revolutionary. Don't worry; it will come with practice.
The Link Function
One of the difficult things to grasp about GLMs is the relationship between the values of the response variable (as measured in the data and predicted by the model as fitted values) and the linear predictor.
The transformation to be employed is specified in the link function. The fitted value is computed by applying the reciprocal of the link function, in order to get back to the original scale of measurement of the response variable. Thus, with a log link, the fitted value is the antilog of the linear predictor, and with the reciprocal link, the fitted value is the reciprocal of the linear predictor.
The thing to remember is that the link function relates the mean value of y to its linear predictor. In symbols, this means that:
which is simple, but needs thinking about. The linear predictor, ![]() , emerges from the linear model as a sum of the terms for each of the p parameters. This is not a value of y (except in the special case of the identity link that we have been using (implicitly) up to now). The value of
, emerges from the linear model as a sum of the terms for each of the p parameters. This is not a value of y (except in the special case of the identity link that we have been using (implicitly) up to now). The value of ![]() is obtained by transforming the value of y by the link function, and the predicted value of y is obtained by applying the inverse link function to
is obtained by transforming the value of y by the link function, and the predicted value of y is obtained by applying the inverse link function to ![]() .
.
The most frequently used link functions are shown below. An important criterion in the choice of link function is to ensure that the fitted values stay within reasonable bounds. We would want to ensure, for example, that counts were all greater than or equal to zero (negative count data would be nonsense). Similarly, if the response variable was the proportion of individuals who died, then the fitted values would have to lie between 0 and 1 (fitted values greater than 1 or less than 0 would be meaningless). In the first case, a log link is appropriate because the fitted values are antilogs of the linear predictor, and all antilogs are greater than or equal to zero. In the second case, the logit link is appropriate because the fitted values are calculated as the antilogs of the log odds, log(p/q).
By using different link functions, the performance of a variety of models can be compared directly. The total deviance is the same in each case, and we can investigate the consequences of altering our assumptions about precisely how a given change in the linear predictor brings about a response in the fitted value of y. The most appropriate link function is the one which produces the minimum residual deviance.
Canonical Link Functions
The canonical link functions are the default options employed when a particular error structure is specified in the family directive in the model formula. Omission of a link directive means that the following settings are used:
| Error | Canonical link |
| gaussian | identity |
| poisson | log |
| binomial | logit |
| Gamma | reciprocal |
You should try to memorize these canonical links and to understand why each is appropriate to its associated error distribution. Note that only gamma errors have a capital initial letter in R.
Choosing between using a link function (e.g. log link) in a GLM and transforming the response variable (i.e. having log(y) as the response variable rather than y) and using a linear model takes a certain amount of experience.
As you read the following four chapters you will gradually become more familiar with these new concepts. Of course they are hard to understand at first, and it would be wrong to pretend otherwise. But they do become easier with practice. The key is to understand that when variance is not constant and when the errors are not normally distributed, we have to do something about it. And using a generalized linear model instead of a linear model is often the best solution. Learning about deviance, link functions and linear predictors is a small price to pay.
Akaike's Information Criterion (AIC) as a Measure of the Fit of a Model
Unexplained variation is bound to go down with every parameter added to the model. The more parameters that there are in the model, the better will be the fit. You could obtain a perfect fit if you had a separate parameter for every data point (the saturated model; p. 195), but this model would have absolutely no explanatory power. There is always going to be a trade-off between the goodness of fit and the number of parameters required by parsimony.
What we would like to do is to judge the usefulness of each parameter. A simple way of doing this is to penalize each parameter, and only allow the parameter to stay in the model if it more than pays for itself (i.e. if the unexplained variation does down by more than the penalty). When comparing two models, the smaller the AIC, the better the fit. This is the basis of automated model simplification using step. AIC uses a penalty of 2 per parameter, so for a given model AIC is calculated as
and when the deviance goes down by less than 2, then inclusion of the extra parameter is not justified. Other systems (like the Bayesian Information Criterion, BIC) employ stiffer penalties and so typically lead to fewer parameters being included in the minimal adequate model (e.g. BIC penalizes each parameter by log(n) where n is the number of observations).
Further Reading
- Aitkin, M., Francis, B., Hinde, J. and Darnell, R. (2009) Statistical Modelling in R, Clarendon Press, Oxford.
- McCullagh, P. and Nelder, J.A. (1989) Generalized Linear Models, 2nd edn, Chapman & Hall, London.
- McCulloch, C.E. and Searle, S.R. (2001) Generalized, Linear and Mixed Models, John Wiley & Sons, New York.