
Chapter 11
Knowing Your Audience
In This Chapter
- Understanding how YouTube Analytics can improve channel performance
- Navigating the rich reporting options associated with your channel and your audience
- Gaining deeper community insights and seeing their sharing patterns
- Diagnosing channel, video, and audience issues
- Tuning annotations for more effective engagement
Imagine driving along in your car and suddenly your dashboard goes out: no lights, no gauges, and no navigation. You can either pull over to the side of the road and call a tow truck, or just keep driving. Whatever the decision, you'll have a tougher time making it to your destination. As a YouTube channel manager driving down the video highway, you need a dashboard, too: That dashboard is YouTube Analytics.
YouTube Analytics is all about getting meaningful information about how your channel is doing. If you're working with YouTube creators and other online video personalities, chances are good that you'll be prompted to provide some interesting reports about all the wonderful things happening with the YouTube channel. In some cases, though, you may have to deliver some not-so-good news: Maybe your audience and fan base just aren't liking the new videos that are being uploaded to the channel. YouTube Analytics is there to help you figure out what may have gone wrong — and a whole lot more.
YouTube Analytics is where you find the details about your audience: where they're finding you, what they like, where they're watching, and so on. After a while, YouTube Analytics will likely be your first YouTube stop every day. Spend time mastering the analytics process and extracting the key insights it contains because it will help you craft a more robust channel — and significantly better video content. If you're making money from your channel, YouTube Analytics can help you earn even more.
 YouTube Analytics isn't just for new channels. If you already have a channel and it's not performing to your satisfaction, YouTube Analytics is a valuable resource for diagnosing and subsequently fixing problems.
Getting Started with YouTube Analytics
It's tough to talk about analytics with YouTubers without hearing supporting terms like metrics and insights. Don't be put off by all the geeky terms. In Chapter 5, you can find out all about setting goals for your channel. This chapter, however, is all about determining whether you're meeting your goals; to able to do that, you need to work with metrics and insights.
Here's the skinny: Metrics are quantitative things you measure, such as the number of views and percentage click-through rates on your channel. Metrics gauge your goal attainment against your plan. Insights are qualitative and actionable things you learn and do from analyzing metrics, including whether your content is working for you or your annotations are well placed in your video.
YouTube Analytics shows you how you're tracking against your goals and also where you may need to make adjustments. Understanding metrics and insights is relatively straightforward, but you need to know where to look in YouTube Analytics to get the data you need.
As a channel manager, always think in terms of metrics and insights. You must act on those insights, though. For example, if the view count and number of likes (metrics) for your new video are 25 percent of your target, it may indicate that your video isn't resonating with your audience or that you released it at the wrong time (insights). Take the time to fix what may be immediately wrong (such as poor metadata) or change future content or programming. You should verify the video metrics again over time.
As you become more sophisticated in your use of YouTube Analytics, you'll realize that certain metrics may depend on other metrics. For example, your earnings metrics may be impacted by view metrics, which may be impacted by engagement metrics. Don't sweat the details — the relationship among all metrics comes together quickly.
 Chapter 5 covers two important metrics — views and subscribers — in some detail. Make sure that you understand what other metrics impact these two.
Reading YouTube Analytics reports
Your go-to place for all aspects of YouTube Analytics is the Analytics section of Creator Studio. To make your way there, do the following:
- In your web browser, go to www.youtube.com.
- Log on to your YouTube account.
If you see a blue Sign In button in the top right corner of the YouTube home page, enter your email address and password.
- Click on the logged-in icon and choose Creator Studio from the menu that appears.
The Creator Studio navigation menu should appear on the left side of your browser.
- Click the Analytics section of Creator Studio.
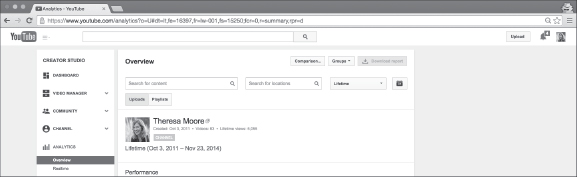
By default, it should go directly to the Overview submenu, as shown in Figure 11-1.
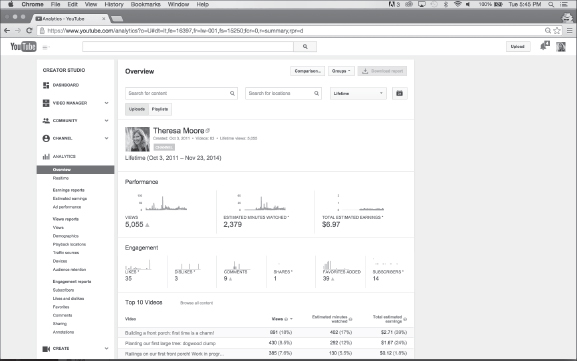
Figure 11-1: YouTube Analytics overview.
You can also bypass these steps by going to www.youtube.com/analytics.
When you look at the Analytics section on Creator Studio's navigation menu, you can see that YouTube Analytics is divided into five subsections. They're described, from top to bottom, in this list:
- Overview: Presents a high-level view of your channel's overall performance. It includes these five subsections:
- Performance: Data on views, watch time, and earnings.
- Engagement: Includes likes, comments, social shares, and subscriber action.
- Top 10 Videos: Lists your most popular videos along with their views, estimated watch times, and estimated per-video earnings.
- Demographics: Includes viewer geography and gender.
- Discovery: Specifies top playback locations and leading traffic sources.
- Realtime: Displays a two-column comparative report on the five newest videos on your channel. Column 1 looks at the last 48 hours, and Column 2 measures the past 60 minutes.
- Earnings reports: Partners can earn money from advertising with Google, along with YouTube Rentals, which are like online movie rentals. This subsection not only looks at estimated advertising revenue but also analyzes which ads perform best against your channel.
The Earnings Report section is visible only if you have enabled channel monetization. (Chapter 14 has more on monetization opportunities.)
- Views reports: Spells out who makes up your audience, what they're watching, and where they're coming from. You'll also see critical metrics around retention, which is how much of a video viewers watch and where they stop viewing.
- Engagement reports: Analyzes subscriber additions and losses, along with whether viewers are liking, commenting, sharing, and clicking annotations.
Breaking down the report components
YouTube provides a rich set of reports that may seem overwhelming at first, but you'll quickly discover that navigating the reports is quite easy because they have a similar structure that consists of these three distinct sections:
- Filter: Over time, you'll add video content, construct playlists, build annotations, engage subscribers, and do so much more. You'll definitely want to set up dynamic filters that are meant to show you only the information you're looking for. The Analytics Filter section is shown in Figure 11-2.
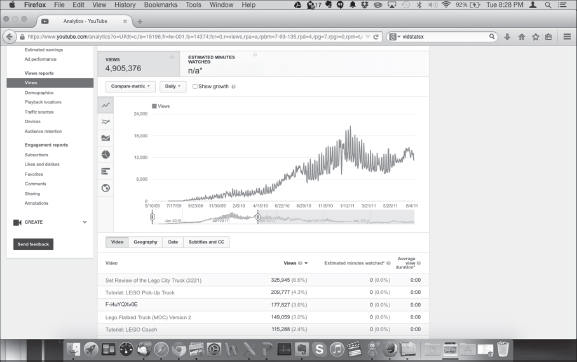
- Chart: After you've determined what you want to analyze, you can get lots of information with some fairly flexible graphical representations (charts, in other words) to guide your understanding. These will help you assess the performance of your channel, your content, and your community. (You can see an example in Figure 11-3 of a YouTube Analytics chart showing views over a multiyear period.)
- Details: Shows itemized details that correspond to the particular YouTube Analytics report. For example, in the Views report, you can get a detailed list of your top 200 videos, including name, views, percentage growth in view, estimated minutes watched, and average view duration. You have similar access to geographical, date, and language data. Figure 11-4 shows what the Details section of a YouTube Analytics report might look like.
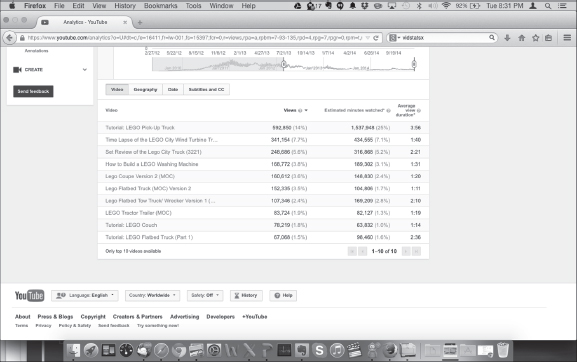
Figure 11-4: The Details section of a YouTube Analytics report.
Grouping information
To simplify some of your channel analysis, you can create custom groups of videos or playlists for analysis. If you manage a baking channel, you may want to create one group for all your bread videos and playlists and another for your cake baking videos and playlists. (To create a group, simply click the Group button, give the group a name, select the videos or playlists you want in the group, and then click Save.)
A group is used for your analysis work; it lets you aggregate related content. It's different from a playlist, which is meant for audience viewing. Yes, YouTube even lets you group playlists for analysis!
Comparing data
In the earlier (hypothetical) example of a baking channel, wouldn't it be great if you could compare how your bread-baking videos or playlists are performing against your cake-baking videos or playlists? Well, with YouTube Analytics, you can do precisely that. You can even make comparisons by country and date. (To compare videos, groups, or playlist, click the Comparison button and enter the names of the items you want to compare. YouTube Analytics will pull the data together for you.)
If you're running a YouTube advertising campaign (see Chapter 13), groups and comparisons are effective ways to determine which channel videos may be the best one to advertise with.
Setting up report filters
Creating truly informational reports is easy: Just figure out which data you want to include and which data you don't. The Analytics Filter section not only makes this task possible but also lets you see the results of what you're doing immediately, which lets you fine-tune the filter so that the data is exactly what you want.
By using the following text fields and drop-down menus, found in the Analytics Filter, you can ensure that you're looking at only the data you need:
- Search for Content field: Include only a specific video, playlist, or group for analysis.
If you want to include more than one video, group the videos first. This feature doesn't let you filter for multiple individual videos unless they're part of a group or playlist.
- Search for Locations field: Select video data that is gathered worldwide, by continent, or by country. You may want to do this, for example, to determine how many viewers you get from Europe, Asia, South America, and so on.
You cannot currently group countries or continents.
- Preconfigured Date drop-down menu: The default value is Last 28 Days. Click the button to the right of the Location section to choose common date criteria, such as this year, last year, or this quarter.
- Custom date range: If a preconfigured date doesn't work, you can pick a more suitable and customizable date range by clicking the Calendar button to the right of the Preconfigured Date menu.
- Uploads/Playlists: By default, YouTube Analytics looks at the performance of the videos on your channel. Playlists, however, can be as important an asset as videos. This button, which sits below the Search for Content field, lets you toggle between video uploads and playlists.
- Show Only Subscriber Views: Your analytics reporting looks at the behavior of your entire audience. For certain reports, such as Demographics and Traffic sources, you can look at behavior by only your subscribers. Simply click the Show Only Subscriber Views checkbox, if it's present, to the right of the Uploads/Playlists.
- Groups: Add a custom video and playlist groups to your filter criteria by clicking the Groups button. You can also modify existing groups.
- Comparisons: Clicking the Comparisons button brings up a second filter section immediately under the first. Currently, YouTube allows only two comparisons. When you're finished with the analysis, merely click the Cancel Comparison button that appears to the left of the Groups button, initially where the Comparison button was when you started.
You need to set up a filter only once in the Analytics section of Creator Studio. You can move among all report types, and your filters will remain in place. However, after you leave the Analytics section and move over to the Video Manager or Community sections, for example, you have to reenter the filter information whenever you return to Analytics.
Understanding visual charts
Moving from report to report in the Analytics section, you're sure to see both the graphs and the data changing in the Chart section below the filter criteria. Though the reports are similar, each may have specific metrics based on the report type. For example, you'll find subtitles and captions in a Views report, but such items would make no sense in an Engagement report.
YouTube Analytics always presents data relevant to the particular report type.
In the Chart section, you generally see the following elements:
- Key Metrics: A banner below the filter criteria indicates the major metrics associated with the report. Clicking on a major metric immediately graphs it on the chart. If you're looking at a Subscriber report, you can choose among subscribers, subscribers gained, and subscribers lost.
- Comparative Metrics and More Metrics: Charting different metrics against one another can provide insight into what channel actions influence another. On a Views report, you may find that charting views and total estimated earnings show similar and aligned graphs. You can use this information to formulate the actions needed to drive views and accelerate earnings. To add metrics, click the Comparative Metric or More Metrics button, whichever shows up under the Key Metrics banner on the left. A complete list of your choices is shown in Figure 11-5.
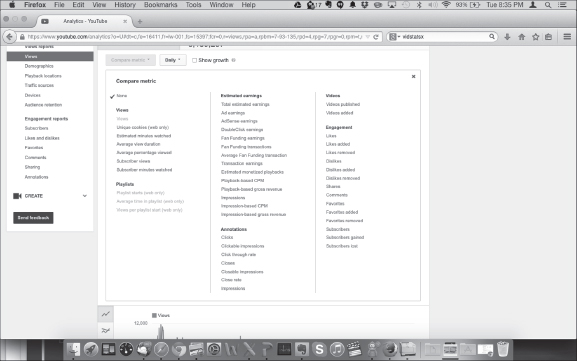
Figure 11-5: Metrics you can show on a YouTube analytics report.
- Graphing controls: You can find additional graphing controls under the Key Metrics banner. Look for the Charting Granularity control just to the right of the Comparative Metrics or More Metrics button. You can graph using daily, weekly, or monthly spans. Depending on the chart, you can also add totals and percentages to see how your data compares with your totals.
- Chart type: YouTube Analytics has six chart types, as indicated by the six icons down the left side of the Chart screen:
- Line: Shows one key metric and a comparative metric over a period that you select. This is effective for showing trends or viewing patterns. For a View report, it would show total view counts for your channel over time. (Figure 11-6 shows a sample line chart.)
- Multi-line: Graphs the side-by-side details of the components of a major metric. For a Views report, it can show the side-by-side graphing of your top videos. (You can customize to show any 25 of your top 200 videos, if you were curious.) This is effective not only for observing the increase in the number of video views but also seeing whether views trend together. (Figure 11-7 shows a multi-line chart.)
- Stacked: Like its multi-line cousin, a stacked chart shows the relative portion attributed to each component while showing the total number of videos compared. (Figure 11-8 highlights a stacked-chart example.)
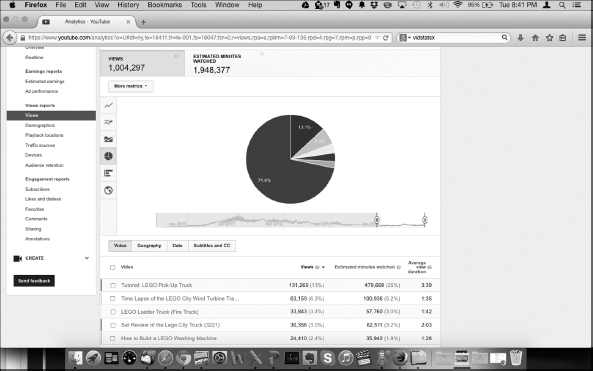
- Pie: An old standby (see Figure 11-9) that can be used to display how items are distributed over a particular period.
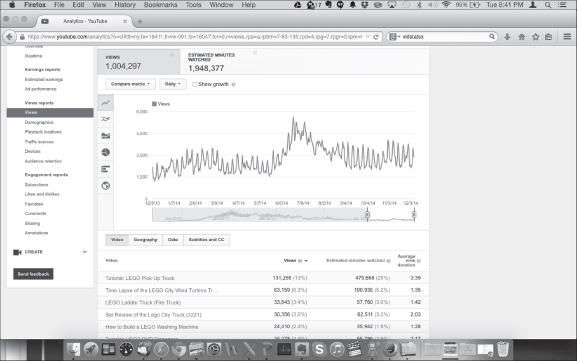
Figure 11-6: Sample line chart.
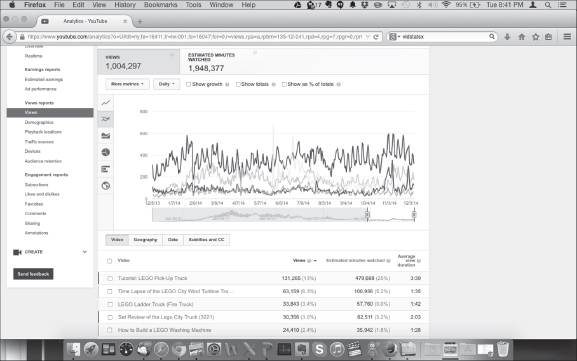
Figure 11-7: Multi-line chart.
Figure 11-8: Going with a stacked chart.
- Bar: Illustrates relative proportions of a selected metric as horizontal bars, as shown in Figure 11-10.
- Map: Reveals a map of the world that displays metrics as you hover the mouse cursor over each country. More active countries for a specified item — views, subscribers, likes, and more — are shown with darker shades so that they stand out, as shown in Figure 11-11.
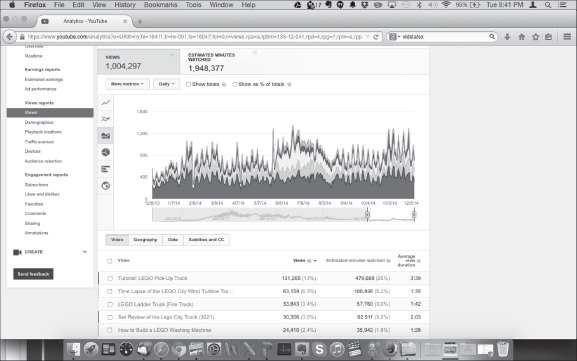
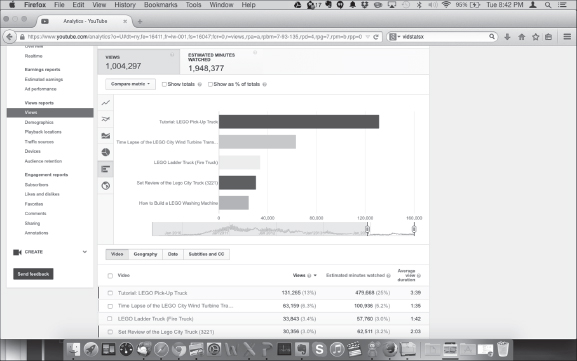
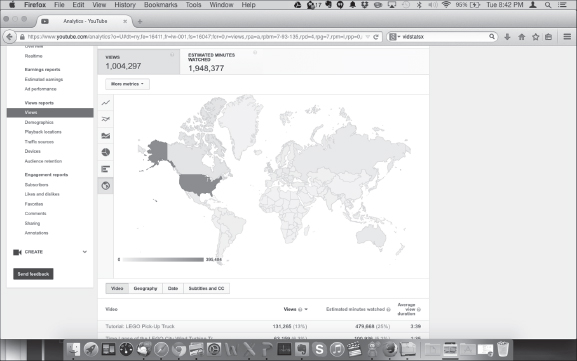
Figure 11-11: An interactive map lets you explore each country.
Pick the chart type and graphing items that best reflect what you're trying to analyze. If you want to see trends, a pie chart or bar chart may not be the best choice. Instead, pick a graph with a strong time axis, such as line, multi-line, or stacked.
 Just because YouTube Analytics lets you graph as many as 25 items doesn't mean that you should do so. In fact, a complicated graph may hide the exact nuggets you're trying to find.
Managing report details
For each chart, YouTube lets you see the detailed information that supports the graph. Just remember that every chart is different and that its features depend on the metrics used. If the chart you're working with has modifiable details, you can find a banner under the graph that you can use to manipulate the chart. Figure 11-12 shows the choices for the Views report, which let you look at details based on the following categories:
- Video: List the top videos for views.
- Geography: Order the top countries that generated the views.
- Date: Show when the views were generated.
- Subtitles and CC: Itemize the viewing language.
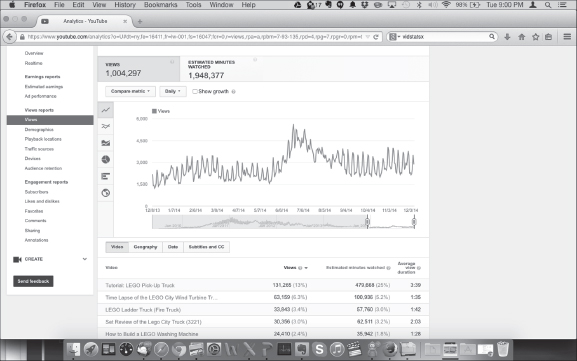
Figure 11-12: Specifying details for a Views report.
Sometimes you want to customize your own charts or combine details of your YouTube Analytics data with other information. You can download your data into a comma-separated values (CSV) file and import it into Microsoft Excel or another common spreadsheet program. To do so, just click the Download Report button on the top right part of the filter section associated with your report.
Learning about Views
YouTube Analytics provides plenty of insights, but you still have to come up with the final answers. To be effective, put on your proverbial Sherlock Holmes hat and pick up a magnifying glass as you sift through all the YouTube metrics clues. To see how that could work, let's look more closely at a specific report type: the Views report.
Seeing which content is the most popular
Like most YouTube channel managers, you want to know which videos are attracting the most views. Getting that info is simple:
- In your web browser, go to www.youtube.com.
- Log on to your YouTube account.
If you see a blue Sign In button in the top right corner of the YouTube home page, enter your email address and password.
- Click on the logged-in icon and choose Creator Studio from the menu that appears.
The Creator Studio navigation menu should appear on the left side of the browser.
- Click the Analytics section of Creator Studio.
By default, it should go directly to the Overview submenu (refer to Figure 11-1).
- In the Analytics Navigation pane, click Views under the Views Report heading.
Doing so brings up a line chart that shows your total views over the last 28 days. (Note: You can change the analysis period by changing the time from the filter section that sits above the graph.)
- Examine the line.
Is it moving up and to the right? Do you see peaks during certain days? Look for patterns and look for spikes, both high and low.
If you see consistent peaks, that means your audience is viewing your content on a regular basis. Think about the programming schedule from Chapter 5, and align it with your audience's viewing patterns. - From the listing running down the left side of the chart area, click the Multi-line Chart icon.
Doing so brings up a chart showing your top five videos, graphed by color. In the Details section, you see a color key matched to each video so that it's clear how one video is performing compared to the others. Select the Video Details button next to the listed video to add and remove videos from the chart.
You won't break anything by looking at the different chart type or changing the analysis timeframe. You should become comfortable navigating and modifying your analysis.
Determining whether viewers are watching or leaving
One of the truly great aspects of YouTube is the detail it can provide about how much of your videos your audiences actually watch. If you're thinking about the view duration, that's partially correct: If you have a 4-minute video and viewers watch only about half the video, you have a 2-minute (or 50 percent) view duration.
View duration, though important, tells only part of the story. A channel manager needs to know more, including the answers to these questions:
- Where is my audience dropping off?
- How does the audience attraction compare with similar videos?
Audience retention — determining the steps you need to take to hold on to your audience — should be a critical part of the analytics process. The Audience Retention report generated by YouTube Analytics allows channel managers to see these two factors:
- Absolute audience retention: You're greeted by a timeline that displays what percentage of your audience views your video. If you have a 3-minute video, you see a retention graph for the entire three minutes aligned with the player for the entire video. You can see exactly where an audience watches and where they drop off.
Don't become upset when you discover that your audience is not watching 100 percent of your videos for their entire duration. Drop-offs are perfectly normal — think about your own viewing patterns on YouTube.
- Relative audience retention: After you realize that you won't have 100 percent audience retention, you need to determine how your retention rates compare with similar content from other channels. Relative retention rates displayed in the Audience Retention report show how your video compares over time and display whether parts are average, above average, or below average.
You can also look at audience retention by playlist; just click the Playlists button in the Filter section of the YouTube Analytics page.
So, does an audience retention report sound intriguing? Here's how to carry one out:
- In your web browser, go to www.youtube.com.
- Log on to your YouTube account.
If you see the blue Sign In button in the top right corner of the YouTube home page, enter your email address and password.
- Click on the logged-in icon to and choose Creator Studio from the menu that appears.
The Creator Studio navigation menu should appear on the left side of your browser.
- Click the Analytics section of Creator Studio.
- In the Analytics Navigation pane, click Audience Retention under the Views Reports heading.
By default, a line chart appears, displaying the average duration of all your channel videos. The Absolute Audience Retention chart is also shown by default.
- In the report's Details section on the bottom part of the page, click on the name of a particular video you want to analyze.
Doing so automatically fills in the video name in the filter section and brings up the audience retention graph.
If you don't see the video you want to analyze for retention, simply use the Filter menu to search for it. - Search for peaks and valleys in the graph. You may be scratching your head and trying to figure out why a peak is showing up on a viewing graph. Your audience may be choosing to rewatch a segment, signaling vital content. The valley represents viewer loss, so look at what's happening at that point in the video below the graph. The cause might be boring or overly long content, which is something that you should consider when editing upcoming content.
- Click the Relative Audience retention button just above the retention graph.
You should determine how your content is performing against comparable videos. If it's consistently below average, look at other content to understand how it's different and why it may be more interesting to the audience than yours.
The watch time plays a crucial role in increasing your video's profile in YouTube search results (as we talk about in Chapter 5). Audience retention provides you with insight you need in order to keep viewers watching.
A retention drop always occurs at the beginning of a video because that's when viewers decide if they've chosen the right video to watch. However, if the drop seems rather precipitous at the beginning, it may be a sign that the title, metadata, or thumbnail is out of sync with what viewers expected when they found the video. Never mislead viewers, and fix any concerns based on what your retention reports indicate.
Understanding Your Audience
View reports and Audience Retention reports are designed to help you understand how well your viewers are responding to your channel content. To find out who's watching your videos, you have to try a different tack: the Demographics report.
Diving into demographics
It helps to know who's watching your content so that you can make important content-planning decisions. The Demographics report in YouTube Analytics is a fascinating way to analyze your audience, because you can get concrete information about your audience members' genders, ages, and countries of residence.
Demographics is a vital chart area that lets you apply a Subscriber Only filter. Sometimes it's interesting to see whether your subscriber demographics mirror your general audience demographics.
To access your demographics, follow these steps:
- In your web browser, go to www.youtube.com.
- Log on to your YouTube account.
If you see the blue Sign In button in the top right corner of the YouTube home page, enter your email address and password.
- Click on the logged-in icon and choose Creator Studio from the menu that appears.
The Creator Studio navigation menu should appear on the left side of your browser.
- Click the Analytics section of Creator Studio.
- In the Analytics Navigation pane, click Demographics under the Views Reports heading.
Gender is the major metric, and both Male and Female are shown by default, as shown in Figure 11-13.
You can focus on only one gender by clicking Male or Female in the banner above the chart. The chart shows a breakout by age bracket and a pie chart split by gender. - Examine the charts and their accompanying details.
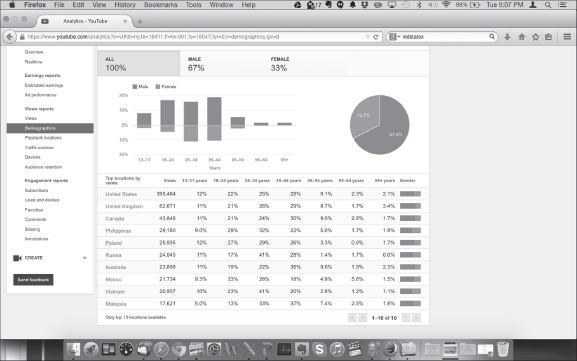
Figure 11-13: YouTube Analytics demographics report.
It's terrific if your audience is exactly what you thought it would be. If it isn't, revisit your assumptions. You may find that your content is having wider interest, which may be a good thing. Conversely, if you're not seeing enough traction, perhaps you're not engaging enough with key creators and fans in your core demographic to help you get the word out.
- Click Show Only Subscriber Views in the Filter section.
Look at how the graphs change. If you see a big difference, determine whether subscription requests are working more broadly than expected, because your content certainly is appealing to others.
Make it a habit to compare your demographic information over time to detect any shifts in your audience.
Diving into subscribers
Knowing your subscribers' patterns and where they subscribe is an important part of your channel management responsibilities. YouTube is well aware of that, which is why it offers a Subscriber report as part of YouTube Analytics. Here's how to access it:
- In your web browser, go to www.youtube.com.
- Log on to your YouTube account.
If you see the blue Sign In button in the top right corner of the YouTube home page, enter your email address and password.
- Click on the logged-in icon and choose Creator Studio from the menu that appears.
The Creator Studio navigation menu should appear on the left side of your browser.
- Bring up the Analytics section of Creator Studio.
- In the Analytics Navigation pane, click Subscribers under the Engagement Reports heading.
You see a line chart with subscription patterns, similar to the one shown in Figure 11-14.
- Look at the report's Details section to see the most popular subscription locations. (You may need to click the Geography tab to see locations.)
You see the number of subscribers lost, too, which is a normal part of channel activity.
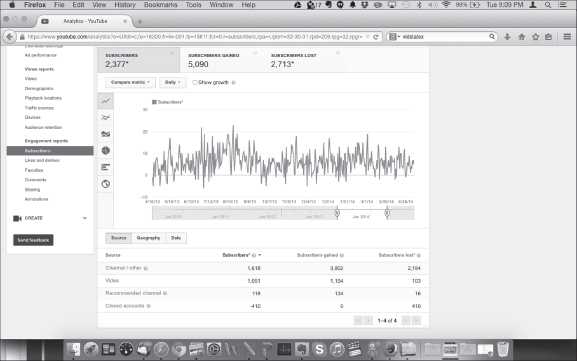
Figure 11-14: Subscribers report.
On some of your reports, you see the label Closed Account, which happens when YouTube purges accounts every so often. You lose subscribers whenever their accounts are closed.
Optimizing Discoverability
YouTube is a huge place, and it's growing every day. YouTube, Google, Bing, and Yahoo! visitors are presented with many options as they search for videos that interest them. In Chapter 5, you find out about the importance of discoverability and its importance for helping YouTube get your content in front of the right viewers so they can watch. Ideally, you want your content offered up first, but that takes some time. (Rome wasn't built in a day, you know.) As a channel manager, you use analytics to figure out whether your quest for discoverability is moving in the right direction.
Seeing where viewers find your content
As your content becomes more popular and relevant for specific viewers, YouTube will offer up your videos as Recommended videos and as part of their search results. These are important ingredients in your overall channel performance. So, too, is community engagement, which helps your content show up on playlists, on websites, in social media, and more. YouTube Analytics can help you determine where your audience is discovering your content.
The Traffic Sources report from YouTube Analytics is designed to show you how viewers discover your content. It includes not only sources within YouTube but also external sites and social media. To see how your viewers find you, do the following:
- In your web browser, go to www.youtube.com.
- Log on to your YouTube account.
If you see the blue Sign In button in the top right corner of the YouTube home page, enter your email address and password.
- Click on the logged-in icon to and choose Creator Studio from the menu that appears.
The Creator Studio navigation menu should appear on the left side of your browser.
- Bring up the Analytics section of Creator Studio.
- In the Analytics Navigation pane, click Traffic Sources under Views Reports.
By default, you see a line chart with aggregate channel views, which is not terribly interesting, so you should change to a more meaningful view.
- In the row running down the left side of the Chart area, click on the Bar Chart icon.
Doing so changes the view into something a bit more interesting — your top five YouTube channel traffic sources. (Figure 11-15 gives you an idea of what such a view looks like.)
- Modify the graph by using the Filter section, or select sources in the Detail section.
- Review your traffic sources.
Sources here might include
- YouTube advertising
- YouTube channel page
- YouTube Guide (YouTube homepage and subscription screen)
- YouTube partner promotion
- YouTube playlists
- YouTube Search
- YouTube Suggested Videos
- YouTube video annotation
- Unknown — direct (mobile apps and external website)
- Unknown — embedded player (views from external websites)
- External app
- External website
- YouTube — other features (analytics, editing screen, and other random stuff)
- Click YouTube Playlists in the Details section.
Doing so brings up all the playlists — yours and others — that include your videos.
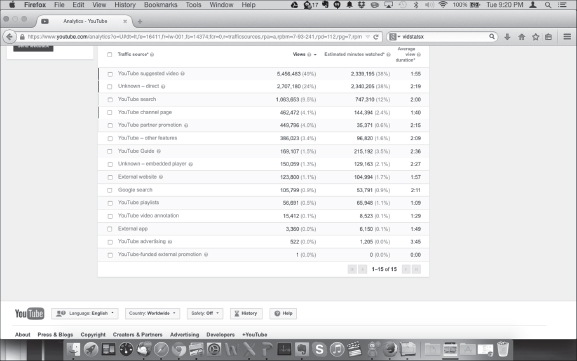
Figure 11-15: Viewing your YouTube channel traffic sources.
Finding out where (and how) viewers watch your content
Channel managers also need to know where their video content was watched and on what kind of devices, including computers and mobile devices. You can get that information with the help of two specific reports:
- Playback Locations: Shows whether the video was viewed from YouTube or an external website or device.
- Devices: Specifies the device format and the operating system used to view video content.
Don't underestimate the importance of how your audience consumes your content. If mobile devices dominate, be sure that your videos don't require a 55-inch plasma display to get your point across.
To determine where your audience is viewing:
- In your web browser, go to www.youtube.com.
- Log on to your YouTube account.
If you see the blue Sign In button in the top right corner of the YouTube home page, enter your email address and password.
- Click on the logged-in icon and choose Creator Studio from the menu that appears.
The Creator Studio navigation menu should appear on the left side of your browser.
- Bring up the Analytics section of Creator Studio.
- In the Analytics Navigation pane, click Playback Locations under the Views Reports heading.
By default, you see a stacked chart with aggregate channel views.
- Modify the chart by using the Filter section or selecting Sources in the Details section.
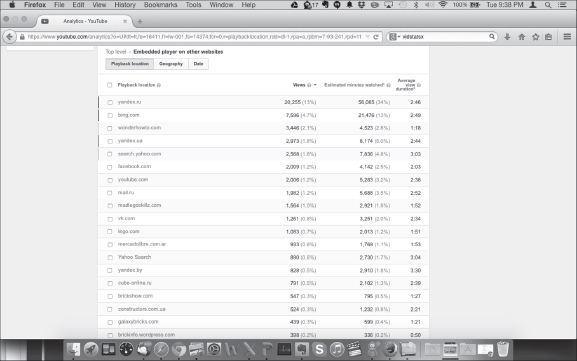
- Click on the Embedded Player on Other Websites link in the Details section.
The report highlighting embedded players appears, as shown in Figure 11-16.
YouTube allows websites to embed your video, which is one of the highest forms of engagement.
Figure 11-16: Reporting your embedded-player locations.
You always get full view credit for embedded videos. If you have a website, feel free to embed videos from your YouTube community and your subscribers as well. It's good practice because it highlights how you interact with your subscribers. - To probe a bit deeper, go back and click Devices under the Views Reports heading.
Under the graph, you can toggle between the device type and the operating system. Here are some popular devices:
- Computer
- Game console
- Mobile
- Tablet
- TV
- Unknown
- To see even more information, click a specific device type or operating system in the Details field.
If you find certain types to be the most popular, you can test your channel by using those particular devices and operating systems. That way, you can ensure that your audience has the best viewing experience possible.
If you're setting up a YouTube channel, chances are good that you have a website. And if you have a website, you're likely to have one or more analytics packages integrated into it, including the most popular one: Google Analytics. The good news here is that you can use Google Analytics for your YouTube channel.
Rather than use your existing Google Analytics tracking ID, create a new property only for your YouTube channel under your existing Google Analytics account. This new tracking ID must then be added to Creator Studio's Channel section under the Advanced tab.
After the new tracking ID is in place, you can follow many of the interactions that visitors are specifically having on your YouTube channel page rather than on your Watch pages or playlists. Google Analytics helps show you what YouTube Analytics doesn't: how viewers discover your channel. Remember that YouTube Analytics shows only how viewers are discovering your content, not your channel as such. With Google Analytics, you can figure out which videos drive the most viewers to your channel.
Making Sure Your Audience Is Engaged
Engagement is all about your viewers going beyond just watching a video. You want them to comment, share, and interact with you. The Engagement report offered by YouTube Analytics lets you look at several types of engagement:
Subscriptions: This feature displays information on subscriber gains and losses, along with specific info about where in the process they are choosing to subscribe.
Like and dislikes: This feature captures details around view sentiment about your content. This category also includes geographical information, which would let you know if some of your content is resonating better in some countries than others.
Favorites: This feature shows which videos are being added to viewers' Favorites playlists.
Comments: This feature highlights those videos that receive viewer comments. Don't forget the date dimension here to find out when most of the comments are posted.
If comments are made in the first few hours after you post a video, you may want to make sure you're always available after posting for immediate engagement.
Sharing: This feature itemizes which videos are shared and shows you which social media service they were shared on. (You might use this latter bit of information to find out whether your community prefers a particular service, such as Twitter or Facebook.)
Annotations: This feature helps analyze the performance of your annotations, showing which ones generate the most clicks.
Getting Engagement Reports
If Engagement reports sound like a good deal, start cranking them out. Here's how to do that:
- In your web browser, go to www.youtube.com.
- Log on to your YouTube account.
If you see the blue Sign In button in the top right corner of the YouTube home page, enter your email address and password.
- Click on the logged-in icon and choose Creator Studio from the menu that appears.
The Creator Studio navigation menu should appear on the left side of your browser.
- Bring up the Analytics section of Creator Studio.
- In the Analytics Navigation pane, click any of the reports under the Engagement Reports heading.
For the purposes of this example, say that you want to see where your viewers chose to subscribe and which countries they came from.
- In the Analytics Navigation pane, click Subscribers under the Engagement Reports heading.
You're presented with a line chart.
- Click Source in the Details section below the chart.
Doing so brings up a list of locations where your subscription activity happened.
- Click Video in the Details section.
Look for particular videos that drove the most subscriptions.
- To discover which countries your subscribers come from, click Geography in the Details section.
You see all the countries where you added and lost subscribers.
You always lose subscribers, no matter how great your channel and content. Why? Often because viewer interests change. You should, however, make sure that the subscribers you gain outnumber the subscribers you lose. - If you prefer a pretty picture, click the Map icon to the left of the chart to graphically show where your subscribers come from. Then click the Geography button under the map.
Figure 11-17 shows your subscriber detail by country.
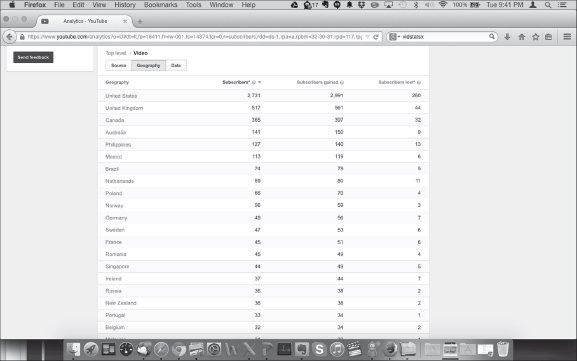
Figure 11-17: Subscriber interactive map with accompanying details.
Analytics and language
You may have discovered that many of your viewers don't come from your own country or speak your language natively. Unfortunately, with your busy schedule as channel manager, creator, or digital brand video guru, you probably don't have time learn a new language — even though you'd love to.
Luckily for you, you can provide captions in a different language — see Chapter 10 for all the details. Use YouTube Analytics to discover what language and countries are most important to your channel. You may be able to collaborate with your fans who are native speakers or with services such as the Google Translator Toolkit (https://translate.google.com/toolkit).
After you have a general idea how to access the Subscribers report, you should be able to apply that knowledge to accessing the other Engagement reports. Drill down into the details to understand exactly what your audience is doing with your content.
Going In-Depth on Annotation Analytics
Regardless of whether you're an independent creator or a business, you often want your audience to do something. Annotations — the clickable elements you can add to a video — can be quite an effective way to help the audience take that action. (If annotations don't ring a bell, check out Chapter 10.) Fortunately, YouTube Analytics helps you determine whether your annotations are effective, which is often important to not only you as a channel manager but also your viewers, who may be looking to do something.
Understanding annotation lingo
If you've ever dealt with any type of web commerce, you'll find the metrics and nomenclature around annotations familiar. If not, you can pick it up rather fast. Here are some key terms to know for annotations:
- Impression: This is the number of times an annotation is shown. If an annotation appears once in a video, for example, and the video is shown 1,000 times but the watch time presents the annotation only 572 times, that's 572 impressions.
- Click: If the viewer clicks on the annotation, that's a click. Note that not all annotations are clickable.
- Click-through rate: This percentage shows the number of clicks divided by the number of impressions. If a video received three clicks for 88 impressions, that would be
 , or a 3.4 percent click-through rate.
 - Closes: If the viewer closes the annotation, it's a close. Note that not all annotations can be closed.
- Close-rate: This percentage shows the number of closes divided by the number of impressions. If a video receives four clicks for 40 impressions, that's
 , or a 10.0 percent close rate.
You see all these metrics in Annotation reports prepared by YouTube Analytics.
Getting your annotation metrics
After you all the “vocab” out of the way, it's time to generate some Annotation reports. Here's how it's done:
- In your web browser, go to www.youtube.com.
- Log on to your YouTube account.
If you see the blue Sign In button in the top right corner of the YouTube home page, enter your email address and password.
- Click on the logged-in icon and choose Creator Studio from the menu that appears.
The Creator Studio navigation menu should appear on the left side of your browser.
- Bring up the Analytics section of Creator Studio.
- In the Analytics Navigation pane, click Annotations under the Engagement Reports heading.
You see a line chart that shows annotation clicks for the last 28 days.
- Use the Report filter to change the timeframe or to select particular content that you want to analyze.
- Click on the major annotation metrics shown in the banner above the chart: Clicks, Click Through Rate, Closes, and Close Rate.
Look for any trends, peaks, or valleys in the graph.
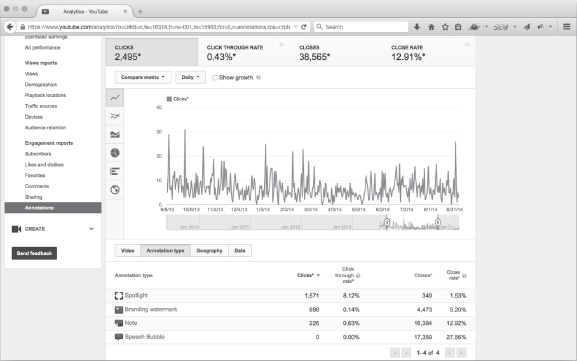
Repeatable patterns, trends, and chart anomalies are your analytics friends. Be on the lookout for them and try to understand why they're occurring. Use chart comparatives and other analytics reports to probe deeper. - Click the Annotation Type tab in the Details section.
This step helps you determine whether your audience prefers a particular type of engagement. Figure 11-18 shows an annotation report with itemized annotation types.
- Click on Video tab in the Details section.
Your top-performing videos, ranked by annotation click, are listed.
If you're not seeing a particular video, go to the Filter section and reset your choices. - Click on the video name to see the annotation performance for a particular video.
You see a list of all annotations, ranked by click frequency.
Clicks tends to attract all the attention, but also pay particular attention to annotations that are closed. A high close rate may be a sign that you're annoying your viewers and risking watch time, unsubscribes, and dislikes. - Click the Video Manager section of Creator Studio to modify or remove annotations.
Analytics gave you the insights, so be sure to take action. Chapter 10 has all the details on annotations.
As a channel manager, you'll continually look at your metrics and make adjustments. That's perfectly normal. There's never one fix, so just keep repeating the process (within reason) until you get it right.
Seeing whether your annotation are working
After you see all these interesting metrics — such as click-through rate (CTR), subscriber growth, favorite additions, and more — you may wonder how your metrics compare. Though you'd probably like to hear that a click-through rate of 3.1345 percent is the norm, you'll quickly see that there really is no single “good” value for a metric. Establish the norm, and continually compare performance among all components of your channel.
A good end-card (see Chapter 10) may have several side-by-side annotations with associated thumbnails. YouTube Analytics is a goldmine in this example because it shows not only the clicks; it also provides insights into what viewers watch next, which thumbnails are drawing attention, and how the thumbnail orientation affects the number of clicks.
Beyond YouTube Analytics
If you have only a few channels and limited programming skills, and you aren't doing any advertising, YouTube Analytics will do a fine job for you. If you want to analyze broader markets on YouTube for competitive reasons or you are interested in selecting places to advertise on YouTube, you need different tools and analytics. The same holds true if you're only looking to see lists of trending videos.
Analytics on YouTube isn't restricted to YouTube Analytics in Creator Studio. There are third-party solutions, such as VidStatsX (www.vidstatsx.com) and Pixability (www.pixability.com), that provide creators, channel managers, and brand marketers with the tools necessary to analyze industry trends, manage multiple channels, and run advertising campaigns. Figure 11-19 gives you a taste of what VidStatsX can offer, in the form of a nice Top 100 list, and Figure 11-20 shows Pixability's analytics for the most influential creators in the beauty industry on YouTube.
Using the YouTube Analytics API
It's quite easy to access YouTube Analytics from your laptop, your tablet, or even your mobile phone. You get some nifty graphs from which you can make some rather powerful decisions about your channel and your audience. But that's not the only way to get the metrics and insights you need in order to run your channel.
You can also access YouTube Analytics via an application programming interface (API). That's tech-speak for having your computer programs talk directly to YouTube and do all sorts of tasks, such as upload videos, grab analytics data, and so much more. A number of powerful video marketing and advertising platforms from companies such as Pixability make extensive use of YouTube APIs.
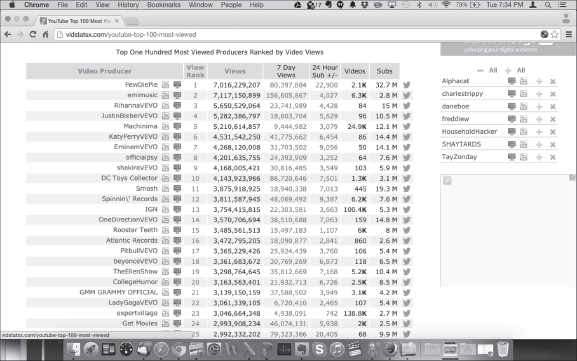
Figure 11-19: Seeing what VidStatsX analytics has to offer.
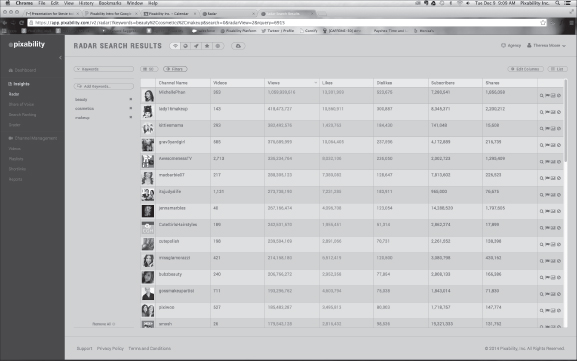
Figure 11-20: Pixability analytics crunches the beauty numbers.
Only you have access to your YouTube Analytics data. Other analytics tools use public information only, often combining data from several different sources to come up with a much broader analytics view beyond just your channel.