
8
Categorization Model for Parkinson’s Disease Occurrence and Severity Prediction
Prashant Kumar Shrivastava*, Ashish Chaturvedi, Megha Kamble and Megha Jain
Department of CSE, Lakshmi Narain College of Technology Group of Colleges, Bhopal, India
Abstract
Machine learning and AI center on empowering PC programs naturally to build their exhibition at certain undertakings through old experience. Healthcare is one of a zone where the utilization of AI can be exceptionally useful. This work depicts the investigation of a few AI procedures for medical healthcare. AI gives the answer for a large number of the old and new healthcare difficulties; AI is comprehensively examined by different scientists and medical professionals. Here, this part introduces a review of healthcare and how AI can be utilized to help diagnosis.
In the case of medical diagnosis, many information-based frameworks are utilized to computerize various activities. For physical impairment based diseases such as Parkinson’s disease, models are generated using gazzetts, questionnaires, surveys, puzzles, activities etc. These Knowledge-based frameworks can be collaborated with AI and machine learning techniques. AI calculations help in mechanizing the tedious procedure of information assembling that is fundamentally for improvement of information-based framework.
Machine learning and AI empowers PC programs consequently to expand their presentation for certain assignments through old information. This field is generally identified with measurable derivation and example acknowledgment. A decent effect of research in AI is center around characterization, the activity of model advancement, from a lot of recently ordered models, which can accurately sort new models from the equivalent dataset.
Parkinson disease (PD) is most typical to handle and irreparable loss cannot be recovered just by medication. Even severity of the same can damage the person and quality of life degrades drastically. Early diagnosis of Parkinson’s will be helpful for elderly person. If examined later this ailment can become hopeless. Henceforth, evaluating the illness at an early stage is critical. Diagnosis of the disease can be done using three major activities. Motor movement, behaviour and Voice impairment. This chapter introduces the investigation for the finding of Parkinson’s diagnosis using different ML (Machine Learning) for categorization and severity prediction through the measure of 16 voice and 8 kinematic feature information accomplished from various archives [1]. The data set includes 40 people with Parkinson’s disease and healthy patients generated with the help of spiral drawings and voice readings. Various machine learning algorithms estimate, including the highest accuracy (94.87 percent) demonstrated by ANN, while Naïve Byes has indicated the least precision (71.79%). The work also predicted severity score by suggesting some scientific measure with prototype dataset.
Keywords: Voice dataset, kinematic features, Parkinson’s disease, SVM, ANN, random forest
8.1 Introduction
The preliminary work for voice disorder detection using speech analysis is introduced by the authors in [1]. The two new tools to speech analysis: recurrence and fractal scaling, is demonstrated to overcome the limitations of existing tools from the literature for speech analysis and integrated approach is diagrammatically presented in a “hoarseness” diagram. A simple bootstrapped classifier is presented to classify normal and disordered voice for the above two speech features. Around 31 people afflicted with early-stage Parkinson’s disease were considered in the preparation of voice frequencies dataset in the year 2007 as presented in [1] were taken as data-set as well by the authors of [2] and the task adopted was remote symptom progression monitoring of voice disorder of diseased persons. Various machine learning algorithms like ANN, Random Forest and Naïve Bayes were applied on this dataset and results are demonstrated with confusion matrix, with accuracy ranging from 71.79 to 94.87%. However, a number of records in dataset and a number of features are limited to demonstrate the conclusion of early diagnosis of the disease.
Parkinson’s is among such health problems which affects body developments, talking, strolling, thinking or doing other ordinary work. Parkinson’s is an illness with a complex neurodegenerative aspect that turns out to be more severe as time passes. The exact reason for Parkinson’s disease isn’t recognized until now. In any case, it is taken as, hereditary and natural elements have an important impact on causing Parkinson’s Disease (PD). There is no therapeutic procedure for PD [7] and medications are only given to reduce the side effects. Indications of Parkinson’s ailment incorporate some symptoms such as tremor, slow development (bradykinesia) [4], inflexibility in muscles, crippled position, loss of modified advancements, and speech changes. As of now, the determination of PD is done accurately only by neuropathological assessment, with the help of symptoms and few physical clinical tests by experts which is time consuming, difficult for caretaker as it is difficult for patient to do lot of movement at times and severity effects are not exact. The outcomes given by this neuropathy [3] logical assessment are normally the probability level of having PD. Voice issue [5] was listed as one of the prominent PD trademarks with 90% of people experience devastation in voice. In these patients, the normal vocal (dysphonia) and verbal and speech-bound (dysarthria) problems are seen.
The dysphonia marker triggers tremor, breath-washing, twitching, and throat. With this in mind, the vocal sound of PD patients creates a fear of most agents in this association between Parkinson and Dysphonia and is now used as an imperative to evaluate Parkinson’s disease. Expanding voice as a research component towards this use also provides a number of benefits; for medical specialists, some are similar to its ease and insensibility. The vocal use of Parkinson’s disease has been checked by [6]. Here, usage of estimation methodology revolves around sound weight, jitter, (frequency wave), and degree of voice tone. This chapter uses a variety of AI techniques for estimation such as K Nearest Neighbors, UCI machine learning, Artificial Neural Network, Support Vector Machine, Kernel method based-SVM, Naïves Bayes, Decision Tree, Random Forest [1], and compares their results on the basis of accuracy. The results are also demonstrated with other performance measures.
Existing work is based on classification of diseased and healthy subject based on drawing images and voice parameters. This chapter aims to provide automatic scoring in addition to diagnosis so that disease severity is also known beforehand and that can be applied for early treatment. Earlier work is focused on voice features and drawing features in separate manner. This chapter provides integrated approach where some factors of voice features can be mapped to scoring scale popularly known as UPDRS (Unified Parkinson’s Disease Rating Scale) which is similar to neurological rate score in actual clinical process. Some neuro toolkits are also available that provide scientific calculator for generating UPDRS score. Based on the study of such calculators, this chapter has evolved with prediction of UPDRS score based on voice feature and kinematic feature dataset for the same.
Significant Contribution in this chapter
- Identification of Spiral Hand movements as an assistant tool in the finding of Parkinson’s disease.
- The hand pressure exerted on the face of plane and grip angle during hand movement to draw spiral shape, are mapped to kinematic features
- The extensive dataset is prepared with above inputs, and there is mixture of static and dynamic test and voice features collected by voice test. This is dummy dataset created and validated using machine learning.
- Strong correlation voice factors are determined and kinematic features are determined and using mean absolute deviation and coefficient of variance, it is mapped to severity UPDRS scale.
The remaining of the article is organized in sections. The second section states about generic applications, and challenges. Section 8.3 describes methodology followed by proposed models in detail in Section 8.4.
8.2 Applications
8.2.1 Machine Learning in PD Diagnosis
This section elaborates the primary techniques of categories of learning: Machine Learning, Autonomous learning, Neural Network, and self organizing networks used previously for PD findings. Additional information in the form of datasets, and set of images are also quoted with corresponding references.
The literature stated about PD patients’ handwriting and speech related noteworthy work. The assessment of tremor in related body parts and scale of severity of the disease is measured partially; the most conventional techniques of Neural Network and regression in recent times are implemented for the same. To improvise the accuracy of the disease finding, this chapter suggests the application of scientific finding tool of PD i.e. Spiral drawing up to some extent. There are evidences that some of the Machine Learning models and enhanced ensemble models work better in likelihoods of disease. Extensive feature engineering supports for exposing more details of symptoms of neurodegenerative disorder.
Authors in [16] stated the scientific method of three types of drawing the spiral and which are then known as test tool namely, Stability Test on a certain fixed coordinate, tracing of spiral in static manner, and tracing on spiral in dynamic manner.
The author [15] recommended the investigation of PD patient handwriting by applying feature selection algorithm and Machine Learning SVM method. This is one of the early works in identifying the magnitude of various in-air/on-surface hand movements while tracing the spiral, and these can be used in finding of motor disorder of neuro degenerative diseases. The outcomes of the paper confirmed the major impact of these kinds of movements during assessment of handwriting with 85.61% prediction accuracy in [14]. PD patients have performed eight different kinds of handwriting tasks and thus stored these handwritten samples into PaHaW PD database presented by the works of 2014. Later on, on the same dataset, the work [15] investigated some additional features. Extensively unique pressure features and some innovative stroke related features are extracted using dynamics of handwriting. The authors implemented three different types of classifiers: KNN, AdaBoost ensemble and SVM to reveal 81% classification accuracy. However, a limitation of the work is lack of consideration of related demographic features in support of handwriting test, and this leads somewhat less practical and effective diagnosis of PD patient. In lieu of this handwriting experiment, Static and dynamic manner of Archimedean spiral based scientific methods of drawing the spiral can be assessed as more pertinent and can be associated with the power of ML methods.
The handwriting as a powerful automatic marker to develop PD finding tool is one of the significant offerings of the authors of [17]. The authors have assumed the same PaHaw dataset and implemented ML classification framework. They obtained better specificity performance measures. The work not only illustrated binary discrimination of the patients into healthy and patients, but above this, the work in the said resource extended to group the patients, on the basis being the degree of severity of the illness, to further support early cure and medication to diseased persons. Though the work has provided extensive dataset, and clustering of patients based on illness, for proper classification, scientific tools of spiral can be extended for simple performance.
The authors [18] also analyzed the kinematic features of micrographia related with the disease when patients are performing the repetitive writing task. The experimental setup illustrated in the work was for samples of letter “e” and this is chosen due to its similarity with spiral pattern. To interpret the experiment, common size of initial five and final five letters were compared. Standard configured test of Wilcoxon signed-rank experimental test evaluated these handwriting samples. Later on they are also diagnosed with Kruskal–Wallis test.
Authors in [19] described the applications of well known machine learning frameworks using support vectors machine, multi-layer perceptron neurons for remotely tracking progress of Parkinson’s. It is difficult to take the patient every time to the clinic and so voice recordings are done periodically and the processed speech signals can be input to the general regression using most common neural network which outputs the Parkinson’s progress. This work is implemented on telemonitoring dataset that consists of the early stage PD patients’ voice recordings and twenty six attributes of voice are considered. This data set is computerized for remote assessment. Customary Performance measures of absolute error, MAE, MSE and correlation coefficients are identified to evaluate the prediction model. The conclusion findings are UPDRS can be mapped with vocal features in superior manner with LS-SVM as compared to other traditional ways. Vocal features are classical and non classical, and non linear in nature. Normalization of voice features after extraction is complex process, that needs wider range for normalization and accuracy level and the signal processing algorithms are needed. This is traditional mechanism to verdict of the neuro degenerative disease like Parkinson’s and in premature stage the symptoms may not be seen keenly in the patient. So UPDRS mapping with only voice features may not lead to accurate diagnosis. Greater computational burden and proneness to over fitting are the two common drawbacks of machine learning model for PD dataset, presented in this literature. To overcome the limitation of diagnosis by only few features either based on voice or drawings, it can be integrated and further instead of classifying them, they can be extended to check the severity of the disease, so that diagnosis and treatment can be done.
The authors [20] poised the thirty seven numbers of scripting samples of the patients which are taking regular medication for the disease. This group is of approximately thirty eight in age and sex-matched persons that did the seven scripting handwriting activities and tasks. Customary kinematic, spatial–temporal handwriting measures and some self defined novel handwriting actions based on entropy are the outcomes. Further signals are breakdown of the handwriting signals. Selected features are categorized with SVM classifier to demonstrate the 88% accuracy with highest sensitivity and specificity. However, this method only contributed to complexity of model without significantly improving the performance. The authors [21], stated that Parkinson’s disease is a progressive and chronic neurodegenerative disorder. The study revealed that as the dopamine-generating neurons degrade over the time or expire, the patients start experiencing difficulty in regular activities of speaking, writing, walking, or other simple tasks. Based on this research and other clinical research, it can be assured that by combining measures of all such activities, extensive data set can be prepared to analyze these symptoms. Patients’ symptoms of regular activities start degrading over time, thus severity in patients start increasing. Most of the work is based on identification of the disease. But this paper projected a methodology for the extrapolation of Parkinson’s disease severity using deep neural networks. Customary dataset of telemonitoring voice signals of patients widely available with UCI was used. It predicted severity by application of ‘TensorFlow’ deep learning library of python. The accuracy values obtained by this method are comparable to the previous research work. However, this method is based on single factor and based on some assumptions of clinical values.
Authors in [22] presented the technique to predict UPDRS score using machine learning algorithms which is relatively a rare approach and significant contribution to the field. Tremor signals collected by wrist wearable device is transformed to dataset and with dimensionality reduction, selected features were trained to automatic scoring of UPDRS. Four ML classifiers are implemented and comparative analysis is done. The authors suggested score on a scale of 0 to 4, describing absence of disease (0), slight tremor (1), mild amplitude changes in writing (2), moderate in amplitude (3) and severe (4). The authors have generated kinematic drawing features by recording hand movement of a person with wrist wearable device. Eighty five patients with PD have participated in the study. A video camera attached to the hand sensor has recorded the patients’ hand movements and two neurologists have evaluated the same. After mutual discussion of two neurologists, UPDRS score is mapped to the corresponding patient recording and stored in the dataset. This is one of the unique efforts for predicting disease severity.
8.2.2 Challenges of PD Detection
Parkinson’s disease is a neurodegenerative disease affecting slowly all daily activities of the person. Clinical tests available are fully based on expertise and may mislead to diagnosis. There is no confirmed medication available for the disease that can partially or completely cure the patient. At an early age, if it is detected there are costly medication methods and therapies available.
Machine learning and deep learning methods are significantly utilized in the Healthcare sector, where the symptoms are available in the form of several facts.
The possibilities of diagnosis of PD using soft computing can be explored for following means
- Brain scans, images
- Handwriting and drawing patterns
- Behavioral instances decoded in some facts
- Speech and Voice signal processing
- Dynamics and kinematics of movement of arms.
The challenges are variety of format representation, for images, signals, datasets and databases [8, 9]. Normalization generally cannot be standardized using clinical methods. Mixed symptoms cannot be categorized into actual causes.
To tackle this problem, this chapter has proposed a prototype work with dummy or prototype dataset, partially contributed by various sources and integrated for data science experiments. The assumptions are stated based on scientific mechanism.
8.2.3 Structuring of UPDRS Score
The researchers have been working for a long time to find out a method to quantify the ill effects. As provided in the literature [23], a well known score of PD, UPDRS is calculated with subscores of the activities: 1. mentation, behavior and mood, 2. activities of daily living 3. motor examination, and 4. complications of therapy such as dyskinesias, clinical fluctuations. These sections comprise a total of 199 features and every feature is quantified on the scale of 0 to 4. By summation of scores and scoring of patient based on questionnaire and symptomatic analysis, automatic score can be calculated and suggested. This is further termed as daily living stage as modification of further research and according to this, disease is classified into one to five stages. Complete follow-up of this neuro toolkit may give extensive exploration for disease severity. However, motor examination subscores are more quantifiable and a distinct significant feature as per our analysis and study of recent research work for the same healthcare sector.
This section elaborates the features on which automatic scoring is done for the given patients and healthy persons. A set of 40 spiral drawings [18] (drawn with dynamic spiral test and static spiral test) is considered. The dataset is comprising of csv files stating x,y,z coordinates, pen pressure, grip angle and timestamp. So in a drawing, csv file contains 1,000 recordings of drawing coordinates. These recordings are processed using kinematics formulae [14, 15] and a csv file of 40 records is prepared. Correlation heatmap is plotted with target as patient or healthy (dependent variable is consisting of 0 or 1) and 38 kinematic features are calculated.
Similarly, 16 biomedical voice features are recorded for these 40 persons, where the values are approximated from the UCI Machine voice dataset. This voice dataset consists of Total UPDRS and Motor UPDRS scores. Table 8.1 tabulated all the features, independent and dependent variables for the proposed work.
Table 8.1 Feature extraction for training dataset.
| Voice features | |
| 1 | M.D.V.P jitter (in %) |
| 2 | M.D.V.P jitter (abs) |
| 3 | M.D.V.P RAP |
| 4 | M.D.V.P PPQ5 |
| 5 | Jitter DDP |
| 6 | Multi-dimensional Voice Program shimmer (in dB) |
| 7 | Shimmer percentage APQ3 |
| 8 | Shimmer percentage APQ5 |
| 9 | M.D.V.P shimmer APQ 11 |
| 10 | MDVP: APQ |
| 11 | Shimmer percentage: DDA |
| 12 | Noise Harmonics Ratio (NHR) |
| 13 | HNR: Harmonics Noise Ratio |
| 14 | Signal Recurrence Period Density Entropy |
| 15 | Detrended Signal Fluctuation Analysis |
| 16 | Signal Pitch Period Entropy |
| Kinematic features | |
| 1 | Standard Deviation Dynamic Radial Velocity |
| 2 | Static Mean Radial velocity |
| 3 | Static Standard deviation radial velocity |
| 4 | Dynamic Mean Radial velocity |
| 5 | Number of changes in dynamic velocity |
| 6 | Number of changes in dynamic acceleration |
| Scoring features | |
| 1 | Motor UPDRS |
| 2 | Total UPDRS |
| 3 | Target (Dependent Variable) (0/1) (Healthy/Patient) |
| 4 | Target 2—Severity Score Class (0/1/2/3) |
The dataset of 40 records with large number of features, correlation matrix, combined correlation matrix and standard deviation, mean absolute deviation, coefficient of variance are implemented by hyperparameter tuning of classification algorithms and the assumptions are also supported by the spiral drawings and voice recordings. Class labels for classification, are tabulated in Table 8.2.
Table 8.2 Severity score class rule.
| Severity class | Rule |
| Healthy (0) | 15 healthy controls data is there |
| Slight (1) | Total UPDRS 5–10, Motor UPDRS 5–20, Kinematic features Mean absolute Deviation. Coefficient of variance less than 50% |
| Mild (2) | Total UPDRS 11–30, Motor UPDRS 21–40, Kinematic features Mean absolute Deviation. Coefficient of variance 50–100% |
| Severe (3) | Total UPDRS >30, Motor UPDRS >50, Kinematic features Mean absolute Deviation. Coefficient of variance greater than 120% |
8.3 Methodology
UCI Machine was acquired from the ML and Intelligent Systems Center a voice dataset [1, 10, 11] for Parkinson’s disease. The dataset contains biomedical voice reports by 32 people in which 21 people show Parkinson’s disease. The final segment shows the “status” set to 1 for PD and to 0 for sound. In the dataset ASCII CSV location was used. The data includes 23 attributes and 196 instances. A dataset for classification and supervision [12, 13] of the learning algorithm was retrieved and executed (decide tree, logistic regression, rander forest, Naive bays, SVM, ANN and neighboring k-related areas). The widespread analysis and comparison of diverse models is conducted using R language. R offers a good graphical interface and is easy to plot charts to view the results. All required libraries are open source and are available for download and import as needed. Libraries supply the necessary functions (if possible) to model, predict and plot. Approximately 80% were used for training after data pre-processing and 20% for testing. With the aid of a confusion matrix, the accuracy achieved by executing the test set is summarized.
Machine Learning has extended into a wide field of research over the previous decades. This has prompted a wide range of sub-spaces, calculations, speculations, and application zones, and so on. The relationship and structure between the various data components are not normally not analyzed manually. Various specialists pick various ways to deal with the facts available in the form of datasets. ML techniques depict the three classes as follows:
- reinforcement learning: This learning evaluates the chosen action, and feedback is not provided on the steps taken because the steps may be incorrect
- unsupervised learning: No assessment is made of the labels as no teacher or set outcomes exist and so based on common characteristic the facts are clustered and then analyzed
- supervised learning: A teacher provides the correct answer, in the form of class label, learning measures the drawback or distance of achieved output and expected outcome and tries to bridge the gap so as to lead towards accurate answer.
8.3.1 Overview of Data Driven Intelligence
The Progression of Data-Driven Artificial Intelligence
The birthplace of Artificial Neural Network began back in 1940s, when the researchers used to talk about how neurons functioned in the human mind. At the popular workshops, the noteworthy man-made reasoning abilities like playing chess games and taking care of basic rationale issues were built up to understand the contribution of AI to the society and man-made problems.
In 1956, Perceptron a scientific model was proposed to mimic the sensory system of social learning with straight improvement. Next, a system model called Adaptive Linear Unit was created in 1959 and had been effectively utilized in useful applications, for example, correspondence and climate determining. The restriction of early computerized reasoning was likewise censured because of the trouble in taking care of non-straight issues, for example, exclusive OR (or exclusive NOR) order. With the advancement of Hopfield arrange circuit man-made reasoning ventured forward to the subsequent upsurge (the 1980s). The calculation for Back Propagation (BP) was suggested in 1974, in order to address non-straight problems in a complex neural system. Arbitrary mechanisms were introduced in the Hopfield system and Boltzmann (BM) was established in 1985 with the development and advancement of factual learning.
In any case, these conventional AI strategies require human aptitude to include extraction to decrease the element of information, and accordingly their presentation profoundly depends on the designed highlights. The introduction of profound gaining benefits not just from the rich gathering of customary AI strategies, yet additionally the motivation of factual learning. Profound learning utilizes information portrayal adapting instead of unequivocal designed highlights to perform undertakings. It changes information into unique portrayals that empower the highlights to be educated. Restricted Boltzmann Machine (RBM) was created in the year 1986 by getting the likelihood dispersion of Boltzmann Machine and the concealed layers were utilized as highlight vectors to describe the information. In the interim, Auto Encoder (AE) was proposed utilizing the Greedy learning calculation in layered manner to limit the misfortune work. In 1995, a neural system with coordinated topology associations between neurons, called Recurrent Neural Network (RNN), was proposed for include gaining from succession information. In 1997, an improved variant of repetitive Neural system, named Long transient Memory (LSTM), was proposed to handle the evaporating angle issue and manage complex time grouping information. In 1998, Convolution Neural Network (CNN) was advanced to deal with two dimensional information sources (for example picture), in which highlights learning were accomplished by stacking convolution layers and pooling layers As the various leveled structures of profound learning models getting further, model preparing and parameter enhancement become increasingly troublesome and tedious, in any event, prompting over fitting or nearby advancement issues. Numerous endeavors were made to grow profound learning models, yet no agreeable execution was accounted for before 2006. Profound Belief Network (DBN) was created and made progress in 2006 It permitted bidirectional associations in top layer just as opposed to stacking RBMs straightforwardly to lessen computational unpredictability, and the factors were successfully trained through layer-wise pre-preparing and adjusting. In the meantime, it was proposed to add increasingly shrouded layers and it was named deep auto encoder. It is useful to manage high nonlinear information of the model factors. Some parameters were right off the bat pre-prepared utilizing an eager layer-by-layer solo learning calculation and afterward calibrated utilizing BP calculation. After one year, Sparse Auto Encoder (SAE) was advanced to lessen dimensionality and learn inadequate portrayals. Deep learning increased expanding ubiquity. In 2010, Demising Auto Encoder was exhibited to recreate the stochastically tainted info information, and power the shrouded layer to find increasingly vigorous highlights. In 2012, profound convolution neural network demonstrated prevalent execution in picture finding. In 2014 it was introduced and featured two separate models that were operating as rivals. Generative Adversarial Network (GAN) The generative model was intended to provide irregular example, while the discriminatory model was used to prepare and group genuine and arbitrary examples. In 2016, a consideration based LSTM model was proposed by incorporating consideration component with LSTM. These days, an ever increasing number of new models are being grown even every week.
8.3.2 Comparison Between Deep Learning and Traditional Machine
Learning both profound learning and customary AI are information driven man-made consciousness methods to demonstrate the perplexing connection among information and yield not withstanding the high progressive structure, profound adapting likewise has particular traits over conventional AI as far as highlight learning, model development, and model preparing. Profound learning coordinates include learning and model development in one model by choosing various pieces or tuning the parameters by means of start to finish improvement. Its profound engineering of neural nets with many shrouded layers is basically staggered non-direct activities. It moves each layer’s portrayal (or highlights) from unique contribution to increasingly disconnected portrayal in the higher layers to locate the confounded intrinsic structures. For instance, the highlights, for example, edge, corner, form, and item parts, are disconnected layer-by-layer from a picture. These disconnected element portrayals are then contribution to the classifier layer to perform order and relapse errands. In general, profound learning is a start to finish learning structure with the base human induction, and the parameters of profound learning model are prepared together. Despite what might be expected, conventional AI performs include extraction and model development in an isolated way, and every module is built bit by bit. The carefully assembled highlights are right off the bat separated by changing crude information into an alternate area (e.g., measurable, recurrence, and time-recurrence space) to take the delegate data requiring master area information. Next, include choice is performed to improve the importance and diminish the fake repetition among highlights before nourishing into the AI model. Conventional AI procedures as a rule have shallow structures with all things considered three layers (for example info, yield, and one shrouded layer). Subsequently, the presentation of the built model not just depends on the advancement of received calculations [12, 13] (for example BP Neural Network, Support Vector Machine, and strategic relapse), yet additionally is vigorously influenced by the carefully assembled highlights. For the most part, the element extraction and choice are tedious, and profoundly rely upon space information.
In this manner, profound learning has unmistakable distinction with conventional AI procedures as showed. The significant level dynamic portrayal in include learning makes profound adapting progressively adaptable and versatile to information assortment. Since the information are disconnected, the assorted information types and sources don’t have.
8.3.3 Deep Learning for PD Diagnosis
Deep learning has become an accepted technique for successfully analyzing unstructured data like speech and audio signals, handwriting, and drawings. Deep neural networks use multiple layers of neurons and are used as multi classification and feature selection models. Classes are learned by the network with gradient mechanism by correlating number of input data and epochs for improvising learning. Activation functions also play a significant role. Generic comparison is depicted in Figure 8.1.
8.3.4 Convolution Neural Network for PD Diagnosis
Convolution Neural Network (CNN) is a multi-layer feed forward fake neural system which is initially proposed for two-dimensional picture preparing. It has likewise been examined for one-dimensional successive information investigation including normal language handling and discourse acknowledgment as of late. In CNN, the component learning is accomplished by rotating and stacking convolution layers and pooling tasks. The convolution layers convolve with crude information utilizing various neighborhood piece channels and create invariant nearby highlights. The consequent pooling layers remove the most critical highlights with a fixed-length. Generic architecture is depicted in Figure 8.2.

Figure 8.1 Comparison between two techniques: (a) traditional machine learning, (b) deep learning.
Figure 8.2 Architecture of CNN.
8.4 Proposed Models
The algorithms selected for solving the categorization problem are Logistic Regression and ensemble model Random Forest. These models are famous for their high interpretability and their effectiveness and so can handle imbalanced and voluminous dataset. The class weight in these models was attuned so as to inversely proportional to class frequency as given in the input data. Some state-of-the-art supervised machine learning algorithms SVM Support Vector Machine and K-nearest neighbor Classification have also been employed. Naive Bayes classifiers and decision tree classifiers are employed for comparative analysis.
8.4.1 Classification of Patient and Healthy Controls
Logistic regression is the probabilistic model and may be used in parallel with subordinated variable. The calculated reoccurrence is a thorough evaluation, similar to any other retroactive exam. Connection b/w at least one ostensible/interim/ordinal/proportion level autonomous factors and the paired ward variable can be translated well with the assistance of strategic relapse.
The K-nearest algorithm (k(10)-NN) is a non-parametrical technique and can be used as a regress or a classifier. It is an example of appreciation model and is also referred to as a humble student, because he does not create a model at the time of learning. The preparation is processed only. The return value in KNN is a class. When another article is added, its nearest K neighbors are categorized into the classes they have a position, and the new item is placed in the class that has earned the greatest votes. In the recession k-NN the new item has the value the normal value of its nearest neighbors’ K estimates.
Figure 8.3 Logistic regression confusion matrix.
Support vector machines (SVMs) [14] come under directed learning model and examinations the information utilized for relapse/order investigations. The SVM calculations use preparatory tests that have a place each with two classes and make the new component master into a class or a class, making it an unlikely two-way direct classifier. The SVM model sees events as spatial centres, so that the models with various groups are separated via a sensitive broad aperture. It is mapped to that corresponding space when another article is to be organized. In light of the hole to which it has a place, it is anticipated to have a place with that classification.
Kernel methods (SVM) goes under class of example investigation & Support Vector Machine (SVM) is its most broadly utilized strategy. The primary aim of model evaluation approaches is to know and evaluate in datasets the general types of relationships (such as head parts, ranks, packages, orders, associations). The rough data in the dataset has to be converted unmistakably to vector depictions which are a partial map defined by the consumer. A customer-defined part can be imported from the R libraries regularly for the SVM bit.
Naive Bayes classifiers use of Bayes hypothesis. It relies on Bayes inference with strong and free assumptions between the characteristics. In view of the probabilistic relation between the class and the features it is generally called probabilistic classificatory. He is unwittingly versatile and does not look for a deterministic relationship. The arrangement is made directly by checking a shut structure statement, not least by using a pathway measurement used by different categorizers.
Decision Tree is a reflection of hubs and bends. The decisions are made in the hubs and one of the children is chosen depending on the result from the hub. It occurs until the leaf hub reaches the final category of the event. It is used in knowledge mining and AI models in general. The method starts from the root and finishes in a single leaf. Branches are used to connect highlights which ultimately induce class marks arranged on the leaves. Relapse trees have unceasing values in objective conditions.
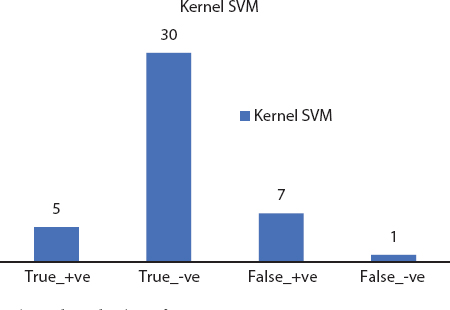
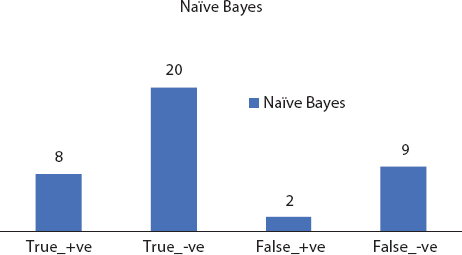
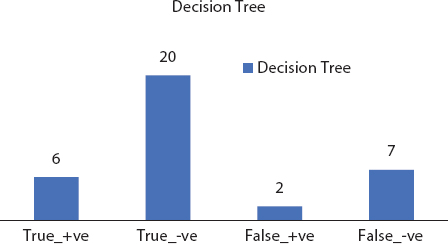
Figure 8.8 Decision tree confusion matrix.
Random forests are expansion of choice trees. They build various choice trees which are produced using arbitrary covering sets of information and traits. The consolidated element of covering sets and arbitrary choice disposes of overfitting. It uses a recurrence/arrangement learning strategy and yields the results dependent on the average trees’ expectations. By consolidating the trees in their vast number, the individual mistakes and limitations of choice trees can be overwhelmed. Figures 8.3 to 8.8 depicts the significant evaluation factor confusion matrix for the deployed machine learning models.
8.4.2 Severity Score Classification
Classification Using Artificial Neural Networks (ANNs)
Severity Class Prediction Using ANN
Neural networks are often compared to decision trees because both methods can model data that has nonlinear relationships between variables, and both can handle interactions between variables. The neural network needs to start with some weights and then iteratively update them to better values. The term kernel initializer is a fancy term for which statistical distribution or function to use for initializing the weights. In case of statistical distribution, the library will generate numbers from that statistical distribution and use as starting weights. Default learning rate 0.001 and Exponential decay rate 0.9 is with optimizers. By changing and training it rigorously, we can get new parameter setting.
Optimizers are algorithms or methods used to change the attributes of your neural network such as weights and learning rate in order to reduce the losses. Optimization algorithms or strategies are responsible for reducing the losses and to provide the most accurate results possible. Adam (Adaptive Moment Estimation) works with momentums of first and second order. The intuition behind the Adam is that we don’t want to roll so fast just because we can jump over the minimum, we want to decrease the velocity a little bit for a careful search. In addition to storing an exponentially decaying average of past squared gradients like AdaDelta, Adam also keeps an exponentially decaying average of past gradients M(t).
A neural network is a computational subdomain under domain of machine learning that can help in predictions based on existing independent data. Neural network model is fruitful for non-linear, complex data relationship. The severity class of PD non-linearly varies for number of voice features and kinematic features. For this proposed work, neural network is built in Keras to solve regression problem with as much accuracy as possible. Keras is an Google API developed to run high level neural network. Figures 8.9 and 8.10 depicted confusion matrix for ensemble models for the given dataset.
We are using the six (6) significant input variables (kinematic dataset for spiral drawings), along with seven hidden layers of 22 neurons correspondingly, and finally using the linear activation function to process the output. We are training our model over 1,000 forward and backward passes, with the expectation that our loss will decrease with each epoch, meaning that our model is predicting the value of y more accurately as we continue to train the model. Adaptive optimization methods Adam, RMSprop and NAdam are also implemented in upper layer of gradient descent to tune hyper parameters of the neural network and obtained superior r2_score that closes the generalization gap.
Major Steps of Proposed Multi Classification Model
- Weights were initialized using the hyper parameter tuning and 10 different kernel initializes
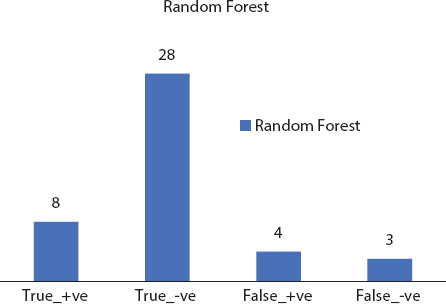
Figure 8.9 Random forest confusion matrix.
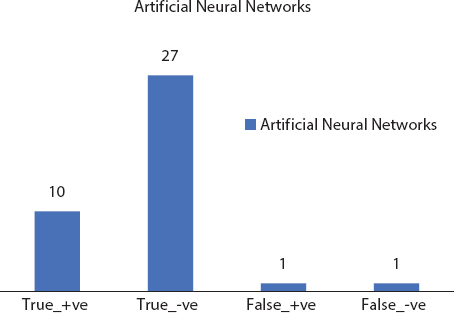
Figure 8.10 ANN confusion matrix.
- Forty samples, in a single batch are used in an advance pass through the neural network and generated Z-values and activations for all the layers
- The loss was back propagated through the neural network layers for generating the gradients
- Each step involves using the model with the current set of internal parameters to make predictions on some samples, comparing the predictions to the real expected outcomes, calculating the error, and using the error to update the internal model parameters.
- This update procedure is different for different algorithms, but in the case of artificial neural networks, the back propagation update algorithm is used.
- The neural network starts its iteration with some random weights and then iteratively update these weight values with better modifications. The underlying concept is transforming non linear input data from input data space to output data space in a layered manner and this is done by mathematical concept called as kernel function. This neural network is designed with eight layers for this non-linear transformation using kernel. Initial step is to do kernel initialization, the process in which neural network weights are initialized with some values with definite logic. The library functions will generate numbers based on some statistical distribution and these numbers play the role of weights. Initialization of layer weights is a very important aspect of deep neural network as it is directly related to the performance of the NN model.
- There are default parameters available for neural network, the proposed method suggests hyperparameter tuning with kernel initialize and generated 10–12 models of deep neural network with weight initializer. The experiment is done to find suitable hybrid model and its influence on the nonlinear kinematic and voice data set training process for the solar irradiance prediction. Following weight initializers (kernel initializers) are combined with Relu activation function. Relu is effective and less complex as it spins half of the Z-values (the negative ones) into zeros, effectively removes about half of the variance and it simply doubles the variance of weights to compensate it.
8.5 Results and Discussion
UCI’s Parkinson’s Telemonitoring Voice Data Set of patients provides biomedical voice features. A lot of research has been done to predict Parkinson’s disease in a patient, but less work has been reported to guess its severity. In majority of the reported research, the features extracted from speech signals are used for predicting the severity of PD. The proposed methodology for predicting the Parkinson’s disease severity using deep learning is presented with detailed neural network diagram. In first step, the voice data of PD patients is collected for analysis. Then the collected data is combined with kinematic features extracted from two types of spiral drawings. In the subsequent step, deep neural network is planned with input layer and output layer with varying hidden layers. The number of neurons in the input layer is fixed as the number of attributes in the input data which are six significant kinematic features [16], motor UPDRS and Total UPDRS. The output layer contains four neurons corresponds to the four classes: healthy, slight, mild and severe. The preprocessed data is fed into the constructed deep neural network for training and testing. The various attributes of the data are subject number, subject age, subject gender, time interval, Motor UPDRS, Total UPDRS and 16 biomedical voice measures, kinematic features stated in Table 8.1.
For this dataset, regression is applied to predict UPDRS score based on six highly correlated factors and severity is marked for four classes. Standard deviation and coefficient of variance is calculated for these six highly correlated factors and prediction accuracy is 90%.
8.5.1 Performance Measures
Sensitivity, specificity and precision of algorithms given in Eqs. (8.1), (8.2), and (8.3) are calculated using:
Where, TP is True_+v e and FP is False_+
TN is True+-v e and FN is False_-v e
P is Summation of all Positives
N is Summation of all Negatives
- R2_score: R-squared is a numerical measure of how close the data are to the fitted regression line. It is also known as the coefficient of determination. It describes the extent to what the variance of one variable explains the variance of the second variable. In short, it comments how much variation of a dependent variable is explained by the independent variable(s) in a regression model. Refer to Table 8.3 for tabular analysis of the three performance measures for the implemented models and relatively better performing model of ANN is also stated.
Table 8.3 Performance measures and comparative analysis.
| Classification | (Healthy/patient) | ||
| Models | Sensitivity | Specificity | Accuracy |
| Logistic Regression | 60 | 86.2 | 79.48 |
| K(10)NN | 83.31 | 84.84 | 84.61 |
| SVM | 83.33 | 84.84 | 84.61 |
| Kernel SVM | 99 | 82.85 | 84.61 |
| Naïve Bayes | 47.05 | 90.90 | 71.79 |
| Decision Tree | 46.66 | 87.50 | 71.79 |
| Random Forest | 77.77 | 90 | 87.17 |
| ANN | 90 | 96.55 | 94.87 |
| Severity Class | |||
| ANN when used for prediction of Severity class produced R2 score 90.4% | |||

Figure 8.11 Performance evaluation.
8.5.2 Graphical Results
Graphical analysis of the three performance measures for the implemented models is demonstrated in Figure 8.11 to present comparative matter at a glance. The findings were resolved with a method of uncertainty. The test sample consisted of 20% of the first set of data and the accuracy of the chaos cross section was calculated. Best results were achieved with 94.87% accurate artificial neural frameworks and least 71.79% was produced by decision tree. Each of the models is performed with R libraries and the precise tuning of the parameter has been achieved with ANN.
8.6 Conclusion
Parkinson’s disease is a neurodegenerative disease and affects the quality of life of a patient. Early detection of the disease is helpful for better treatment. This chapter has contributed to find out the health of the patient and also stated the severity of the disease with scientific measures. The work demonstrated Artificial Neural Networks with best accuracy for categorization and severity score prediction. This work is helpful for critical healthcare applications.
References
1. Little, M.A., McSharry, P.E., Roberts, S.J., Costello, D.A., Moroz, I.M., Exploiting nonlinear recurrence and fractal scaling properties for voice disorder detection. Biomed. Eng. Online, 6, 1, 23, 2007.
2. Marar, S., Swain, D., Hiwarkar, V., Motwani, N., Awari, A., Predicting the occurrence of Parkinson’s Disease using various Classification Models, in: 2018 International Conference on Advanced Computation and Telecommunication (ICACAT), IEEE, pp. 1–5, December, 2018.
3. Dickson, D.W., Braak, H., Duda, J.E., Duyckaerts, C., Gasser, T., Halliday, G.M., Litvan, I., Neuropathological assessment of Parkinson’s disease: Refining the diagnostic criteria. Lancet Neurol., 8, 12, 1150–1157, 2009.
4. Fahn, S., Description of Parkinson’s disease as a clinical syndrome. Ann. N. Y. Acad. Sci., 991, 1–14, 2003.
5. Little, M., McSharry, P., Hunter, E., Spielman, J., Ramig, L., Suitability of dysphonia measurements for telemonitoring of Parkinson’s disease. Nat. Prec., 2008. https://doi.org/10.1038/npre.2008.2298.1
6. Singh, N., Pillay, V., Choonara, Y.E., Advances in the treatment of Parkinson’s disease. Prog. Neurobiol., 81, 1, 29–44, 2007.
7. Shulman, J.M., De Jager, P.L., Feany, M.B., Parkinson’s disease: Genetics and pathogenesis. Annu. Rev. Pathol.-Mech., 6, 193–222, 2011.
8. Van Lancker Sidtis, D., Cameron, K., Sidtis, J.J., Dramatic effects of speech task on motor and linguistic planning in severely dysfluent parkinsonian speech. Clin. Linguist. Phon., 26, 8, 695–711, 2012.
9. Zhang, J., Xu, W., Zhang, Q., Jin, B., Wei, X., Exploring risk factors and predicting UPDRS score based on Parkinson’s speech signals, in: 2017 IEEE 19th International Conference on e-Health Networking, Applications and Services (Healthcom), IEEE, pp. 1–6, 2017, October.
10. Wibawa, M.S., Nugroho, H.A., Setiawan, N.A., Performance evaluation of combined feature selection and classification methods in diagnosing Parkinson Disease based on voice feature, in: 2015 International Conference on Science in Information Technology (ICSITech), IEEE, pp. 126–131, 2015, October.
11. Sapir, S., Ramig, L., Fox, C., Speech and swallowing disorders in Parkinson disease. Curr. Opin. Otolaryngol. Head Neck Surg., 16, 3, 205–210, 2008.
12. Gil, D. and Manuel, D.J., Diagnosing Parkinson by using artificial neural networks and support vector machines. Glob. J. Comput. Sci. Technol., 9, 4, 63–71, 2009.
13. Sriram, T.V., Rao, M.V., Narayana, G.S., Kaladhar, D.S.V.G.K., Vital, T.P.R., Intelligent Parkinson disease prediction using machine learning algorithms. Int. J. Eng. Innov. Technol., 3, 212–215, 2013.
14. Drotar, P. et al., Analysis of In-Air Movement in Handwriting: A Novel Marker for Parkinson’s Disease. Comput. Methods Programs Biomed., 117, 3, 405–411, 2014.
15. Drotar, P. et al., Evaluation of handwriting kinematics and pressure for differential diagnosis of Parkinson’s disease. AI Med., 67, 39–46, 2016.
16. Impedovo, D. et al., Dynamic Handwriting Analysis for Supporting Earlier Parkinson’s Disease. Information, 9, 10, 247, 2018. https://doi.org/10.3390/info9100247.
17. Impedovo, D. and Pirlo, G., Dynamic Handwriting Analysis for the Assessment of Neurodegenerative Diseases: A Pattern Recognition Perspective. IEEE Rev. Biomed. Eng., 12, 209–220, 2019.
18. Poonam, Z. et al., A Kinematic Study of Progressive Micrographia in Parkinson’s Disease. Front. Neurol., 10, 403, 1–8, 2019.
19. Eskidere, O. et al., A Comparison of regression methods for remote tracking of Parkinson’s disease progression. Expert. Syst. Appl., 39, 2012, 5523–5528, 2012.
20. Drotar, P. et al., Decision Support framework for parkinson’s disease based on novel handwriting marker. IEEE Trans. Neural Syst. Rehabil. Eng., 23, 3, 508–516, 2015.
21. Grover, S. et al., Predicting Severity Of Parkinson’s Disease Using Deep Learning. Proc. Comput. Sci., 132, 1788–1794, 2018. https://doi.org/10.1016/j.procs.2018.05.154.
22. Jeon, H. et al., Automatic classification of tremor severity in Parkinson’s disease using a wearable device. Sensors, 17, 2067, 2017.
23. Ramaker, C. et al., Systematic evaluation of rating scales for impairment and disability in Parkinson’s disease. Mov. Disord., 17, 5, 867–876, 2002. https://www.neurotoolkit.com/updrs/.
*Corresponding author: [email protected]
Prashant Kumar Shrivastava: ORCID: orcid.org/0000-0003-1409-1014
Ashish Chaturvedi: ORCID: orcid.org/0000-0002-2604-3370
Megha Kamble: ORCID: orcid.org/0000-0001-7466-1504
Megha Jain: ORCID: orcid.org/0000-0002-3705-5043