
3
An Overview of the Papua New Guinea Economy
3.1 Introduction
This chapter provides information about the resources base, structure of the economy, institutional settings, characteristics of the labour market, importance of foreign trade and the major macroeconomic policies.
The chapter is organised into ten sections. Section 3.2 discusses political background; Section 3.3 sketches economic performance; Section 3.4 presents the structure of the economy; Section 3.5 discusses the characteristics of the labour market; Section 3.6 describes the role of the public sector; Section 3.7 provides a financial sector overview; Section 3.8 describes external trade patterns; Section 3.9 discusses macroeconomic policies; and Section 3.10 summarises the economy’s key features.
3.2 Political Background
Papua New Guinea (PNG) comprises the eastern half of the island of New Guinea, called the mainland, the Bismarck Archipelago, and the northern part of the Solomon Islands, together with hundreds of small offshore islands between the Coral sea and South Pacific ocean. PNG was colonised at various times by Australia, European powers and Japan.
A Papua New Guinean-controlled central government was formed in 1972. The territories of Papua and New Guinea became a self-governing country on 1 December 1973. PNG became fully independent from the Australian administration on 16 September 1975, although the ties between PNG and Australia remained very close. The British monarch, represented by a Governor-General, is head of state, but the real leadership is exercised by the Prime Minister. The country consists of twenty provinces with a central government in Port Moresby. The National Parliament, a Westminster-style structure, consists of one hundred and nine representatives, democratically elected every five years.
3.2.1 Geography and Resource Base
New Guinea is located in the second largest island in the world, with a land area totalling 462.8 thousand square kilometres and a sea area of 3.1 million square kilometres. Most of its total land area is situated on the eastern half of the island of New Guinea. The main island is divided between PNG and Indonesia.
PNG is in the humid tropics and displays little variation in temperature. Its land-mass is dominated by rugged mountainous terrain which means that many villages and clans are isolated from each other. Approximately 30 per cent of the total land area of 460,000 square kilometres is classified as suitable for agricultural development but only about one quarter of this is regularly used for agriculture, representing about 7 per cent of the total land area. Nearly 360,000 square kilometres of forested area covers about 78 per cent of the country (AIDAB, 1991).
The total population of PNG was around 5.13 million in 2000, is predominantly Melanesian, rural-based, and growing at about 3.1 per cent per annum between 1990 and 2000. More than 700 different local languages and dialects are spoken with allegiances closely tied to villages. English, Tok Pisin and Motu are the official PNG languages. The education system is controlled by the government but primary education is not compulsory. As a result primary school enrolment is much lower (only 70 per cent in 1992) compared to other lower-middle income countries (100 per cent in 1992) as shown in (Appendix Table A3.1).
PNG is abundantly endowed with renewable and non-renewable natural resources. This abundance of natural resources has given the country considerable developmental potential in agriculture, forestry, fisheries, tourism, minerals and petroleum, and agro-processing activities. PNG has some of the world’s richest gold and copper deposits, and became a producer of oil from the early 1990s. PNG also has good potential for the supply of liquefied natural gas and methanol (AIDAB, 1994, p. 183).
3.2.2 Stages of Social Development
According to the Human Development Report 1995, published by the United Nations Development Program (UNDP), PNG ranked 126th out of 174 countries, based on a human development index, a composite measure of income per capita, life expectancy and literacy rates (AusAID, 1996). PNG’s rank worsens to 133 in 2002 in the UNDP Human Development Index compared to 122 in 2001. Apparently, about a fifth of PNG’s population are currently living in poverty. With a GNP per capita estimated at US$810 in 1999, Papua New Guinea is ranked as a lower-middle income developing country (World Bank, World Development Indicators, 2002a). Its middle income status is somewhat misleading, however, in terms of some basic social indicators, PNG more closely resembles countries which are classified as low-income economies (GNP per capita of $650 and below).
Life expectancy at birth is about 59 years, the adult literacy rate is 65 per cent, and primary-school enrolment rose to about 84 per cent in 2000. These social indicators are substantially below those seen in PNG’s major neighbouring countries in the South Pacific and South-east Asia (for example, Fiji, Tonga, Thailand and Malaysia). However, PNG has achieved reasonable improvement in some key social indicators, compared with other low-income countries, including female and male life expectancies, infant mortality rates, and crude birth and death rates (Appendix Table A3.1).
PNG faces enormous economic and social problems in its efforts to develop its physical and human resources. PNG is characterised by its poor infrastructure. Only two thirds of the population is within the reach of a road. The rugged terrain, widely dispersed population centres, and low level of market oriented activities of the country present barriers to effective and low-cost transport and communications. As a consequence, fragmentation of the domestic market has increased production costs. The short supply of basic human skills, capital and entrepreneurship has resulted in a heavy dependency on external investment and highly paid foreign skilled workers.
The concept of private property is not well established. The traditional redistribution system of ‘Wantok’ provides a valuable safety net for the community in times of sickness and distress, but also reduces individual incentive, in terms of entrepreneurship and wealth accumulation. About 97 per cent of land is owned in the traditional manner with the remainder owned by the government. The availability of land is limited because of the disorganised administration of land tenure arrangements. Traditional owners of land have only agreed to a small portion of land in the major cities being converted from customary ownership to a leasehold form. There is no formal market for small pieces of land. As lenders prefer secure collateral, the insecurity of land tenure also limits access to finance. There is under-utilisation and under-investment in improving the productivity of land due to major divergence between private and social value of land (Jarrett, 1985). In addition to these limitations, increased social tensions and serious law and order problems remain a major impediment to both private investment and development in general. The provision of law and order services suffer from lack of proper management, poor training and skills, inadequate supervision, poorly articulated policies and implementation of policies in a timely fashion. Thus lack of law and order condition escalates the cost of providing other critical services. The problem of lawlessness is not only confined to the towns. Increased incidence of robberies on the High Land’s highways during the harvest season also directly reduce the income of rural people (Jarrett and Anderson, 1989).
3.3 Economic Performance
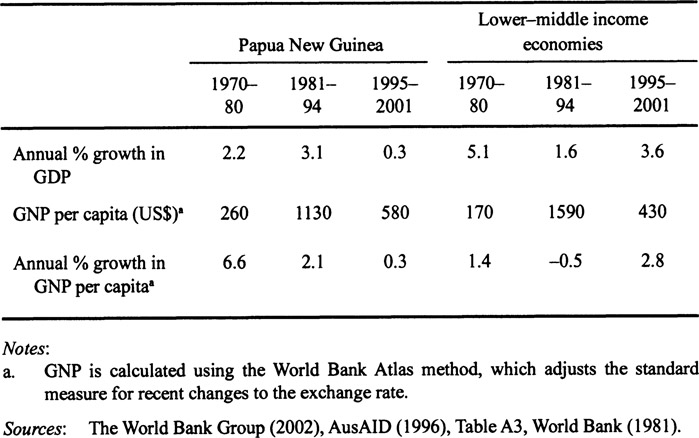
Prior to independence, the economy of PNG achieved an average annual growth rate of 6.7 per cent of Gross Domestic Product (GDP) between 1965 and 1973, spurred by rapid growth in aid-financed public expenditure and by the establishment of the BCL mine. In the first few years after independence real GDP growth was moderate and PNG maintained a stable macroeconomic environment. The growth of per capita GDP was slow during the late 1970s and early 1980s. According to Jarrett and Anderson (1989) this poor performance of PNG economy was greatly influenced by the incidence of expatriates leaving the country taking their savings and skills.
However, Gamaut and Baxter (1984) indicated a substantial increase in the share of market GDP accruing to the nationals in the late 1970s and by the end of the 1970s, nationals’ share of production was stabilised at a high level. However, PNG experienced an appreciable increase in growth from the mid-1980s, owing particularly to strong world market prices for its mineral resources and a marked improvement in the agricultural commodity export sector. The country faced an enormous setback in 1989, through the forced closure of the BCL mine, due to the secessionist rebellion, and a significant decline in world market prices for its major agricultural and tree crops exports. A nine year secessionist revolt on the island of Bougainville ended in 1997.
The gloomy scenario was somewhat mitigated by strong growth in the petroleum and mineral sectors from the early 1990s. During the early 1990s, substantial expansion in the mineral and petroleum sector contributed to a relatively large growth in GDP. In 1993, PNG’s per capita GNP amounted to an estimated US$1,130. Over the period 1991 to 1994, an average annual growth rate of 10.6 per cent was achieved (Appendix Table A3.2). However, the growth rate of GDP and GNP both deteriorated over the second half of the decade due to poor economic performance and continuous laxity of fiscal policy.
Table 3.1 Economic growth in PNG and lower-middle income economies, 1970–2001
3.3.1 Investment and Savings
PNG’s ratio of gross investment to GDP has been comparable to other lower middle-income countries over the years. Investment is dominated by the mining sector, most of which comes through foreign companies. The mining sector’s contribution to gross capital formation averaged between 19.6 per cent and 56.8 per cent over 1984-94 and remained buoyant, although it fluctuated considerably over the years. Over 1970-94, gross domestic investment (GDI) accounted for about 26 per cent of GDP on average.
Table 3.2 Investment and savings, 1970–99 (current prices and percentage of GDP, kina million)
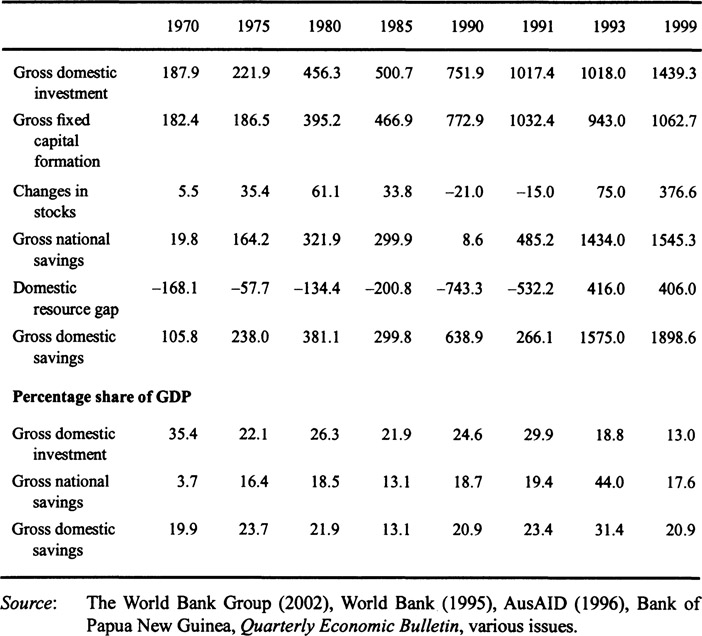
During the early 1970s, high investment activities were associated with mining and construction-sector investment. The sharp drop in aggregate investment in the mid-1980s was mainly due to the completion of major construction activity at the Ok Tedi mine, but gross domestic investment increased sharply from 1990 onwards (Figure 3.1), due to an upsurge in construction activity on the Kutubu and Porgera projects.
The share of non-mining investment fell from about 14 per cent of GDP in 1981 to 8 per cent in 1991. However, since the early 1990s forestry has been attracting significant foreign investment. Investment in forestry and construction has greatly influenced the present steady performance in non-mining private investment. Higher investment in the construction sector also resulted from mineral booms during the early 1990s. Investment in the manufacturing sector is not high except in some protected industries. A large portion of PNG’s investment has been financed by foreign sources.
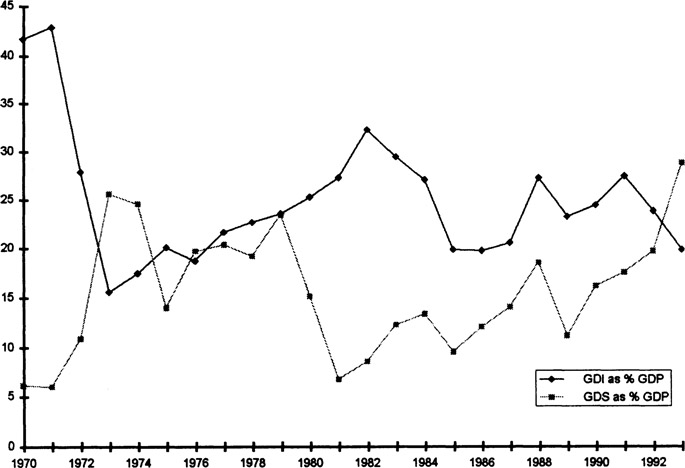
Figure 3.1
Gross domestic investment and gross domestic savings, 1970-93 (percentage of GDP)
Source: Constructed from various tables in World Bank (1995), (1991), AusAID (1996).
The performance of public savings in PNG has been very poor. Lower public savings is one of the major reasons why total domestic savings stays at a low level, averaging 13 per cent of GDP from the mid-1980s to the early 1990s. Despite a large capital outflow in 1992–93, as a result of openness in the capital market, private saving’s contribution to investment was remarkably high and averaged around 30 per cent of GDP over the 1991–93 period. As measured by the resource gap, PNG’s dependence upon foreign savings dropped sharply in 1993, as a result of strong growth from the early years of the 1990s (Table 3.2). However, the real gross fixed capital formation fell down to 13.7 per cent of GDP in 1998 compared with 21 per cent in 1984 mainly due to outflow of foreign capital since 1994 (Curtin, 2001).
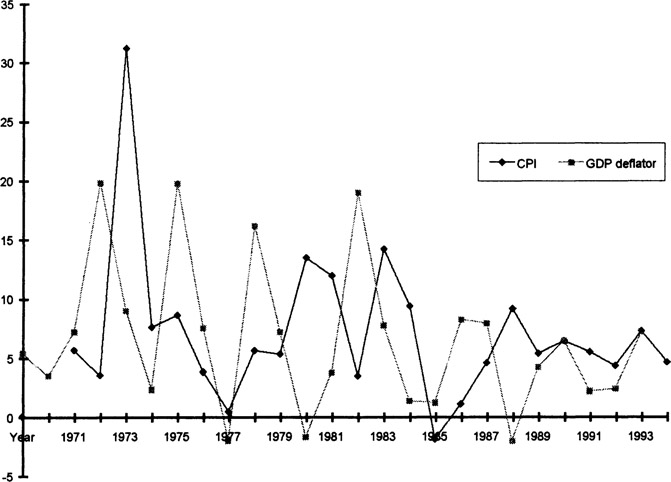
Figure 3.2 Inflation in Papua New Guinea, 1970-94 (percentage change in CPI and GDP-deflator)
Source: Appendix Table A3.2
Australia is the largest foreign investor in both mining and non-mining sectors of PNG. Development of new mines such as Ok Tedi (copper and gold), Hides (gas), Kutubu (oil), Lihir (gold), Porgera (gold) and Misima (gold) have also attracted USA, UK and Canadian mining interests. Malaysia has become a significant investor in fisheries, timber and other trade and construction sub-sectors.
3.3.2 Inflation
From the mid-1970s, PNG was a low-inflation country. The average annual rate of inflation between 1975-79 was around 4.7 per cent, which was well below the level of PNG’s major trading partners. Appendix table A3.2 and Figure 3.2 indicate the trend of inflation over two and a half decades in the PNG economy.
During the 1980s, a moderate increase in inflation was due mainly to increased prices for food, raw materials and petroleum products, and a weaker kina. Between 1990 and 1994, the average annual CPI-based inflation rate was around 5 per cent.
Favourable external factors also contributed positively to the decline in inflation, including low international inflation, particularly in Australia, the major source of PNG’s imports (imported products carrying a weight of 50 to 60 per cent in the CPI). However, annual average rate of inflation between 1995 and 2001was 11 per cent. CPI and GDP deflator annual change jumped to a double digit figure of 16.4 per cent and 10.8 per cent respectively in 2000 from its previous year. Both the figures dropped considerably in 2001, mainly because of the exclusion of large upward piece movements in seasonal CPI categories and the imposition of a selected excise tax on the subgroup of cigarettes and tobacco.
3.4 Structure of the Economy
Table 3.3 Sectoral composition of GDP, selected years (as percentage of GDP)
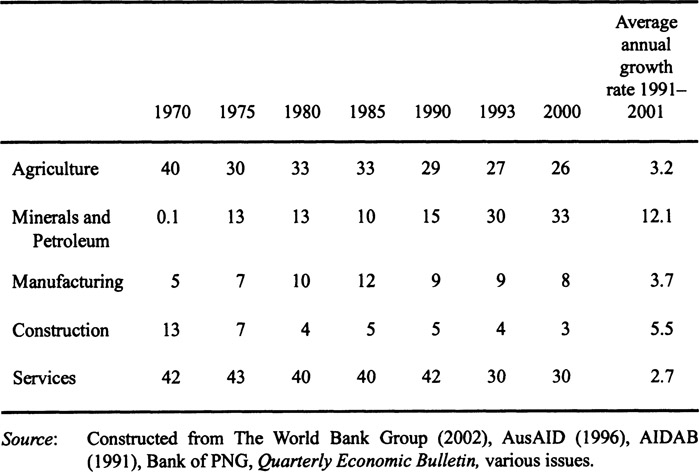
Data on sectoral growth and the changing composition of GDP are given in Table 3.3. The exploitation of abundant natural resources has led to the development of a dualistic economic structure dominated by a significant agricultural and forestry sector, and a capital intensive oil and minerals sector. Agriculture accounts for approximately one third of GDP,1 and virtually all non-mineral exports, as well as providing the livelihood for about 80 per cent of the population. There are two types of cash crop grown; those grown specially for the export markets and food crops grown for sale in the local market. Food crops consist mostly of vegetables and fruit, and constitute about half of this sector’s output. In the early 1960s, the agricultural sector accounted for more than 50 per cent of GDP. The GDP share of agriculture (including forestry and fishery) declined from 40 per cent in 1970 to about 27 per cent in 1993. The share of forestry accounted for about 8 per cent of GDP in 1993.
In terms of investment, exports, and net contributions to the balance of payments and government’s fiscal revenues, the mineral sector consisting of copper, silver, gold and oil production, is the dominant sector of the PNG economy. Data on sectoral growth indicates spectacular growth in the mining sector over the past two and a half decades.
The mining sector’s share (copper and gold) of GDP increased from 0.1 per cent in 1970 to about 30 per cent in 1993. Mineral and oil exports constituted over 73 per cent of total export earnings in 1992 compared with 18 per cent in 1972. The sector is represented by four active establishments,2 consisting of the copper and gold mine at Ok Tedi in Western Province and the gold mines at Misima, Milne Bay and at Porgera in Enga Province. Ok Tedi, Misima and Porgera have more than made up for the closure of Panguna. Although the mineral sector is overwhelmingly foreign owned, the government has reserved the right to acquire a 30-per-cent equity in mining projects and 22.5 per cent in petroleum (AIDAB, 1991). The Kutubu oil project was the first oil development in PNG and its first exports were shipped in July 1992. Further developments are occurring in the Gobe Main and Southeast Gobe fields.
The manufacturing sector includes food, soft drinks, beer, food canning and tobacco processing. Furniture making has been a minor feature of the sector. Small-scale engineering and metal processing, clothing and other light industries are also included. The sector is dominated by capital-intensive activities and is foreign owned and managed. The share of the manufacturing sector in the economy is small and has been stagnant over the past two decades. The expansion of manufacturing has been hampered by the shortage of entrepreneurial, managerial and labour skills, especially by the high cost of labour relative to productivity (Goodman et al., 1985). Over the period 1970-95, its contribution to GDP has varied in the range of 5 to 12 per cent.
Over the 1970s and the 1980s, the services sector accounted for more than 40 per cent of GDP on average and declined to 31 per cent in 1995. This sector includes all economic activities such as electricity, gas and water, transport and communications, trade, finance, insurance, real estate, community, social business and personal services.
The construction sector grew rapidly in the early 1970s, with the establishment of BCL, followed by a declining trend over the 1980s. The major cause of this fall was the failure to implement infrastructure projects. The contribution of the construction sector settled at around 5 per cent of GDP during the first half of the 1990s. Contribution of all sectors’ output to GDP remained constant at the end of the decade.
3.5 Labour Market
Data on employment are very scarce as there is no comprehensive reliable series of wage employment data in PNG. Major studies (Gamaut et al., 1977; Lodewijks, 1987;McGavin, 1993, 1991, 1986; Levantis, 1997) on PNG’s labour market indicate that the concept of employment is of limited relevance in PNG, since the majority of the population works in the non-monetised economy.
According to the 1971 census, less than one third of the population above the age of ten was in the work force, and less than one quarter of the labour force worked mainly in money-earning activities. In 1979, formal employment was about 15 per cent of the total economically active population. The labour force grew at about1.5-2.2 per cent per annum over the 1980s. The 1990 census estimated the total labour force at 1.6 million, or 46 per cent of total population. The total increase in unemployment between 1980 and 1990 grew at an annual compound rate of 16.3 per cent, and was 27 per cent for males in 1991 (McGavin, 1993, p. 59). Lack of formal job opportunities in the rural area and the large wage disparity between rural and urban minimum wages until 1992 induced large scale rural to urban migration and increased urban unemployment which was 29.3 per cent according to 1990 Census (Levantis, 1997). A detailed discussion of wage structure in PNG is presented in Section 3.4.3.
The predominance of self-employment in the agricultural (35.5 per cent of total labour force in 1980) and subsistence sector (41.2 per cent of total labour force in 1980) indicates that wage employment in rural areas of PNG is relatively unimportant (AIDAB, 1991). Agriculture is the main source of employment, employing nearly 80 per cent of the total labour force. In the formal sector,3 the private sector is the largest employer, providing almost 60-70 per cent of all formal jobs. Available data on employment over the period 1968-95 (Appendix Table A3.6) indicate no growth in formal-sector employment in the non-agricultural and mining sectors, although agricultural employment grew by 3.7 per cent per annum between 1980 and 1991 (McGavin, 1991, p. 66). After the labour market reforms in 1992, employment in the private sector grew about 8 per cent by 1994 (AusAID, 1997). Employment in all sectors except retail and manufacturing fell considerably at the end of the decade.
PNG suffers from short supply with regards to high skilled labour. This short fall is normally satisfied by recruiting skilled expatriates. Expatriate labourers mainly come from Australia. Naturally, the wages and salaries to such high skilled labour are considerably high. However, the domestic supply of skilled labour has increased over time in response to high returns. As a result, the expatriate labour supply in formal wage employment has fallen from 7.3 per cent in 1980 to 3.6 per cent in 1990 (Levantis, 1997).
Over the past three decades the growth rate in formal-sector employment has not kept pace with labour-force growth. Between 1970 and 1993, the annual growth rate of the labour force was 2.3 per cent, whereas the growth rate of formal wage employment was estimated at only 0.7 per cent. The breakdown of formal wage employment indicates that the share of public-sector employment declined from 26.6 per cent of total wage employment in 1975 to 24 per cent in 1991 (Appendix Table A3.6).
Employment in the mining sector has remained at about 3 per cent of total formal employment since independence. Several other industry groups, mainly finance, communication and social service, and building and construction registered significant employment growth in the 1990s. However, despite high economic growth, urban employment fell in the 1990s, adding to the number of unemployed persons in urban areas and increased incidents of crimes.
3.6 Public Sector
PNG inherited a relatively large public sector from the colonial era which occupies a prominent position in the economy. Between 1970 and the early 1990s, government expenditure constituted about one third of total GDP on average and about 40 per cent of non-mining GDP. The government’s share in total non-mining investment was 41 per cent of GDP over the 1970s and 1980s, which is high compared with other low middle-income developing countries. The public sector provides more than 40 per cent of all jobs in the formal sector.
Despite its large size, the public sector has not been able to contribute much to sustainable economic growth in PNG. A major share of government expenditure has been directed towards consumption rather than investment, with nearly 85 per cent of total expenditure absorbed by wages and salaries and various kinds of administrative activities. Capital expenditure represents a small proportion of total expenditure (see Appendix Table A3.3), resulting in a failure to meet the basic infrastructure needs of the private sector. Expenditure on operations and maintenance of capital and basic institutions has been neglected, resulting in a perpetual reduction in the efficiency of infrastructure, investment and public services.
3.7 Financial Sector
PNG’s financial system is controlled by the Bank of Papua New Guinea (BPNG). The sector consists of five commercial banks, five merchant banks, sixteen active savings and loan societies, four financial companies, government-controlled pension and investment companies, nine insurance companies, a merchant bank and the Central Bank. The five commercial banks own over 80 per cent of the sector’s assets. Since independence, development in the financial-services sector has remained limited, and access to financial services in rural areas is particularly poor. Only the savings and loan societies function with some degree of effectiveness. The Rural Bank was established in 1994 from an old Development Bank and is targeted at the rural sector’s financial facilities. In recent years, the PNG government has undertaken various measures to deepen capital markets and create a more favourable climate for the financial sector to diversify and extend its reach to the rural population. Although the financial sector of PNG is relatively small, contributing less than 1 per cent of total non-mining GDP, the modem monetary economy has grown strongly with the mining sector’s development.
3.8 Foreign Trade
The economy of PNG is highly dependent on international trade. Merchandise exports account for about 40-50 per cent of GDP, and are concentrated around a small number of mineral and agricultural commodities. In the mid-1960s, coffee was the major export. In the 1970s, the main sources of export earnings were mineral and agricultural commodities, among which palm oil became a significant export earner. Agricultural exports are dominated by tree crops, such as coffee, copra, cocoa, coconut and palm oil and palm kernel, which constitute over 95 per cent of agricultural export earnings. From the early 1990s, the combination of higher prices and volumes increased the value of log exports more than five-fold and accounted for almost 20 per cent of the export value in 1994.
From the early 1990s, the dominance of mineral exports in total exports continued to increase, from 53.0 per cent in 1985 to 72.0 per cent in 1995 and 78 per cent in 2000. The mineral and petroleum sector accounted, on average, for more than 35 per cent of GDP per annum during 1992–95.
Australia is the major trading partner, accounting for 47 per cent of total trade. Japan is another significant trading partner, accounting for 27 per cent of total trade in 1990. Over 40 per cent of PNG’s imports come from Australia. Japan and the United States are also important sources of imports.
Non-mineral exports
Non-mineral exports, which include exports from agriculture, forestry, fishery and others, contributed significantly to total exports in 1977-80. The share of agricultural exports in total export earnings was depressed over the first half of 1980s due to low world market prices for PNG’s major agricultural export crops. Total export revenues from the agricultural sector improved significantly in the mid-1980s and accounted for about 36 per cent of total exports but declined after 1985 because of a decline in production and falling prices (Table 3.4). The situation began to improve after 1992, due to an improvement in world prices for PNG’s agricultural exports and a 10 per cent nominal devaluation of the kina in 1990. (For detailed information, see Appendix Tables A3.4 and A3.5.)
Agricultural exports increased almost 30 per cent in 1994 from the 1990 level in real terms and accounted for 33 per cent of total exports. Since 1992, the export volumes of all major agricultural commodities increased significantly, with the exception of copra, rubber and tea.
Table 3.4 Minerals and agricultural exports of PNG, 1970–2000 (current prices, kina million)
| Mining exports | Agriculture exports | Non-mining exportsa | Total exports | |
|
|
||||
| 1970 | — | 75.3 | 92.8 | 99.0* |
| 1975 | 240.1 | 131.2 | 162.5 | 402.6 |
| 1980 | 322.4 | 230.3 | 319.4 | 704.2* |
| 1985 | 489.9 | 330.2 | 436.3 | 926.2 |
| 1990 | 758.0 | 205.0 | 365.0 | 1123.0 |
| 1991 | 1005.4 | 204.6 | 384.6 | 1390.0 |
| 1992 | 1371.5 | 224.0 | 491.1 | 1862.6 |
| 1993 | 1767.8 | 270.0 | 759.2 | 2527.0 |
| 1994 | 1783.0 | 375.0 | 899.0 | 2682.0 |
| 1995 | 2435.0 | 498.0 | 965.0 | 3400.0 |
| 2000 | 4494.6 | 955.5 | 342.5 | 5792.0 |
Notes:
a Non-mining exports include the export value of agriculture, forestry, marine and other re-exports.
* Some total export entries are not equal to the sum of mining exports and non-mining exports because of omission of other minor exports items and re-exports.
Source: The World Bank Group (2002), AusAID (1996, 1997), Bank of Papua New Guinea, Quarterly Economic Bulletin, various issues.
Mineral exports
Both the volume and value of minerals exports have grown significantly since the early 1970s after the establishment of the BCL mine. The mineral sector’s contribution to total exports increased dramatically from virtually nothing in 1970 to nearly 60 per cent of total export earnings in 1975. From the mid-1980s, the share of exports as a proportion of GDP grew rapidly (Table 3.4 and Appendix Table A3.5).
In 1989, copper, gold and coffee alone generated 72 per cent of total sales. In 2001 mineral exports accounted for 80.5 per cent of total merchandise exports compared to 73.5 in 1992 and 53 per cent in 1985. The increase was due to the combined effects of the commencement of crude oil exports in June 1992 and increases in the value of gold exports, reflecting increased production at the Porgera and Misima mines. In 1993, export revenues from minerals and petroleum accounted for 35 percent of GDP and 70 per cent of total merchandise exports. Total exports accounted for 52 per cent of GDP between 1993–95 and 56 per cent in 1999.
Terms of trade
The prices of PNG’s export commodities exhibited a great deal of volatility in the world market. PNG’s terms of trade remained at a high level during the 1970s and then fell substantially over the early years of the 1980s. TOT improved greatly in 1984 as the world market prices of PNG’s export commodities improved from the depressed situation of the early 1980s. TOT started to fall from the mid-1980s (with an exception in 1988) and remained low until 1992. The situation improved in 1993, with increased world market prices for agricultural commodities. TOT fell by 2.9 per cent in 2001 compared to its previous year due to relative price increase in PNG’s imports.
3.8.1 The Balance of Payments and International Reserves
In the 1970s, PNG’s balance of payments (BOP) was generally in surplus. During 1983-85, a positive BOP was achieved, but this deteriorated in 1989, following the closure of the Bougainville mine and a drastic decline in PNG’s agricultural commodity prices. From 1992, both the trade and current account went dramatically into surplus, due largely to the contribution from the Kutubu petroleum project and increased gold and log exports. The share of imports fell from over 53 per cent in 1984 to 45.5 in 1998. In 2001, the overall BOP surplus was K708 million, compared to a surplus of K359 million in 2000. Current account recorded a surplus of K935 million whereas the capital account incurred a deficit of K262million in 2001.
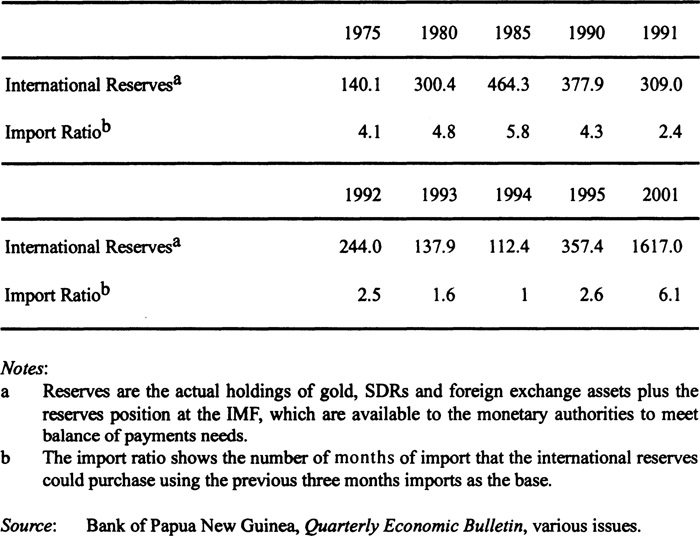
International reserves
PNG’s international reserves, which include actual holdings of gold, SDRs and foreign exchange assets, plus the reserves position at the IMF, have fluctuated sharply over the years. Due to an unfavourable external situation, international reserves for PNG fell to K272.2 million at the end of 1982. The reserve position improved substantially in 1985 and covered 5.8 months of total import bills. The large growth in liquidity created a continual decline in the international reserve level between 1990 and 1994. However, the level of international reserves improved at the end of 1995 to K357.4 covering 2.6 months import bill (Table 3.5). The level of gross foreign exchange reserves was K1617 million at the end of 2001, sufficient for 6.1 months of total import cover and 8.7 months of non-mineral imports cover (Quarterly Economic Bulletin, 2001).
3.8.2 Foreign Aid
Foreign aid (including grants) plays an important role in PNG’s economy. The country has always had access to international sources of finance and generous concessionary finance for public-sector activities. The contribution of foreign aid averaged about 11 per cent of GDP between 1977 and 1993. In 1997, the net official development assistance to PNG was $292 million which increased to $400 million in 1999.
Table 3.5 International reserves and import ratio, 1975–2001 (selected years, kina million)
The major share of foreign aid to PNG comes from Australia. However, the share of Australian aid to total foreign aid declined from 85 per cent in 1982 to 73 per cent in 1993, compared with 100 per cent of total aid in 1970 (Appendix Table A3.7).
Net official assistance declined shaiply from 24 per cent of GDP in 1975 to 14.5 per cent of GDP in 1977 and then continued to fall more steadily until 1990. The share of total aid accounted for only 5.9 per cent of GDP in 1993, with a significant decline in budget support from Australia. This decline in the share of foreign assistance to GDP was offset by increased gains from export revenues and taxes from external trade during the early 1990s. Other major donors are the Asian Development Bank (ADB), the Overseas Economic Cooperation Fund of Japan, the European Union and Germany.
Table 3.6 Foreign aid to PNG, 1970–94
| Total aid (US$, million) | Aid per capita (US$) | Share of aid to GDP(%) | |
|
|
|||
| 1970 | 112.4 | 46.1 | 17.3 |
| 1971 | 135.2 | 54.5 | 18.8 |
| 1972 | 148.6 | 58.5 | 17.4 |
| 1973 | 208.6 | 80.2 | 15.9 |
| 1974 | 307.2 | 115.1 | 20.8 |
| 1975 | 322.1 | 118.0 | 23.7 |
| 1976 | 283.9 | 101.8 | 18.7 |
| 1977 | 238.0 | 83.2 | 14.5 |
| 1978 | 263.5 | 89.9 | 13.6 |
| 1979 | 270.6 | 90.2 | 11.8 |
| 1980 | 326.0 | 106.2 | 12.8 |
| 1981 | 336.0 | 107.0 | 13.4 |
| 1982 | 310.7 | 96.8 | 13.2 |
| 1983 | 333.0 | 100.9 | 12.9 |
| 1984 | 324.3 | 95.9 | 12.6 |
| 1985 | 259.2 | 74.9 | 10.7 |
| 1986 | 263.9 | 74.3 | 10.0 |
| 1987 | 321.9 | 88.7 | 10.3 |
| 1988 | 374.7 | 101.8 | 10.3 |
| 1989 | 336.5 | 89.5 | 12.4 |
| 1990 | 413.1 | 107.6 | 12.9 |
| 1991 | 397.2 | 101.1 | 10.5 |
| 1992 | 443.4 | 110.3 | 10.4 |
| 1993 | 303.2 | 73.8 | 5.9 |
| 1994 | 326.0 | 77.6 | 6.3 |
Sources: Constructed from World Bank (1981), World Bank (1995) and AusAID (1995,1996,1997).
3.9 Macroeconomic Policies
The objectives of macroeconomic policies can be described as the establishment and maintenance of external balance and internal balance (including price stability), with an efficient allocation of resources. The most difficult task confronting policy makers is to achieve several goals simultaneously. Thus, the common practice is to identify particular instruments which are most effective in achieving particular desired goals. Economic theory suggests that in a small open economy the instrument of expenditure policy could be assigned to the external-balance objective, the wages policy to the internal-balance objective and the exchange rate to the price-stability objective (Gamaut and Baxter, 1984). Trade and exchange rate policy can also play a powerful role in determining relative prices, profitability and production of traded goods, as well as providing incentives to domestic producers in external trade. PNG pursued active macroeconomic policies for stabilising the economy. These policies are discussed in the following sub-sections.
3.9.1 Fiscal Policy
PNG’s administration earned a reputation for prudent macroeconomic management during the second half of the 1970s and the 1980s. Cautious policies were pursued with respect to external borrowing, domestic absorption and the exchange rate.
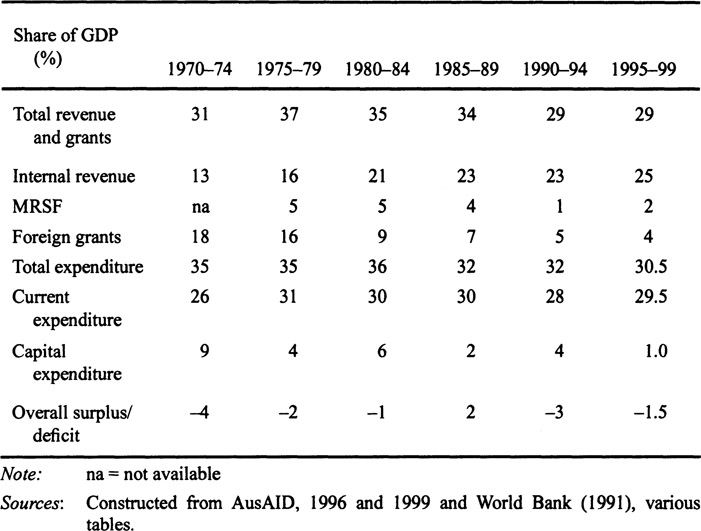
Throughout the period 1976-82 fiscal restraint was the most important instrument through which external balance was sought. As a result, the budget deficit, as a ratio to GDP, declined to 2 per cent in 1975-79 from a budget deficit of 4 per cent in 1970-74 (Table 3.7). The declining trend in the budget deficit continued until the mid-1980s when the deficit was only 1 per cent of GDP.
From 1989-90, the fiscal deficit rose significantly to a new peak of 6 per cent of GDP due to the closure of the Panguna mine in Bougainville and the subseqcent fall in PNG’s agricultural-commodity export prices in the world market. The fiscal deficit widened considerably due to indiscreet fiscal actions. As a result, the budget deficit averaged 4.75 per cent of GDP per annum over the 1990-93 period. However, due to fiscal restraint the budget deficit declined to 2.3 per cent of
GDP in 1994.
Stabilisation funds
Cushioning the economy against the destabilising effects of external shocks has been an important objective of government policy. Two types of stabilisation fund were established to deal with the impact of fluctuating mineral and commodity prices. The Mineral Resources Stabilisation Funds (MRSF), established in 1974, receives all government revenues from the minerals sector. Originally it released them to the government budget, according to a formula designed to reduce fluctuations that would otherwise occur. In the early 1980s with the depressed world prices for PNG’s exports, the MRSF contributed between 16 to 21 per cent of the central government’s internal revenue. In 1992, the MRSF contribution declined to 7 per cent of government internal revenue. Legislative changes in the mid-1990s allowed more direction in the flow of funds to the budget and the MRSF taxes accounted for 18 per cent of total revenue and grants in 1997.
Operated by the Commodity Boards, the Commodity Price Stabilisation Funds (CPSF) for three major agricultural export commodities aims to stabilise the prices along a moving long-term average export price. The major objective of CPSF is to provide price support to producers during difficult periods. CPSF receives the levies paid by exporters and holds these deposits, returning them to producers during periods of low prices.
Table 3.7 Central government revenues and expenditures, 1970–99 (percentage share of GDP)
3.9.2 Monetary Policy
The Bank of Papua New Guinea is responsible for the conduct of monetary and financial policies. Monetary policy has been geared towards financial stability, by neutralising the impact of temporary fluctuations in liquidity originating from external shocks, whilst ensuring the availability of sufficient liquidity and credit to assist the growth of the non-mining sector. The use of open-market operations is not a viable option, as the market for government securities is too small. In the absence of open-market operations, the BPNG relies on credit ceilings, changes in liquidity requirements and moral suasion on interest rates.
During the 1970s, monetary policy was somewhat passive, because of constraints imposed by the fixed exchange rate regime. Through tight monetary policy, monetary stability was achieved over the 1980s and the money supply remained stable, at around 33 per cent of GDP, well below the 44-per-cent average for comparable low middle-income countries (AIDAB, 1993).
Between 1991 and 1993, the money supply grew much faster than GDP (Table 3.8). A deterioration in fiscal management was mainly responsible for monetary growth in the early 1990s. Domestic debt rose to K1606 million or around 26 per cent of GDP in mid-1994, 32 per cent of GDP in 1998 due to a high level of government borrowing from the domestic banking system.
Interest rates were below Australian levels through the period of price stability in the 1970s and middle of the 1980s, rose sharply through the exchange rate crisis of the early 1990s, and subsequently eased but remained substantially above international levels.
Table 3.8 Monetary conditions (selected years, 1982–98)
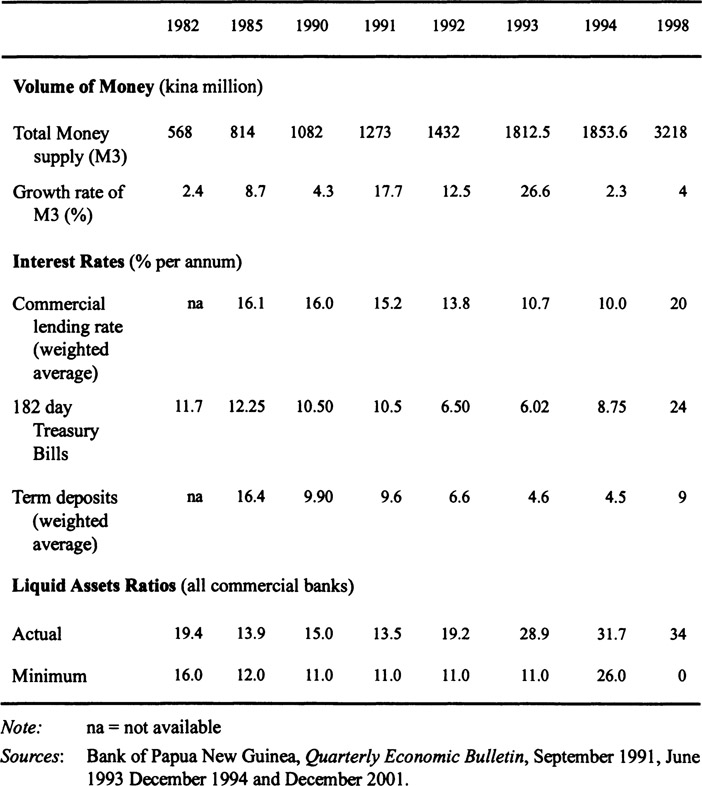
After flotation of the kina in 1994, the conduct of monetary policy changed substantially. Under the floating exchange-rate regime the BPNG has greater control over the conduct of monetary policy as there is no direct link between money supply and international reserves.
3.9.3 Wages Policy
The concept of paid labour and cash were introduced in PNG with the establishment of plantation in the nineteenth century. PNG has a long history of official intervention in the labour market, primarily through the setting and indexation of minimum wages, public-sector wages and employment policies. During most of the colonial period, the main objective of labour-market intervention was to attract and protect new entrants in the formal sector (primarily in plantations), leading eventually to the introduction of a system of cash wage employment and a legal minimum wage.
Wages in the formal sector are set by the Minimum Wage Board (MWB), formally established in 1972,4 based on a tripartite board of employers, employees and government, in contrast to the Australian system of compulsory arbitration (AIDAB, 1994). In 1974, the MWB was institutionalised, following the Australian practice of six-monthly automatic cost-of-living indexation. This system of full and automatic indexation to the cost of living continued until 1983.
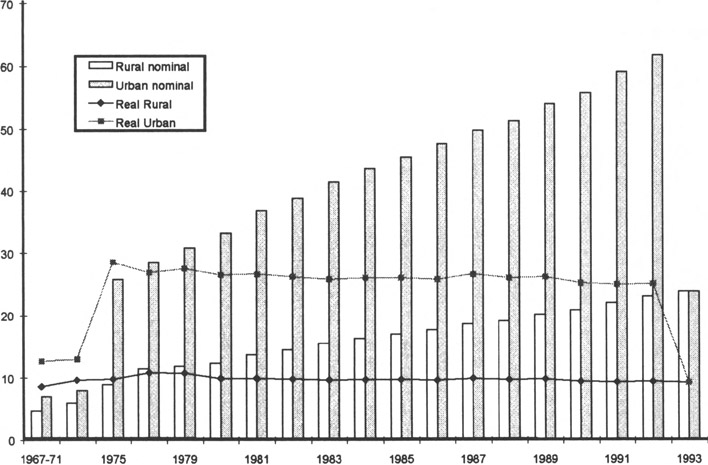
Between 1972 and 1975, minimum urban wages increased three-fold, in nominal terms, and 50 per cent in real terms. Consequently, rural-urban wage differentials increased sharply, creating unrealistic expectations about job prospects in urban centres. The conseqcent influx of population to city centre increased the urban unemployment rate as well as contributing to a deterioration in law-and-order. The PNG government froze urban wages temporarily in 1976. From 1983, partial indexation has been followed which has served to moderate real wage increases. Despite the worsening employment situation, real minimum wages remained remarkably constant until 1994 and after that show a declining trend until 1998.
There is a large gap between wages in the formal and informal sectors. Limited data on informal market wages were available, prior to a 1990 urban survey, which found that average weekly wages for the informal market was 62 per cent of the minimum hourly rate and 84 per cent of the minimum weekly rate for urban wages, and average earnings for the self-employed was 52 per cent of the minimum weekly wage (AIDAB, 1993).
The urban wage rates were also much higher in PNG compared to other developing countries. The urban minimum wage in the late 1970 in PNG was double than that in Malaysia and Western Samoa, four times that in the Philippines and Thailand and about ten times that in Indonesia and Sri Lanka (McGavin, 1986:152). This high minimum wages contributed largely to an unemployment problem and hindered the development of manufacturing sector (Goodman et al., 1985).
In August 1992 the centralised wage-fixing system was abandoned in favour of a system whose focused on productivity, which unified the dual system of rural and urban minimum wages and introduced a national youth wage set at 75 per cent of the new national minimum. In 1993, this resulted in a 4.7 per cent decline in real wages, followed by a further decline of 2.8 per cent in 1994 and 14.7 per cent in 1995 (AusAID, 1996).
Sources : Constructed from World Bank (1991) Table 4.2, p.75 and AusAID (1995) Table A ll.
Figure 3.3 Nominal and real urban and rural minimum wages, 1967-93 (weekly wages, real wages are at constant 1977 prices)
3.9.4 Trade Policy
During the 1970s and early 1980s, PNG had a fairly liberal trade regime. Taxes on imports were quite low on average, at about 5 per cent, during the 1970s. In the early 1980s, a protective tariff of 10 per cent was provided to import-competing industries. Since the mid-1980s, increased protection in the form of tariff and import bans has been prominent. These interventions were motivated by an assortment of revenue collection and distributional objectives to discourage imports and encourage domestic production (import substitution).
The 10 per cent tariff was subsequently increased to 17.5 per cent in the mid-1980s, and raised again to 30 per cent in the early 1990s, for all goods where there was domestic production. Import taxes on luxury goods and other consumer goods were imposed at higher rates of 50 to 80 per cent. A few other items, such as tobacco, wine, beer and spirits, soft drinks, motor vehicles and petroleum products were subjected to even higher import taxes and sometimes even to penal import duties. Poultry, pork, sugar, flour, animal feed, canned meat, Suit, vegetables, honey, toilet soap, matches, wooden doors and plywood were protected by quotas or by a complete ban on imports.
From the early 1990s, the protection accorded sugar and cement, for example, led to higher consumer prices and a reduction in general welfare. Import taxes on essential consumer items, such as canned fish and rice, and other non-competing inputs to domestic production, were exempted or reduced. Effective protection for the agricultural sector, especially for food items exports, is low or negative. While inputs to domestic production of food items are taxed substantially, imports of canned fish and cereals are exempt from duty and the domestic production of luxury and ‘special’ items - such as cigarettes, soft drinks, spirits, beer, and tobacco - has been given major incentives.
In the early 1990s, the effective rate of protection on most locally manufactured goods ranged between approximately 60 to 160 per cent (AusAID, 1996). Final products were protected at rates of 30 to 80 per cent. The protection rate for imports of non-competing inputs was zero, which accounts for about one-half of the value of imports.
3.9.5 Exchange Rate Policy
Before independence, PNG was a part of the Australian monetary system and had no foreign-exchange requirements of its own. The Central Bank of the country was established and a set of exchange regulations was formulated and introduced prior to independence. The BPNG issued PNG’s first currency, the ‘Kina’, on 19th April 1975 on a par with the Australian dollar. PNG’s monetary system became independent from the Australian monetary system on 1 January 1976.
Between Independence and the end of 1981, the kina was revalued by 30 per cent against the Australian dollar, by 15 per cent against the import-weighted basket, and by about 9 per cent against a trade-weighted basket (Gamaut and Baxter, 1984,p. 15). The method of setting the exchange rate daily, and quoting daily to some variant of a trade-weighted basket, by the BPNG against the Australian and US dollar, was actively introduced after 1980.
The movement in the nominal effective exchange rate (NEER) over time is shown in Figure 3.4. In the 1970s, PNG pursued a ‘hard kina’ policy to maintain a fixed exchange rate, while utilising appropriate monetary and fiscal policies to achieve external and internal balance.
The major aim of the ‘hard kina’ policy was to maintain a strong balance of payments with manageable levels of foreign debt through restraint on the real level of domestic expenditure and wages (Gamaut and Baxter, 1984:1). Until the mid-1980s, PNG maintained a convertible currency and reasonably low inflation by world standards. The policy of ‘hard kina’ had been pursued actively until fiscal policy became lax from the early 1980s.
There was a significant policy shift with a 10 per cent devaluation against the Australian dollar in March 1983, followed by another 10 per cent in January 1990. By the beginning of 1994 foreign exchange reserves had been under persistent pressure and were rapidly depleted due to widening of current account deficit which was mostly reflection of unsustainable fiscal policy. In October 1994, in the face of the worsening foreign exchange crisis, and after a brief suspension of convertibility, the government decided to float (managed float) its currency.
3.10 Summary and Conclusion
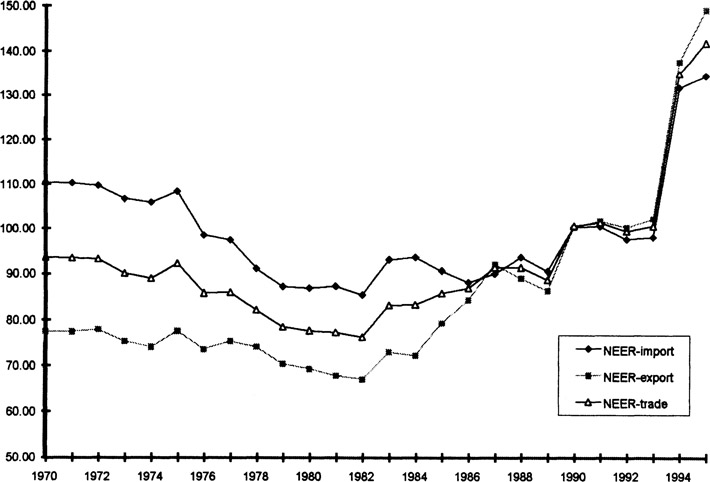
Note: Three different nominal effective exchange rate indices are constructed by using import share, export share and trade share as weights. The three measures show a similar pattern in their movements.
Source: Appendix Table A4.1.
Figure 3.4
Nominal effective exchange rate in PNG, 1970-94 (1990 = 100)
PNG is a developing country with substantial economic potential. Abundant precious natural resources, and a small population, provide opportunities for economic development, provided there is prudent economic management coupled with political stability. The sectoral composition of GDP indicates structural changes have taken place in the economy from the early 1970s. The economy is dominated by the agricultural and mineral sectors with the manufacturing and services sectors declining over time and the minerals and petroleum sector’s contribution to GDP on the increase.
Overall, PNG’s growth has been marked by periods of high and low (even negative) growth. Gross domestic investment accounted for about 26 per cent of GDP on average over 1970-94 and the average annual contribution of gross domestic savings was more than 20 per cent of GDP between 1970 and 1994. Low inflation was maintained until the mid-1980s but increased substantially thereafter.
Population growth is moderate but unemployment is on the rise, due to the non-expansion of wage employment. Wages in PNG were subject to a large degree of centralisation, with wage rates for the formal private sector determined by the MWB. The large urban-rural wage differential that existed for a long time but reduced by the wage policy reform of 1992 when PNG abandoned its centralised wage-fixing arrangements for a more flexible, productivity-based market-determined wage system which improved labour-market conditions and the competitiveness of the economy to a large extent.
In the 1970s and the first half of the 1980s, PNG followed a cautious fiscal stance. However, in the later part of the 1980s and early 1990s, fiscal indiscretion resulted in budget deficit blowouts. In terms of monetary policy, to a large extent, the BPNG has been able to maintain stability in monetary aggregates and contain interest rates and inflation.
Following a foreign exchange crisis in 1994, PNG moved away from the fixed exchange-rate regime to a managed float system. Trade policy was liberal until the early 1980s when it began to be slowly replaced by quantitative trade restrictions and higher tariffs. The current government has reaffirmed its commitment to broad-based tariff reform. In recent years, PNG has attempted to reduce its reliance on foreign assistance, which is expected to reduce instability in the domestic price level by reducing the spending effect on the domestic nontradable sector.
Notes
1 As Levantis (1997) indicated, the reliability of this figure is poor since information on aggregate subsistence production and production marketed in the informal domestic markets is largely non-existent and hence this is an underestimate.
2 A large new gold company, the Lihir Gold Ltd, commenced production in 1997.
3 The formal sector comprises agriculture and plantation, the public services, mining, manufacturing and services.
4 Governmental interventions in the labour market by introducing the minimum wages was first set in 1945. The structure now in place was established between 1972 and 1975 (World Bank, 1981, p. 19).