C H A P T E R 3
What’s in the Toolbox?
If installing Microsoft SQL Server gave you only a database engine and nothing else, the management experience would be dismal at best. Luckily, Microsoft has shipped some relatively useful tools in conjunction with the database engine. In this chapter, you will explore most of the tools that are installed in a full installation of SQL Server.SQL Server Management Studio
For a DBA, SQL Server Management Studio (SSMS) is arguably the most frequently used tool of any provided by Microsoft for use with SQL Server. SSMS is the main tool for querying and managing all the products in SQL Server, including the SQL Server database engine, SQL Server Compact, SQL Server Reporting Services, SQL Server Integration Services, and SQL Server Analysis Services. Some of these products, such as Analysis Services, Integration Services, and Reporting Services, require the use of another tool called SQL Server Data Tools to maximize their value.
To a developer or someone familiar with the Microsoft Visual Studio line of products, SSMS may look a lot like Visual Studio. This is because SSMS is leveraging the shell of Visual Studio for hosting its dialog boxes and controls. By using the Visual Studio shell, SSMS is able to provide some advanced capabilities, such as the ability to debug stored procedures and script check-in and check-out capabilities via a source control product like Visual Studio Team Foundation Server.
Connecting to SQL Server
When you launch SSMS, the connection dialog box shown in Figure 3-1 will pop up and ask you which server you want to connect to.
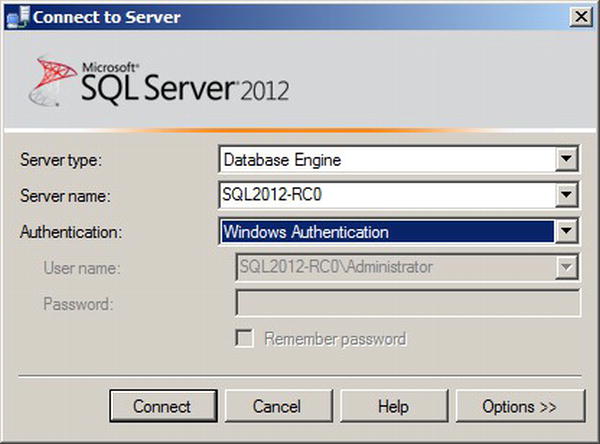
Figure 3-1. Connection dialog box
The default server type is Database Engine, but if you click the “Server type” drop-down, you can connect to other server types, such as Analysis Services and Integration Services. The Authentication drop-down allows you to specify the authentication type you will use to connect to SQL Server. Your options for connecting to SQL Server are Windows authentication and SQL Server authentication. With Windows authentication, you do not have to specify your password when connecting to SQL Server. Since you are already logged into the client machine as a Windows user, SSMS relies on Windows to pass your security token to SQL Server. If you select SQL Server authentication, you need to provide a username and password combination, which would be sent to SQL Server for authentication. This username and password combination is unique to SQL Server.
The Options button enables two additional tabs, Connection Properties and Additional Connection Parameters. Figure 3-2 shows the Connection Properties tab. On this tab, you can force the connection to use a specific network protocol. You can also force the connection to be encrypted by selecting the “Encrypt connection” check box. You will learn more about encryption and certificate use in Chapter 12.
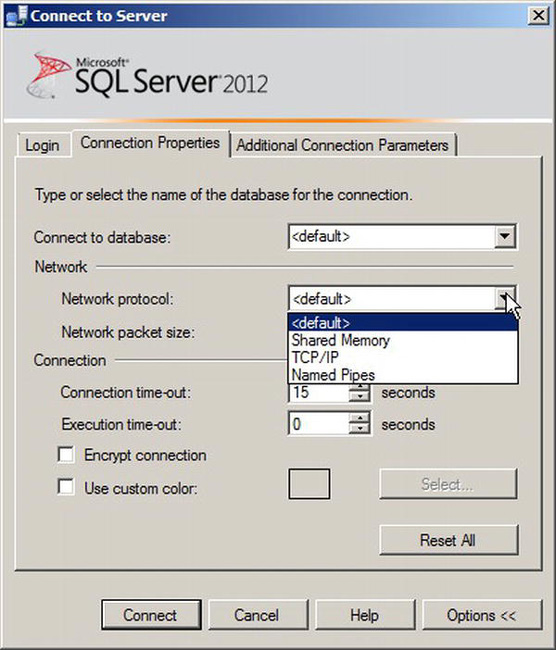
Figure 3-2. Connection Properties tab of the connection dialog box
In some cases, you may need to add parameters to the connection string. The Additional Connection Parameters tab allows you to specify these parameters. Once the server name and authentication information are entered, simply click the Connect button to make a connection to SQL Server.
![]() Note One of the historical security issues with using SQL Server authentication was the fact that username and passwords were always sent in clear text over the network. Starting with SQL Server 2005, this behavior has been addressed. The initial credential passing for connections that use SQL Server authentication will always be encrypted regardless of whether the “Encrypt connection” check box is selected. This is true as long as you are using the Microsoft SQL Server Native Client (SNAC) libraries. SSMS uses SNAC, but other application vendors may still use Microsoft Data Access Components (MDAC), which will not automatically encrypt credential passing when using SQL Server authentication.
Note One of the historical security issues with using SQL Server authentication was the fact that username and passwords were always sent in clear text over the network. Starting with SQL Server 2005, this behavior has been addressed. The initial credential passing for connections that use SQL Server authentication will always be encrypted regardless of whether the “Encrypt connection” check box is selected. This is true as long as you are using the Microsoft SQL Server Native Client (SNAC) libraries. SSMS uses SNAC, but other application vendors may still use Microsoft Data Access Components (MDAC), which will not automatically encrypt credential passing when using SQL Server authentication.
Issuing Queries Using SSMS
After establishing a connection to a server, SSMS will populate the Object Explorer tree. Object Explorer is just one of a few key components of SSMS. Figure 3-3 shows an SSMS window annotated with three of the main components: Object Explorer, document windows, and the Results pane. Note that the Results pane is showing a results grid; this area can also return results as text or as XML. Also note that Robert Walters has indeed made it in life; he is officially an AdventureWorks employee.
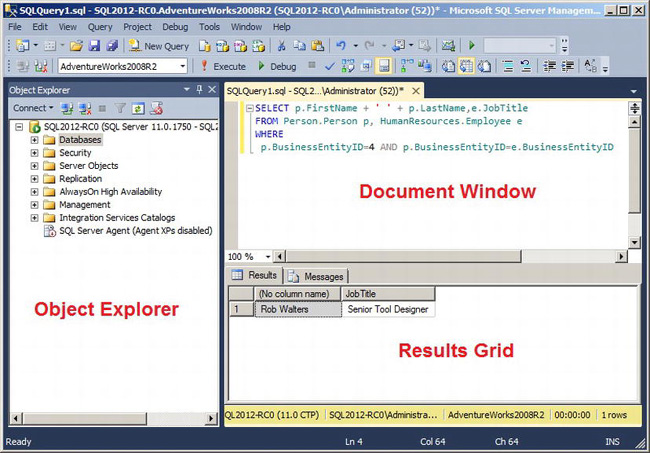
Figure 3-3. SSMS annotated with three major components
Object Explorer
Object Explorer is a tree view populated with information from the connected server and the corresponding objects contained within it. This tree view will show different nodes based on the server type to which you are connected. For example, when you connect to Analysis Services, you will see a Cubes node within a specific database node.
You can have multiple connections open to either the same or different server types. Figure 3-4 shows a connection to a SQL Server instance, to an integration server, and to Analysis Services.
![]() Note To see the Integration Services and Analysis Services nodes, you would need to have these products installed. The installation detailed in Chapter 2 did not cover installing these products.
Note To see the Integration Services and Analysis Services nodes, you would need to have these products installed. The installation detailed in Chapter 2 did not cover installing these products.
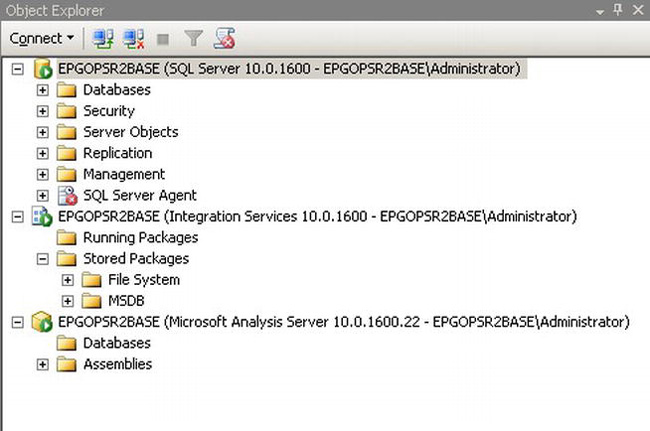
Figure 3-4. Object Explorer showing multiple connections to different server types
Not only is Object Explorer meant to display objects, but it is also a launch point for various tasks. These tasks change depending on the object that is selected and can be accessed by the context menu of the object selected. Figure 3-5 shows the context menu of the Databases node within a SQL Server instance connection.
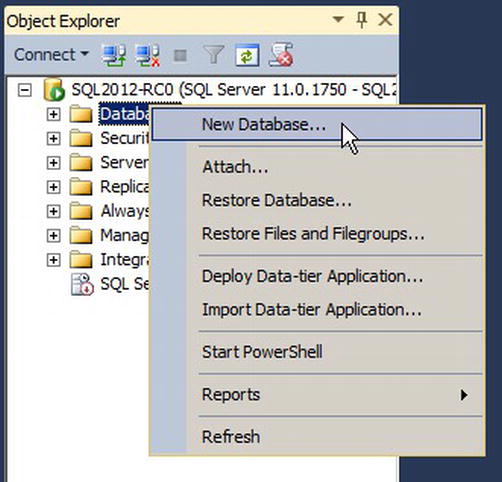
Figure 3-5. Databases node context menu
From the Databases node, you can create a new database, attach or restore a database, and perform other useful tasks. To demonstrate some of the other capabilities of Object Explorer and SSMS, let’s create a new database. This database will be used throughout the remainder of this book. To create a new database using SSMS, select the New Database context menu item from the Databases node. This will launch the New Database dialog box, as shown in Figure 3-6.
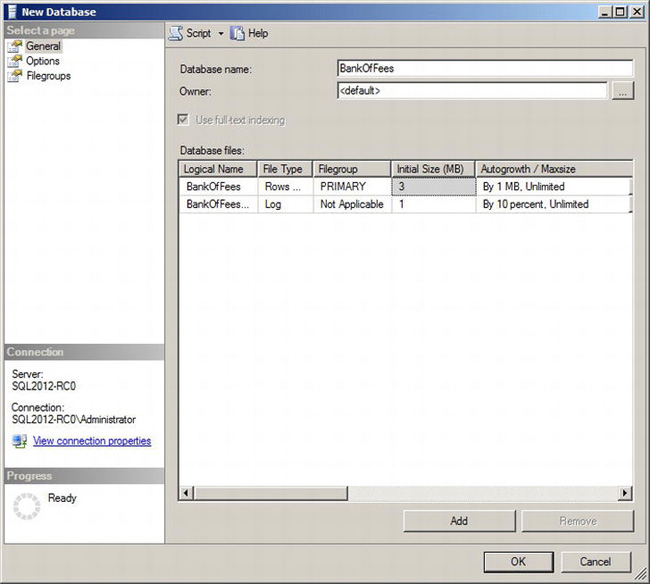
Figure 3-6. New Database dialog box
Almost all SSMS dialog boxes share some capabilities that are worth mentioning. The left side of a dialog box shows one or more pages. Usually, the most common or required information is displayed on the first page. In the case of the New Database dialog box, this first page is the General page. In this dialog box, once you fill in the database name, you could just click OK and run with all the preset defaults. For the purposes of demonstrating this dialog box, type BankOfFees in the “Database name” text box, and use the horizontal scrollbar to explore the additional columns of options. One of the options is Path. For simplicity in finding the database files that you’ll use within this book, change that path to C:Data for both the data and log files.
![]() Note If you are following along with this example, you will need to create the
Note If you are following along with this example, you will need to create the C:Data folder if it does not already exists.
Clicking the Options page will show you a number of options available for creating a database. Here, you can specify the recovery mode, compatibility mode, and many other options. Once you have reviewed these settings and are ready to create the database, you can click OK. However, if you did not want to actually create the database at this time, you have a number of options. Most of the dialog boxes in SSMS support the Script button located at the top of the dialog box. Clicking the down arrow, you will be presented with four options: Script Action to New Query Editor Window, Script Action to File, Script Action to Clipboard, and Script Action to Job. By selecting Script Action to Job, you will create a SQL Server Agent job, which will schedule the execution of the actions within this dialog box. If you just want to see what T-SQL is generated by the dialog box, you could use any of the other options.
Once you create the database, it will show up as a child node to the Databases node. Object Explorer and all previous versions of SQL Server have a tough time automatically refreshing on changes to objects. If you do not immediately see the new database, you can select Refresh from the context menu of the Databases node. Also notice that if you selected the newly created database, the context menu list would be expanded as compared to the Databases container node. Some of these new menu options include tasks such as the following:
- Back up a database
- Shrink a database
- Import data
- Export data
![]() Note Selecting multiple objects is not supported within Object Explorer. To select multiple items of the same type, you need to use Object Explorer’s Details document window. To show Object Explorer’s Details window, select it from the View menu, or simply press the F7 key.
Note Selecting multiple objects is not supported within Object Explorer. To select multiple items of the same type, you need to use Object Explorer’s Details document window. To show Object Explorer’s Details window, select it from the View menu, or simply press the F7 key.
Writing the Query
Now that you have created the BankOfFees database, you are ready to start issuing queries. To create a new query, you can click the New Query button above the Object Explorer window. This will create a new document window, which is formally called the Query Editor. You could also select New Query as a context menu item of the BankOfFees database node. If you select the command from within a specific database node, that database will be the active database for the query. If you launch the query from somewhere else, you may have another database, such as the master database, as the active database. You can see what your active database is by looking at the available databases drop-down box, as shown in Figure 3-7.
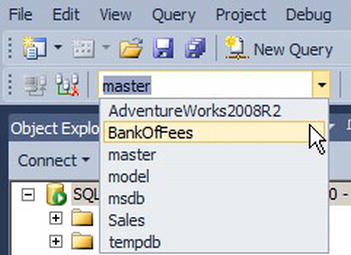
Figure 3-7. Available database drop-down showing master as the current database
If we had a dollar for every time someone executed a query and accidentally executed a script against an unintended database, we would not have any personal debt! It is very important that you double-check what the active database is before executing your query. The way most folks make sure they are executing T-SQL statements against the correct database is to place the USE command within their script. The following is an example:
USE BankOfFees

GO

--Rest of script goes here
To execute a script like this, you can click the “! Execute” button, or press the F5 key. You can also highlight just a portion of your script using the mouse or keyboard, and this same button will execute only what is highlighted. If you don’t want to run the query but just want to know whether it’s syntactically correct, you can click the Parse button (the blue check box near the Execute button) or press Ctrl+F5.
Some users new to SSMS have mistakenly thought the green right-facing arrow button would execute a query. Although clicking that button will execute a query, it will do so in debug mode, allowing you to step through each T-SQL statement.
![]() Note SSMS provides the ability to debug or step through the execution of T-SQL statements. This feature is very useful when trying to troubleshoot stored procedures or user-defined functions.
Note SSMS provides the ability to debug or step through the execution of T-SQL statements. This feature is very useful when trying to troubleshoot stored procedures or user-defined functions.
Let’s add some useful content to your new database using the Query Editor document window. To create a new table and fill the table with useful data, type the following script:
USE BankOfFees

GO

CREATE TABLE Customers

(customer_id INT NOT NULL,

first_name VARCHAR(50) NOT NULL,

last_name VARCHAR(50) NOT NULL)

GO
INSERT INTO Customers

VALUES (1,'Barack','Obama'),

VALUES (2,'George','Bush'),

VALUES (3,'Bill','Clinton')

GO
Next, click the “! Execute” button, or press the F5 key to run this script. If everything was typed correctly, you should see a successful message in the Results pane.
To view the data you just inserted into the table, you can use the SELECT statement as follows:
SELECT * FROM Customers
Executing this statement will yield the following result in the Results pane:
customer_id  first_name  last_name


1                Barack       Obama


2                George       Bush


3                Bill         Clinton
Document Windows
Document window is the technical term used within SSMS to describe the multiple-tab capabilities that exist. SSMS creates a document window for various features and spawns a dialog box at other times. Some of the different kinds of uses of document windows include the Query Editor, Object Explorer’s Details window, and the Activity Monitor tool.
Clicking the New Query button will create a new document window that hosts a Query Editor. However, if you select Properties from the context menu of a database, you will get a dialog box. There is some reasoning behind the two different approaches. When you want to create or edit a query, you probably want a rich development experience, and because of technical reasons, these features can be leveraged only while inside a document window. If you are simply looking at database properties, though, you don’t need any rich-experience capabilities, so you will just have a dialog box. One of the other reasons for using dialog boxes is the usability issue with having multiple document windows. Every time you create a new query, SSMS will create another document window. If SSMS created a document window for every other action, such as looking at database properties, that could result in a lot of windows. Depending on your screen resolution, SSMS will show only two or three document windows at a time; the rest will be located under a small drop-down, as shown in Figure 3-8.
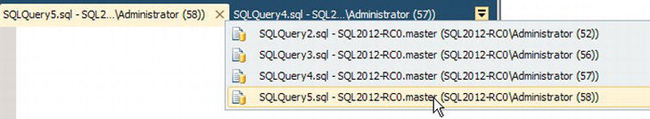
Figure 3-8. Document window drop-down showing additional queries
Results Pane
When you issue queries against a SQL Server instance, the results are returned in the Results pane. The results can be in either text or grid form. This option can be toggled using the “Results to” context menu item of the Query menu option in SSMS.
Usually, more than one tab is available in the Results pane after you issue a query. The Results tab shows you the results of the query. The Messages tab shows you information that SQL Server returned about the query such as how many rows were returned and whether there were any errors. When you start digging into query execution plans, there will be a third tab, Execution Plan, to show you how SQL Server will go about executing your query. Execution plans tell you which indexes, if any, will be used and how much I/O will occur as a result of your query.
![]() Tip For an in-depth look at execution plans and how to read them, pick up a copy of Grant Fritchey’s book, Dissecting SQL Server Execution Plans (Simple Talk Publishing, 2008), which is about reading the plans. Another helpful book is SQL Server 2008 Query Performance Tuning Distilled (Apress, 2009), coauthored by Grant Fritchey and Sajal Dam, which helps you make changes to improve those plans.
Tip For an in-depth look at execution plans and how to read them, pick up a copy of Grant Fritchey’s book, Dissecting SQL Server Execution Plans (Simple Talk Publishing, 2008), which is about reading the plans. Another helpful book is SQL Server 2008 Query Performance Tuning Distilled (Apress, 2009), coauthored by Grant Fritchey and Sajal Dam, which helps you make changes to improve those plans.
Obtaining information from the results grid is easy. With a mouse, you can right-click and copy data to the clipboard. One of the nice new features within SQL Server is the ability to “copy with headers.” This context menu item will copy the column headers in addition to the data you selected.
Managing Multiple Servers
SQL Server has been designed to handle enterprise workloads. Chances are these types of enterprises have more than one instance of SQL Server that needs to be managed. In the following sections, you will learn about three of the many features within SSMS that enhance the multiserver management experience.
Registered Servers
Being able to keep a list of all the servers that you need to manage is important. The Registered Servers window enables you to keep and maintain that list all in one place. You can open the Registered Servers window by selecting View Registered Servers.
When you open the Registered Servers window for the first time, you may see only two folders under the Database Engine node. The Local Server Groups child node will contain local definitions of servers that are local to the client machine from which you are running SSMS. If you used another SSMS on someone else’s client machine, your Local Server Groups node would not show up. If you want to create a shared list of SQL Server instances, you want to consider creating these in the Central Management Servers node.
A central management server is not another type of server that requires its own licensing; rather, it’s simply a SQL Server instance that you designate as a central management server (CMS). The CMS serves two main purposes. The first purpose is to simply retain a list of registered servers. Having a central place that contains registered servers allows you to tell other DBAs where to connect for the latest list of servers. It eliminates the need for exporting the list, e-mailing it around to all the DBAs, and then running the risk of someone having an outdated list. The next purpose of the CMS has to do with easily evaluating policies against multiple servers. Policy-based management is discussed in more detail in the upcoming section “Policy-Based Management.”
The Registered Servers window also applies to other server types. Take a look at the buttons right below the title bar in Figure 3-9. Each of these icons represents a different server connection type. These different types include SQL Server Analysis Services, SQL Server Reporting Services, SQL Server Compact Edition, and SQL Server Integration Services. For example, you can now create a list of all your reporting servers.
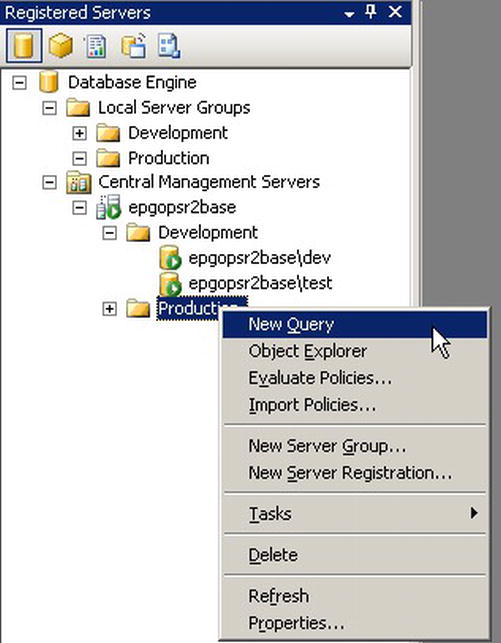
Figure 3-9. Registered Servers window
To add a server to the list of registered servers, right-click the Local Server Groups node, and select New Server Registration. This will launch the New Server Registration dialog box. Simply type in a server name, or use localhost if your server is on the same machine as SSMS. When you click OK, your server will show up under the Local Server Groups node. If you want to be neat about things, you could create folders or server groups under the Local Server Groups node.
Queries Against Multiple Servers
In Figure 3-9, the Production folder is selected, and you have the option of issuing a new query. Being able to issue queries against multiple instances without any additional setup and configuration work is extremely valuable.
![]() Note When you launch a new query for more than one SQL Server instance, the yellow banner located on the bottom of the Query Editor document window will turn pink. This is just a visual cue that whatever you plan to do within that Query Editor window will affect multiple server instances.
Note When you launch a new query for more than one SQL Server instance, the yellow banner located on the bottom of the Query Editor document window will turn pink. This is just a visual cue that whatever you plan to do within that Query Editor window will affect multiple server instances.
Policy-Based Management
Group policies within the Windows operating system allow administrators to define policies governing password expiration, desktop backgrounds, available printers to use, and a bunch of other items. Policy-based management (PBM) is SQL Server’s version of Windows group policies. Although there is no integration between the two policy engines, DBAs will no doubt be pleased at the flexibility and power of PBM.
With PBM, a DBA can define a policy and either periodically evaluate that policy or schedule the evaluation. If the policy is based on a Data Definition Language (DDL) operation such as creating a table, the policy can either log a violation of the policy to the error log at the time of statement execution or roll back the transaction, preventing execution of the change.
There are many scenarios for using PBM. For security compliance, you could create a policy that ensures encryption is enabled on the database. You could also check that certain tables are audited and perform other security-related checks.
In a multiserver scenario, SSMS makes it easy to evaluate policies across all servers either by leveraging the Registered Servers window through SSMS or by using PowerShell from the command line. PowerShell is a scripting framework for Windows. SQL Server includes a PowerShell provider that enables you to do actions such as evaluate policies from PowerShell scripts. PowerShell will be discussed in more detail later in this chapter.
PBM supports down-level servers: it is possible to create a policy and evaluate it against older version SQL Servers like SQL Server 2005 and SQL Server 2008. The exception to the experience is that you cannot proactively prevent actions that cause policy violations. For example, in SQL Server 2008, you could roll back the transaction if a user tried to create a table that didn’t start with the letters TBL. Since SQL Server 2005 does not know about PBM, you can evaluate your policies only against this server version.
Monitoring Server Activity
Many software development companies make money selling server monitoring software. Microsoft has its own enterprise-wide monitoring solution called Microsoft System Center Operations Manager (SCOM). SCOM does provide capabilities to bubble up information about all your SQL Server instances. However, if you don’t have the budget for these enterprise-wide solutions, you can still leverage some of the great features within SQL Server to answer some of the same questions.
Activity Monitor
Activity Monitor (AM) allows you to monitor the state of SQL Server including active connections, active processes, resource contention including any locks, and many more valuable bits of information. AM can be launched from the toolbar by clicking the Activity Monitor icon. This icon is located to the right of the Print icon; Figure 3-10 shows the Recent Expensive Queries collection expanded.
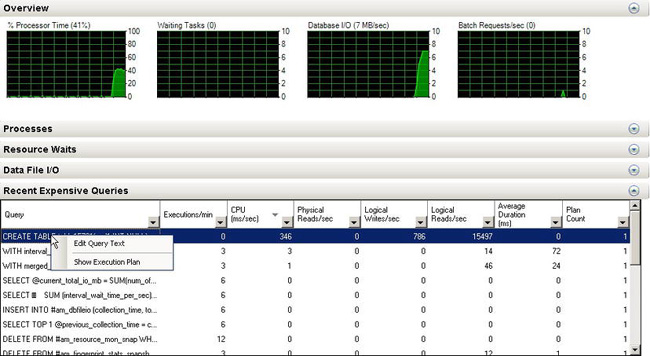
Figure 3-10. Activity Monitor showing the Recent Expensive Queries collection
In Figure 3-10, a CREATE TABLE statement has been issued, and it is causing a lot of logical reads and writes. If you wanted to investigate this further, you would simply right-click the statement and edit the query text or view the execution plan. Having the ability to easily see the most expensive queries without having to set up a special trace is incredibly valuable. If a user comes to your desk and tells you that an application is running slowly, this is one of the first things you can do to see whether a query is having problems.
AM has a few more expand and collapse regions that add a lot of value for the DBA. The Overview region shows CPU time as well as database I/O. The Process region shows all the active SQL Server processes, along with their corresponding Security Identifiers (SIDs). From here, you can kill a process or set up a SQL trace to trace the process using the SQL Server Profiler tool. The Resource Waits collection shows the number of active wait states such as locking or buffer I/Os. The Data File I/O region provides performance information on a per-database basis. You can tell how many megabytes per second are being read from and written to your database.
Performance Data Collector
Activity Monitor is great at giving you an accurate representation of what is happening currently with your SQL Server. However, trend information, such as how fast your log file is growing or what the most expensive query is over the past week, is difficult to obtain from Activity Monitor. Performance Data Collector (PDC) is the solution to gathering and analyzing performance information for your SQL Server enterprise. PDC collects performance information gathered from various T-SQL statements, Windows System Monitor counters, and Windows Management Instrumentation (WMI) classes. It stores this information on the local server, and periodically, it will upload this information to a management data warehouse. A management data warehouse is simply a database on a server you designate. Performance information is gathered from all the servers in your organization and stored in the warehouse. Since you have a single place with all this valuable information, you can run really useful reports.
To start collecting performance data, you need to first define the management database. You can do this by selecting the Configure Management Data Warehouse menu item from the Data Collection node of the Management node in Object Explorer. This action launches a wizard that will simply create the database used to store the performance results. Once this database is created, you need to rerun this wizard on each instance for which you want to collect data. When the wizard is run again, be sure to select the “Set up data collection” option. The wizard will ask where the management data warehouse is, and then it will create the four system collection sets: Disk Usage, Query Statistics, Server Activity, and Utility Information. Although adding your own collection sets is possible, SQL Server provides these four out of the box. The word from the product team is that much thought went into exactly what counters and queries each collection set makes. The product team asked Microsoft Product Support which queries and counters were used when customers called in with SQL Server questions. The team also asked a number of their partners and customers. Together, this information was rolled up into these three counters.
You will find value in simply enabling all three counters with the default settings. Doing so uses only about 300MB to 500MB on your local server. The default setting for data retention is 14 days. If you want to keep the historical data around longer than that, you can easily modify this property in the Properties dialog box of each collection set.
After you enable the collector and run it for enough time to gather some useful data, you can view some useful reports out of the box. You can find these reports in the Reports context menu of the database that is the management data warehouse. Figure 3-11 shows a subset of the Server Activity report.
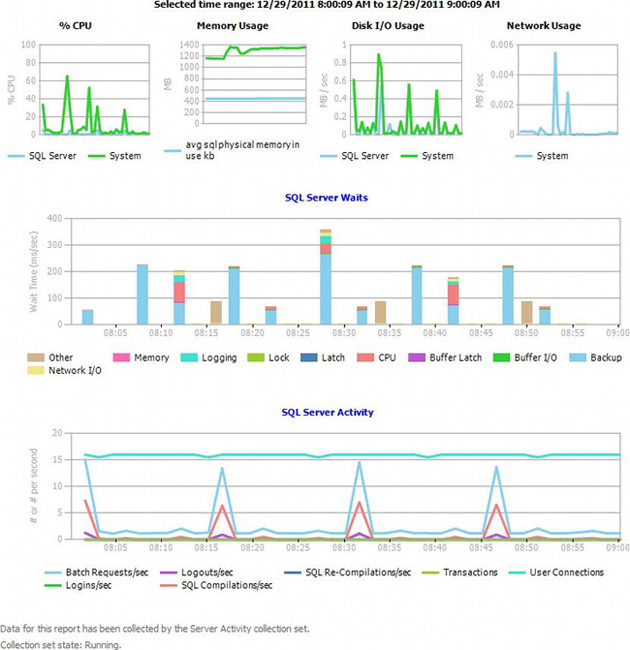
Figure 3-11. Subset of the Server Activity report
From the report in Figure 3-11, you can easily obtain critical information such as the occurrence of some locking around 16:30. Since these activity reports are interactive, you can click any of the blue locking bars to obtain another report detailing the SQL Server waits. Figure 3-12 shows parts of this subreport.
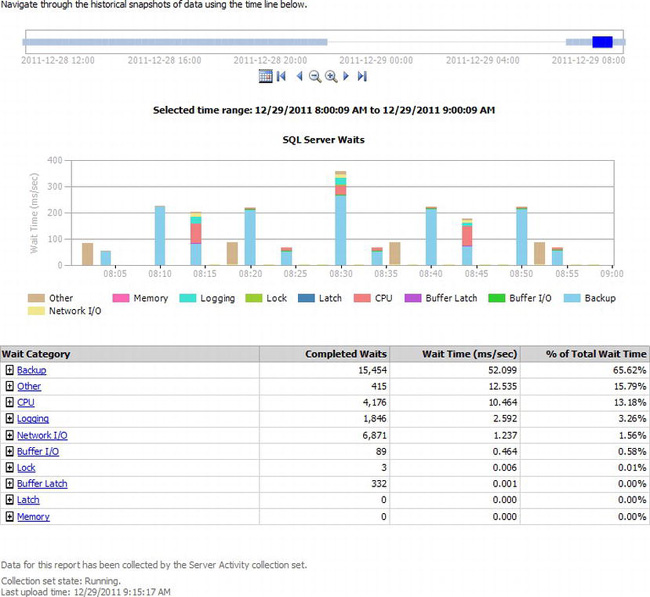
Figure 3-12. A portion of the SQL Server Waits subreport
As you click through, you obtain more detail about the selected objects. In this case, you can see details on the various wait states that occurred for this time series. Clicking the Lock hyperlink will link to another report detailing the connections that were causing the locking behavior.
Query Statistics is another report provided out of the box. With Query Statistics, you get a graphical report showing query information across the time series you specified. Figure 3-13 shows a portion of the Query Statistics report.
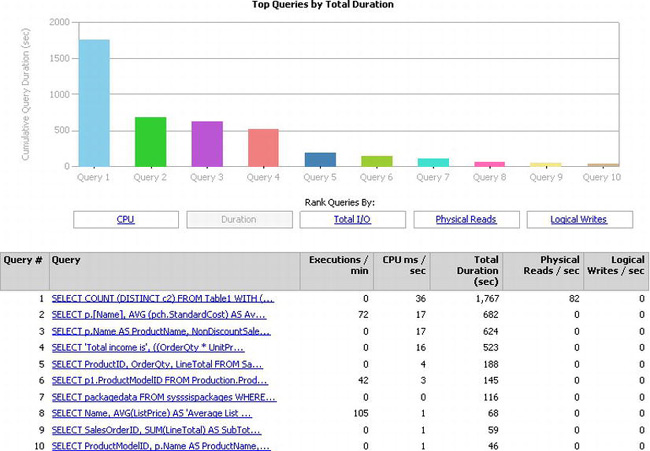
Figure 3-13. A portion of Query Statistics report
Figure 3-13 shows that query 1 took more than 1,700 seconds. Clicking that query will produce yet another report detailing information on the query, including physical reads and writes and a link to the execution plan.
The Disk Summary report is the third report provided out of the box. This report shows trend information for data and log files of all databases within the server. It is a useful report to run to see how fast or slow your files are growing.
Reports
SQL Server comes with a lot of reports for the DBA to run. These reports provide additional insight into your database. For example, clicking the Reports context menu within a specific database will yield a number of useful reports. Some of these reports include Disk Usage by Table, Top Transactions by Age, and Backup and Restore Events.
Figure 3-14 shows the Server Dashboard report for my new installation of SQL Server.
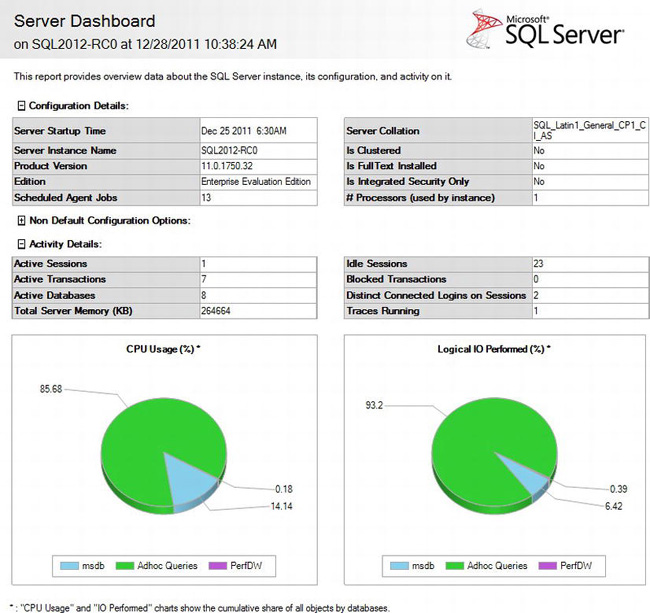
Figure 3-14. Disk usage for the master database
The report in Figure 3-14 shows the disk usage of the master database in the newly created SQL Server instance. At this point, since we just created this instance, there is not much activity, and the master is really small. However, you can still see the usefulness of the information provided on the report.
Other Tools from the Start Menu
Although SSMS is the most frequently used of the tools supplied in a standard install, there are other tools that you should be aware of. In this section, we’ll talk about other tools available from the Start menu. These are largely GUI-based tools. Then, in the next major section, we’ll talk about command-line tools that you access via the Windows command prompt.
In Chapter 2, you performed a minimal installation of SQL Server. That installation is enough to go through the relational database engine examples in this book. However, in this section, you will learn about some of the additional tools that are available when you install other components like Analysis Services and Reporting Services. If you want to experiment with these features, simply run the SQL Server Installation Center application under the Configuration Tools Start menu. This will launch the Installation Center, and from there, you can click the Installation panel and click the “add features to an existing installation” link. This will launch a wizard that allows you to add the rest of the tools to your recent SQL Server installation.
The Microsoft SQL Server 2010 folder is where the bulk of the tools available to SQL Server users reside. Figure 3-15 shows the SQL Server 2012 folder within the Start menu.
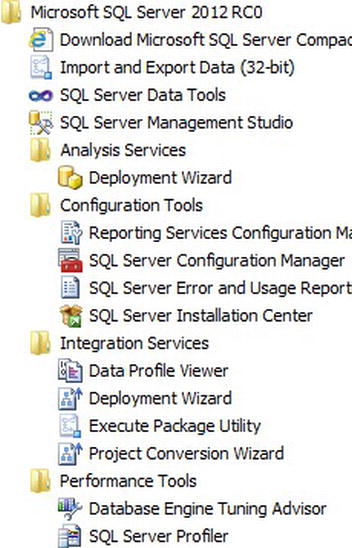
Figure 3-15. SQL Server 2012 Start menu
It may be a surprise to some folks to see Visual Studio 2010 installed when you install SQL Server 2012. This is because some of the business intelligence tools such as Analysis Services, Integration Services, and Reporting Services leverage the Visual Studio shell, and thus, you also have Visual Studio 2010 installed. Don’t get too excited, though; it’s just the shell and doesn’t contain any programming languages like Visual C#.
Analysis Services Folder
SQL Server Analysis Services (SSAS) is Microsoft’s business intelligence workhorse. It enables users to easily perform online analytical processing (OLAP) analysis, develop key performance indicator (KPI) scorecards, and perform data mining on existing data. OLAP has traditionally been a specialty skill among DBAs. However, with SQL Server providing rich out-of-the-box analytical functionality, companies are taking advantage and requiring their otherwise relational DBA to be more involved in OLAP and data warehousing.
In the Analysis Services folder, you find a single application called Deployment Wizard. This tool takes projects made with the SQL Server Data Tools and deploys them to the specified server.
Configuration Tools Folder
The Configuration Tools folder contains the following four applications: SQL Server Installation Center, SQL Server Error and Usage Reporting, Reporting Services Configuration Manager, and SQL Server Configuration Manager.
SQL Server Installation Center
The SQL Server Installation Center is the same application you saw when you initially launched setup.exe in Chapter 2. This link just makes finding this application more convenient, so you’re not spending time digging around the file system.
SQL Server Error and Usage Reporting
Have you ever wondered why Microsoft is so persistent at asking its customers whether error reports and usage information can be sent to Microsoft for analysis? Some may think it’s an attempt to obtain information with an eye toward spying on customers, but in reality, this is far from the truth. The dumps that are sent out do not contain user data and are used essentially to fix bugs within the product. You can probably guess that if Microsoft sees thousands of the same kind of error dumps, it might realize that it has an issue with something. The usage reporting piece of this also does not send any customer-sensitive data; rather, it simply provides answers to questions such as, “How many times did you access a certain dialog box?” or “How many tables do you have in each database?” This usage information helps SQL Server product development in a number of ways. For example, if the trend for customers is to have a really large number of tables, SQL Server Management Tools should provide features that make managing numerous tables within a database easier. The SQL Error and Usage Reporting application within the Configuration Tools folder allows you to specify whether you want to store and send error and usage information to Microsoft. Figure 3-16 shows this application.
![]() Note Figure 3-16 is shown with the options expanded.
Note Figure 3-16 is shown with the options expanded.
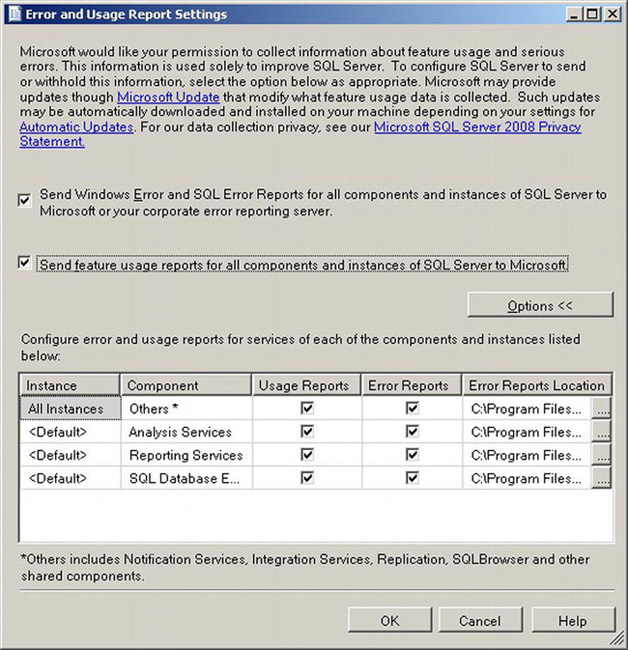
Figure 3-16. Error and Usage Report Settings dialog box
The Error and Usage Report Settings dialog box also allows for the selection of specific components within SQL Server. If you were curious about what data is collected, you can read these reports right from the file path specified in the Error Reports Location column. This valuable information is available once you click the Options button.
Reporting Services Configuration Manager
The Reporting Services Configuration Manager is also available from the Configuration Tools folder. This tool is used to manage the configuration of Reporting Services and is shown in Figure 3-17.
![]() Note When you launch the Reporting Services Configuration Manager application, you will be asked to connect to a server instance.
Note When you launch the Reporting Services Configuration Manager application, you will be asked to connect to a server instance.
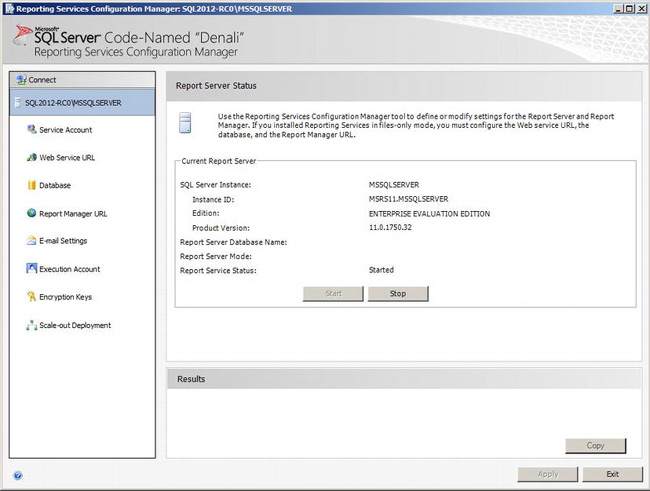
Figure 3-17. Reporting Services Configuration Manager
Reporting Services originally shipped as an add-on to SQL Server 2000. Since then, it has undergone a plethora of changes and improvements and has now become an enterprise reporting platform. The Reporting Services Configuration Manager shown in Figure 3-17 allows administrators to define or change the setting of Reporting Services components. This tool is not responsible for managing specific reports; rather, it’s focused on the general configuration of Reporting Services.
SQL Server Configuration Manager
The SQL Server Configuration Manager is an important tool to become familiar with if you are a DBA. This tool is a Microsoft management console (MMC) snap-in and allows you to manage three important aspects of SQL Server. First, it allows you to manage all the services that are related to SQL Server. Figure 3-18 shows the SQL Server Services node of SQL Server Configuration Manager.
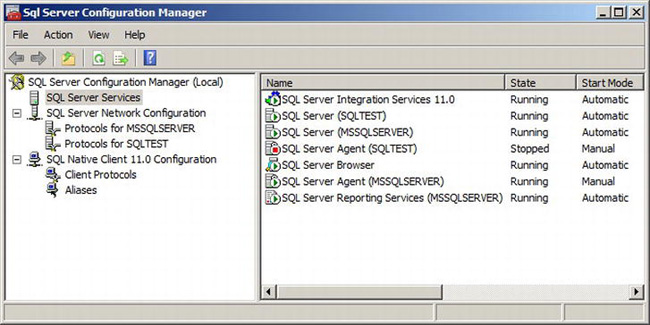
Figure 3-18. SQL Server Services node in SQL Server Configuration Manager
Managing the services from this snap-in instead of the Services control applet in Windows is a very important habit to start. The main reason for this has to do with the actions required to change the service account. Simply changing the username for the service, which is what the Windows Services applet in Control Panel does, is not enough. SQL Server has various folders and registry keys that need to have their access control lists (ACLs) updated upon this new change. If you decide not to listen to us and insist on changing the service account using the Windows Services applet, depending on the rights of the new account used, your service may simply fail to start because of a lack of permissions on either the file system or the registry. Thus, make your life simple, and use the SQL Server Configuration Manager only to manage services related to SQL Server.
The Services node does provide a lot more features other than simple service account management. If you wanted to enable the Filestream feature, you could do so through the Properties dialog box of the SQL Server service. Another important feature within the Properties dialog box of the SQL Server service itself is that of startup parameters. To view or modify these for the SQL Server service, click the Startup Parameters tab. In some rare occasions, if you had to start SQL Server in single-user mode or start SQL Server with a special trace flag, you would do this by passing a startup parameter.
The next significant behavior of SQL Server you can manage from this tool is network configuration. The question this node is going to answer is, “Which protocols will you allow SQL Server to allow connections from?” Figure 3-19 shows the Protocols node.
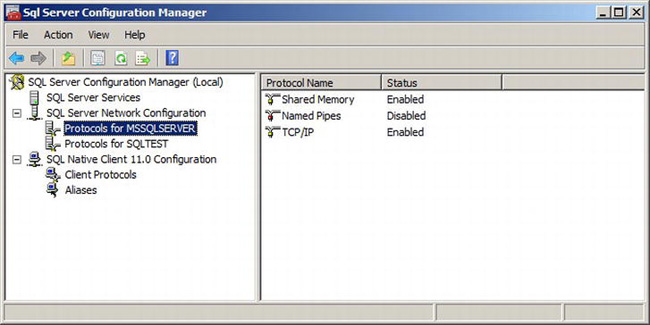
Figure 3-19. Protocols node in SQL Server Configuration Manager
Since you installed the evaluation edition, the only protocol that is enabled is Shared Memory. This is also the default behavior for new installations of Developer and Express editions of SQL Server. Shared Memory can make connections only when the client is physically on the same machine as the user. Thus, if you had tried and failed to remotely connect to this server (perhaps through another client machine), having only Shared Memory enabled is probably the reason. If you want to connect from a remote machine, you should use any of the other protocols. The most common one used to communicate with SQL Server is TCP/IP.
If you want to encrypt the flow of traffic to and from SQL Server, the Properties dialog box of the Protocols node allows you to force all traffic coming to and from SQL Server to be encrypted.
The discussion up until now involves the scenario where clients make connections to SQL Server. SQL Server can also be a client. Figure 3-20 shows the Client Protocols node.
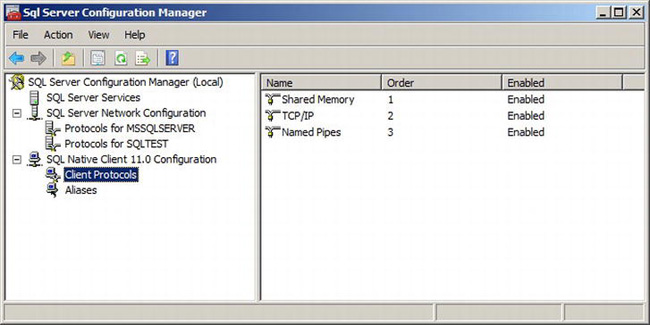
Figure 3-20. The Client Protocols node within SQL Server Configuration Manager
In this default behavior, all three protocols are enabled. In addition, a column called Order describes the order of priority of protocols. An order of 1 means that the protocol should be used first to establish a connection.
Each one of these protocols has a different purpose. For example, to communicate on the Internet, you use TCP/IP. TCP/IP is the most frequently used protocol, because most LANs are set up to use it. Shared Memory is special, because it works only within the same server. Thus, you cannot make a remote machine connection using Shared Memory. For more information on SQL Server protocols, check out the SQL Server Books Online article called “Choosing a Network Protocol” at http://msdn.microsoft.com/en-us/library/ms187892.aspx. If you want to get deep into protocols, there are some good articles on the SQL Protocols blog site at http://blogs.msdn.com/sql_protocols.
Documentation and Community Folder
The Documentation and Community folder contains useful resources for learning more about SQL Server. This folder contains a hyperlink to the SQL Server 2012 resource center, which is a web site containing a variety of information on SQL Server such as forums and other discussion groups. The folder also contains Community Project and Samples and SQL Server Documentation. Note that this folder and its components are installed when you select the Documentation Components feature option in setup. If you did not do this when installing SQL Server, you can simply rerun the setup and install just the documentation components.
Community Projects and Samples
The CodePlex web page contains SQL Server code samples and sample databases. All samples are available as downloads through the CodePlex web site at www.codeplex.com. CodePlex is Microsoft’s effort at an open source developer community. You can download not only SQL code but also code from a variety of other products and projects uploaded by users just like yourself.
SQL Server Documentation
Books Online is by far the most useful resource readily available to you. This set of documentation covers a plethora of topics such as how to implement a database mirror and the T-SQL syntax for the CREATE DATABASE statement. This documentation will be your best friend, so it’s best to spend some time getting familiar with this resource.
SQL Server Books Online can be installed locally on your server or client machine. You can also access this content through Microsoft’s web site (http://msdn.microsoft.com/en-us/library/ms130214(v=SQL.110).aspx). Note that Books Online content changes more frequently than the product does; it appears to be refreshed once every few months. The latest version can always be downloaded from Microsoft via www.microsoft.com/downloads. Simply type sql server books online 2012 in the search box, and find the most recent date.
Integration Services Folder
SQL Server’s Integration Services is Microsoft’s extract, transform, and load (ETL) platform for SQL Server. A data warehouse consists of data that comes from multiple sources and multiple formats. An ETL tool is used to extract this information from all these different sources, transform it into a common format (if necessary), and load it into the data warehouse. As we mentioned, SQL Server’s version of an ETL tool is called SQL Server Integration Services. The capabilities that this tool exposes yield use cases that are far beyond the simple ETL operation of a data warehouse. SSIS is so extensible that features like maintenance plans within SQL Server Management Studio leverage the powerful workflow designer. Most of the functionality, including the ability to create SSIS packages, is contained within the SQL Server Data Tool.
Data Profiler Viewer
The Data Profiler task in SSIS allows you to quickly assess key statistics about data in a database table. Statistics include data points such as column value and length distribution, column null ratio, column patterns, and functional dependencies. Since SSIS has no native way to view the output of the Data Profiler task, the Data Profiler Viewer tool can be used in this scenario.
Execute Package Utility
This utility provides you with a graphical way to execute a package. When you run an SSIS package, a lot of options are available such as where to load the package from, where to write log files to, and so on. All of these options can be specified on the command line as well, but this tool makes doing so easier.
Project Conversion Wizard
A lot of improvements and changes were made to how SSIS packages can be deployed in SQL Server 2012. This wizard generates a project development file, which is a compiled project consisting of packages and parameters. This project development file can then easily be used to deploy your SSIS project to an Integration Services catalog. For more information on the changes to SSIS with respect to deployment, check out the SQLServerPedia article, “SSIS 2012: Deploying Projects” located at http://sqlserverpedia.com/blog/sql-server-bloggers/sql-university%e2%80%93-ssis-2012-deploying-projects-%e2%80%93lesson-one.
Performance Tools Folder
Performance is one of the most common questions and investigations fielded by database administrators. SQL Server 2008 comes with two GUI-based tools out of the box: Database Engine Tuning Advisor and SQL Server Profiler.
Database Engine Tuning Advisor
Database performance is affected by a variety of factors. One of the initial investigations when troubleshooting performance is to analyze the execution plan of the query. The execution plan tells you things such as which indexes were used, if any were used at all. The Database Engine Tuning Advisor will analyze a workload against a given database and suggest ways to improve the performance. More commonly, it will suggest indexes where they do not currently exist. It will even provide the script to use, so all you have to do is click the button to use the new index.
SQL Server Profiler
One of the event engines within SQL Server Profiler is called SQL Trace. SQL Trace is primarily used for performance tuning and optimization efforts. With SQL Trace, you could set up the trace to collect every T-SQL statement executed. With these data collected, you could analyze and view the results to see things such as how long the query took and under what security context it was running. You can find a more in-depth discussion of SQL Server Profiler in Chapter 11. Note that SQL Trace is now deprecated in SQL Server 2012. Its replacement is a feature called Extended Events. Although SQL Profiler is still in the product, you should invest the time learning the new eventing model.
Import and Export Data Wizard
The Import and Export Data Wizard makes moving data from a source to a destination easy. The wizard will not move any objects over as part of the deployment. To move objects, you need to use another tool like the Copy Database Wizard. The end product of this wizard is a functional SSIS package that will import or export data. This package can be used as a great starting point for you to modify and work it into your own requirements.
SQL Server Data Tools
SQL Server Data Tools (SSDT) is the main development environment used by SQL Server Analysis Services, SQL Server Integration Services, and SQL Server Reporting Services. In earlier versions, this tool was called the Business Intelligence Development Studio (BIDS). Microsoft changed the name most likely due to the inclusion of additional relational database development capabilities. With SSDT, you can also create database projects that can be deployed on-premise against a SQL Server relational database engine or in the cloud via SQL Azure.
The look and feel of SSDT is similar to SQL Server Management Studio. These products all leverage the Visual Studio shell, so if you already have Visual Studio 2010 installed, these products just show up. If you do not have Visual Studio 2010, a lightweight version of Visual Studio is installed for you when you install SSDT. That is why you see a Visual Studio 2010 menu item when you install the SQL Server Data Tools. Although a discussion on each of these products may require a book itself, it’s helpful if you spend the time to learn these technologies.
Command-Line Tools
There are two kinds of people in this world: those who do everything using a command-line interface and those who love using a graphical user interface (GUI) (some of you may fall somewhere in between, and thus violate our hypothesis). SQL Server has traditionally shipped with a few command-line tools. Perhaps the most popular scripting application is SQLCMD, a replacement to the aging osql.exe command-line tool. Another scripting tool that is more application agnostic is PowerShell. PowerShell is an extensible scripting engine that is part of the Windows operating system. Some of the other products in the box, like SQL Server Integration Services, have command-line interfaces as well. DTEXEC.exe is an example of an SSIS package execution utility.
SQLCMD
SQLCMD, pronounced “SQL command,” is a command-line tool used to connect to SQL Server and submit T-SQL queries and commands. With SQLCMD, you can do the following:
- Execute SQL scripts against any SQL Server instance.
- Define and pass variables from the command line as well as within scripts.
- Use predefined system variables.
- Include multiple SQL scripts inline.
- Dynamically change connections within the same script.
- Connect to SQL Server via the dedicated administrator connection (DAC).
Connecting to SQL Server
SQLCMD allows users to make multiple connections to different servers within the same script. For example, suppose you had a few simple backup database scripts that each backed up a database on a specific server. On SERVERONE, the administrator could run the following backup script to back up the ReportServer database:
File: backup_ReportServer.sql

BACKUP DATABASE [ReportServer] TO DISK='C:ackupsReportServer.bak'
On SERVERTWO, the administrator could run the following script to back up the Products database:
File: backup_Products.sql

BACKUP DATABASE [Products] TO DISK='D:SQLServerBackupsProducts.bak'
In the real world, you know that administrators tend to have lots of scripts, and each perform its own functions on a specific server. With SQLCMD, you can now consolidate these into a single script using the :CONNECT command. Let’s see this same scenario of backing up multiple databases using a single script:
File: backup_databases.sql

--Make a connection to SERVERONE using Windows Authentication

:CONNECT SERVERONE –E

--Issue a backup database command for ReportServer

BACKUP DATABASE [ReportServer] TO DISK='C:ackupsReportServer.bak'

GO


--Make a connection to SERVERTWO using Windows Authentication

:CONNECT SERVERTWO –E

--Issue a backup database command for Products database

BACKUP DATABASE [Products] TO DISK='D:SQLServerBackupsProducts.bak'

GO
Issuing the SQLCMD command sqlcmd -E -i backup_databases.sql yields the following result:
Sqlcmd: Successfully connected to server 'SERVERONE'.


Processed 280 pages for database 'ReportServer', file 'ReportServer' on file 4.


Processed 1 pages for database 'ReportServer', file 'ReportServer_log' on file 4.


BACKUP DATABASE successfully processed 281 pages in 0.369 seconds (6.238 MB/sec).


Sqlcmd: Successfully connected to server 'SERVERTWO'.


Processed 144 pages for database 'Products', file 'Products' on file 6.


Processed 1 pages for database 'Products', file 'Products_log' on file 6.


BACKUP DATABASE successfully processed 145 pages in 0.237 seconds (5.011 MB/sec)
Passing Variables
SQLCMD also provides the ability to pass variables from the command line and within the script itself. For example, assume you have a generic “backup database” script called backup_database_generic.sql that can be reused:
File: backup_database_generic.sql

:CONNECT $(myConnection)

BACKUP DATABASE $(myDatabase) TO DISK='C:ackups$(myDatabase).bak'
At this point, you could call this script from the command line using the new -v parameter. This parameter tells SQLCMD that the following text is a variable, an example of which is shown here:
C:>SQLCMD –E –i backup_database_generic.sql

 –v myConnection="." myDatabase="ReportServer"
When the backup_database_generic.sql script is run, it will have two variables defined: myConnection, which is equal to ".", and myDatabase, which is equal to "ReportServer". Alternatively, if you wanted to use variables, you also could have set the parameters within another script, as shown here:
File: backup_database_main.sql

:SETVAR myConnection .

:SETVAR myDatabase ReportServer


:R "backup_database_generic.sql"


GO
When this script is executed, SQLCMD will set the myConnection variable to "." (the period is an alias for the local server—you could have used "localhost" or the actual name of the server as well) and the myDatabase variable to "ReportServer"; then, it will insert the contents of the backup_database_generic.sql script inline.
PowerShell Provider for SQL Server
PowerShell is a command-line shell and scripting language designed with significant improvements in power and functionality when compared with VBScript and the Windows command prompt. PowerShell is available in Windows Server 2008 and is also available as a download (www.microsoft.com/powershell) for other versions of Windows. SQL Server 2012 provides a PowerShell provider that enables you to easily access SQL Server instances, SMO objects, and evaluate policies within the PowerShell environment.
![]() Note You can launch PowerShell with the SQL Server provider using
Note You can launch PowerShell with the SQL Server provider using sqlps.exe.
Not only can you easily write a script that interacts with a SQL Server instance, but in that same script, you can easily access other PowerShell providers like the one for Exchange Server. You now have a consistent, seamless experience for scripting across Microsoft products.
Consider the following example:
#Use WMI to obtain the AT Scheduler job list

$colItems = get-wmiobject -class "Win32_ScheduledJob"

-namespace "rootCIMV2" -computername "."


foreach ($objItem in $colItems)

{

$JobId = $objItem.JobID

$JobStatus = $objItem.JobStatus

$JobName = $objItem.Command


#Use the SQL Provider Invoke-SqlCmd cmdlet to insert our

## result into the JobReports table

Invoke-SqlCmd -Query "INSERT INTO master..JobReports

(job_engine, job_engine_id, job_name, job_last_outcome)

 VALUES('NT','$JobId','$JobName','$JobStatus')"

}


#Now let's obtain the job listing from the JobServer object

#REPLACE the <SERVERNAME> with your own server name!

Set-Location "SQL:<SERVERNAME>defaultJobServer"


$jobItems = get-childitem "Jobs"


foreach ($objItem in $jobItems)

{

$JobId =  $objItem.JobID

$JobStatus = $objItem.LastRunOutcome

$JobName = $objItem.Name
Invoke-SqlCmd -Query "INSERT INTO master..JobReports

(job_engine, job_engine_id, job_name, job_last_outcome)

 VALUES('AGENT','$JobId','$JobName','$JobStatus')"

}![]() Note You will have to have the SQL Server Agent service running in order for this script to work. You can start the SQL Server Agent by selecting Start from the SQL Server Agent context menu in SSMS.
Note You will have to have the SQL Server Agent service running in order for this script to work. You can start the SQL Server Agent by selecting Start from the SQL Server Agent context menu in SSMS.
This example assumes you have a table in the master database that is defined as follows:
CREATE TABLE JobReports

(job_engine CHAR(6),

job_engine_id VARCHAR(50),

job_name VARCHAR(255),

job_last_outcome VARCHAR(50),

report_time datetime DEFAULT GETDATE())
After running your code, the JobReports table would be filled with entries of both the Windows Task scheduled jobs and SQL Agent jobs. An example result set follows:
job_engine job_engine_id job_name      last_outcome report_time


---------- ------------- ------------  ------------ ------------------


NT             1         ntbackup.exe  Success      2008-01-22 15:32:29.270


NT             4         CustomApp.exe Success      2008-01-22 15:32:29.280


AGENT     3226bb84-4e…   BackupTestDB  Succeeded    2008-01-22 15:32:29.290


AGENT     642f4e27-66…   BackupDevDB   Unknown      2008-01-22 15:32:29.300


AGENT     ddc03a7b-45…   ReIndxTestDB  Unknown      2008-01-22 15:32:29.300
This script enumerates the jobs defined within the Windows Task Scheduler as well as the SQL Server Agent jobs and inserts these lists in a table. This is just one example of the seamless scripting experience that can be obtained by using PowerShell.
Summary
As a new user to SQL Server, you will probably spend most of your time using SQL Server Management Studio. This chapter covered SSMS in depth and touched on some of the features that support SSMS, including policy-based management, the Performance Data Collector, and reporting.
Microsoft also has a number of virtual labs available online. Each of these SQL Server 2012 labs drops you into a Remote Desktop connection session with a server that has SQL Server installed. In addition to the lab, you are free to explore other features within the product. You are not bound to doing only what is in the lab, although launching a lab can be a quick way to kick the tires of the product without going through the time and resource of installation.
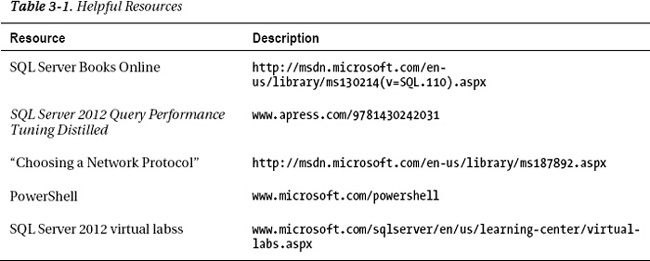
Finally, Table 3-1 lists some resources supporting the content discussed in this chapter. It’s good to do some outside reading, and you’ll find these resources helpful as you progress with SQL Server.