
![]()
Optimizing WebGL Usage
As hardware evolved, games went from two-dimensional affairs into the third dimension. This evolution also happened in the browser. Although two-dimensional rendering could be done through the use of the Canvas application programming interface (API) it wasn’t until the Web Graphics Library (WebGL) debuted that the graphics hardware was actually exposed to a lower level within the context of the browser. This API has now been implemented by every major browser vendor, making it possible to create a fully three-dimensional game without relying on a plug-in.
Game developers are power users of the platform. To push what’s possible, they need to get as much work done as is possible within the context of a frame. To do this, they optimize their code for the platform it’s running on top of. The browser is no different in this regard. To optimize a game on this platform, it’s important to understand the inner workings of the hardware and play to its strengths.
With WebGL it’s especially important to understand what’s going on under the hood. The API, although providing a low-level interface, has an overhead that is much more significant than the equivalent native code. By mastering its usage, the amount of time spent in the API can be minimized, leaving more time for the other game systems to do their work.
To show how to optimize the rendering side of a WebGL application effectively, this chapter will present the following information:
- What happens when a WebGL call is invoked, including the overhead behind various security checks and the browser’s rendering model
- How WebGL works internally and how this can be used to minimize the number of calls to the API
- The sketching out of a rendering framework on top of WebGL that ensures optimal usage
- Tools that can be used to prove that the rendering is ideal
- Additional functionality present in extensions that can further reduce the number of calls to WebGL
- General techniques that can be used when presenting a scene to the renderer
The Anatomy of a WebGL Call
To learn how to optimize an application’s usage of WebGL, it’s important to understand what happens within the browser whenever a call is made. Although at its core, WebGL is a way of exposing Open Graphics Library for Embedded Systems (OpenGL ES) to the Web, the implementation is more complicated than just providing low-level bindings to the graphics API. WebGL has to slot into the general rendering of web content within the browser, and it has to ensure that security is not compromised through its usage. Thus, the operation within the browser is more elaborate than it would seem at first glance.
To illustrate the steps that take place during the execution of a WebGL call, the behavior of Blink, the rendering engine that powers Google Chrome, can be highlighted (see Figure 9-1). The implementation presented is current at the time of writing; however, the internals of Blink are subject to change at any time. Even if the internals did change, or if another browser’s functionality were examined, the gist would be roughly the same.
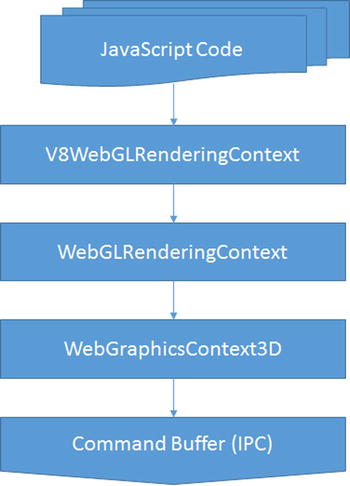
Figure 9-1. Blink data flow
For those interested in perusing the actual implementation, there is the Chromium code search, which can be queried for the classes in question.
Listing 9-1 sketches out a general logic to rendering a geometry to the screen. Now, what happens within the browser when the drawArrays call is made? To answer that, the call’s flow through the browser will be traced through each layer.
Listing 9-1. Drawing a Model
function drawModel() {
  bindShaderProgram();
  bindTextures();
  bindVertexBuffer();

  // Invoke the draw call
  gl.drawArrays(gl.TRIANGLE_STRIP, 0, 16);
}
The lifetime of a WebGL call begins within the context of the scripting language’s virtual machine; in the case of Blink, this is fulfilled within the V8 JavaScript engine. Any API the browser supports requires there to be glue between the script’s execution context and the browser. The cohesion between the two is specified by the Web Interface Definition Language (Web IDL) format, a standard that describes interfaces, which are to be implemented within a web browser, as shown in Listing 9-2.
Listing 9-2. WebGLRenderingContext, IDL Portion
interface WebGLRenderingContext {
  void drawArrays(GLenum mode, GLint first, GLsizei count);
  void drawElements(GLenum mode, GLsizei count, GLenum type, GLintptr offset);
}
The Web IDL specification outlines the interface available to the scripting language. This specification is used by the browser to determine how data should be marshalled between them and the virtual machine. In general, this layer is generated automatically during the build process, though some bindings are created by hand. The result of this operation within Blink is the V8WebGLRenderingContext, the first layer that the WebGL call passes through.
WebGL puts additional restraints on top of the OpenGL ES specification to ensure a secure environment, and the purpose of the WebGLRenderingContext is to verify that this contract is not broken. In the case of a drawArray call, the browser will verify that the arguments passed in are correct by checking that a valid offset and count were supplied and that the current render state is legitimate. If everything checks out, then it’s off to the next layer, the WebGraphicsContext3D.
From here on, the explanation gets very Blink specific, as it has its own ideas on how compositing should be accomplished within a browser. Because of this, some of the finer points will be glossed over;for more information, refer to the Google document GPU Accelerated Compositing in Chrome (http://www.chromium.org/developers/design-documents/gpu-accelerated-compositing-in-chrome), which goes into considerable detail on the compositing architecture.
As mentioned earlier WebGL is not the only portion of the browser that utilizes hardware acceleration; Blink may promote portions of the page to render on the graphics card. The GraphicsContext3D class handles the needs of any portion of the browser requiring hardware accelerated rendering, furnishing an interface very similar to OpenGL.
At some point in the rendering process, the underlying OpenGL implementation has to be hit, yet that does not actually occur on the same process that the WebGL command originated in. Instead, the interaction with the graphics processing unit (GPU) is architected to occur on a completely different process. The aptly named GPU process handles the hardware-accelerated rendering, which receives its marching orders through the renderer process. The WebGraphicsContext3D populates a command buffer in a shared memory location that can be accessed by both processes, thereby giving the GPU process the required steps to render the scene properly.
Over on the GPU process side, the populated command buffer is vetted yet again. This is for security purposes, as the GPU process does not trust the renderer process, because the GPU process has no way to determine if it was compromised when loading a site. Once verified, each command is shipped off to the OpenGL implementation of the platform. For platforms other than Windows the command reaches the graphics card’s driver. On Windows the command goes through an additional transformation by the Almost Native Graphics Layer Engine (ANGLE) library, which converts the OpenGL commands into their DirectX counterparts. Only after all these steps does the WebGL command reach the actual graphics card.
These steps occur whenever a WebGL call is made. This overhead cannot be avoided and is essentially the penalty you have to pay for doing three-dimensionality in the browser. However, this cost is not a deal breaker; it just means that one has to be mindful of how the API is being used in order to maximize performance. What that boils down to is minimizing the number of calls made to the API while rendering the scene. To accomplish this at this low level, the inner workings of WebGL need to be illuminated.
How WebGL Works
The most important thing to know about WebGL is that it is a state machine. The vast majority of the commands available will modify either the entire state of the rendering or the internal state of an object provided through WebGL. This knowledge is key to minimizing the number of calls made by the application.
To illustrate this point a simple scene can be profiled. One of the easiest examples, a “hello world” of sorts for WebGL, is the spinning cube rendered with a texture (see Listing 9-3). Although not a solid, real-world example, the cube showcases how calls can be reduced, owing to state being retained.
Listing 9-3. Rendering a Cube
function drawScene() {
  // Clear the buffers.
  gl.clearColor(0.0, 0.0, 0.0, 1.0);
  gl.clearDepth(1.0);
  gl.clear(gl.COLOR_BUFFER_BIT | gl.DEPTH_BUFFER_BIT);

  // Set the depth test
  gl.enable(gl.DEPTH_TEST);
  gl.depthFunc(gl.LEQUAL);

  // Create the perspective matrix
  perspectiveMatrix = makePerspective(45, 640.0/480.0, 0.1, 100.0);

  // Create the model view matrix
  loadIdentity();
  mvTranslate([-0.0, 0.0, -6.0]);
  mvPushMatrix();
  mvRotate(cubeRotation, [1, 0, 1]);

  // Set the program and its uniforms
  gl.useProgram(shaderProgram);

  var pUniform = gl.getUniformLocation(shaderProgram, "uPMatrix");
  gl.uniformMatrix4fv(pUniform, false, new Float32Array(perspectiveMatrix.flatten()));

  var mvUniform = gl.getUniformLocation(shaderProgram, "uMVMatrix");
  gl.uniformMatrix4fv(mvUniform, false, new Float32Array(mvMatrix.flatten()));

  gl.uniform1i(gl.getUniformLocation(shaderProgram, "uSampler"), 0);

  // Specify the texture.
  gl.activeTexture(gl.TEXTURE0);
  gl.bindTexture(gl.TEXTURE_2D, cubeTexture);
  gl.texParameteri(gl.TEXTURE_2D, gl.TEXTURE_MAG_FILTER, gl.LINEAR);
  gl.texParameteri(gl.TEXTURE_2D, gl.TEXTURE_MIN_FILTER, gl.LINEAR_MIPMAP_NEAREST);

  // Set the position for the vertices
  gl.bindBuffer(gl.ARRAY_BUFFER, cubeVerticesBuffer);
  gl.enableVertexAttribArray(gl.getAttribLocation(shaderProgram, "aVertexPosition"));
  gl.vertexAttribPointer(vertexPositionAttribute, 3, gl.FLOAT, false, 0, 0);

  // Set the texture coordinates attribute for the vertices
  gl.bindBuffer(gl.ARRAY_BUFFER, cubeVerticesTextureCoordBuffer);
  gl.enableVertexAttribArray(gl.getAttribLocation(shaderProgram, "aTextureCoord"));
  gl.vertexAttribPointer(textureCoordAttribute, 2, gl.FLOAT, false, 0, 0);

  // Set the index buffer
  gl.bindBuffer(gl.ELEMENT_ARRAY_BUFFER, cubeVerticesIndexBuffer);

  // Draw the elements
  gl.drawElements(gl.TRIANGLES, 36, gl.UNSIGNED_SHORT, 0);

  // Restore the original matrix
  mvPopMatrix();

  // Update the rotation of the cube
  updateRotation();
}
The naive implementation goes through the following steps:
- Sets the values for clearing the screen’s frame buffer
- Clears the screen’s frame buffer
- Enables the depth test
- Binds the shader program
- Sets the uniforms for the matrices
- Sets the texture unit for the sampler
- Binds the texture to the specified unit
- Sets the texture properties
- Binds the vertex buffers
- Sets up each vertex’s attributes
- Binds the index buffer
- Issues a draw call
This results in 25 calls to WebGL. In reality only three of these calls are needed with each frame: the clearing, setting the model-view-projection matrix (MVP matrix) uniform as the cube’s rotation is animating, and the draw call. The rest of the calls can be done once, during initialization. This is because the state of those calls is retained, so making them again with each frame results in redundant operations.
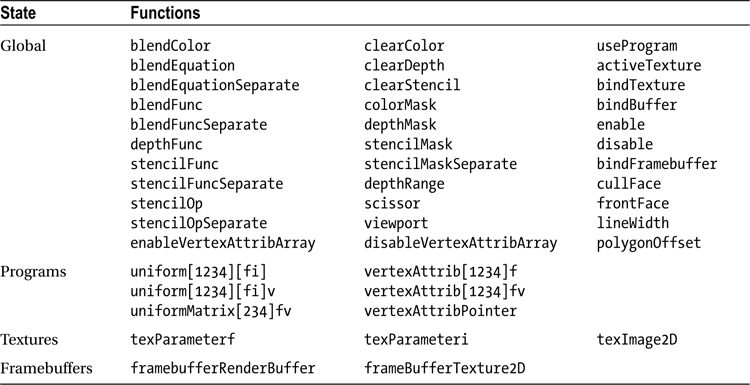
All calls contained in Table 9-1 will modify the state of an object or the rendering context as a whole.
Table 9-1. Functions That Modify State
WebGL also allows the state of itself or its objects to be queried. These calls should be avoided, as they can be very costly, and, at their worst, they can cause the pipeline to stall completely.
The only real exception to this rule, with regard to global state, is during the startup process, as the application can use this time to determine what features are available with the implementation, such as the number of texture units present.
With shader programs it’s perfectly valid to query the uniform information after creation; however, this should only happen once, as the value returned will be unchanged. The information for setting the value later can easily be stored by the application for future use.
During development it’s highly recommended that you check for any errors, using getError after every call. Yet, this should not go into production. The Khronos Group, the consortium that oversees the WebGL specification, provides a debug context for WebGL applications using JavaScript, and doing the same sort of wrapper is trivial in Dart through noSuchMethod invocations.
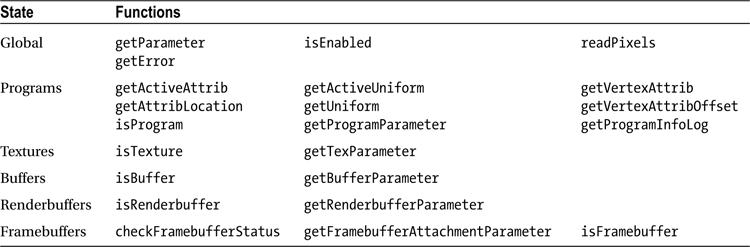
Any calls enumerated in Table 9-2 will query the state of WebGL.
Table 9-2. Functions That Query State
Rather than relying on WebGL to enumerate the current state, the application itself should keep track of its status by mirroring WebGL’s own state machine. By so doing, redundant calls can be prevented.
Building the Renderer
When building a large application, it’s best to partition different subsystems into layers that handle specific functionality. This separates concerns and offers a singular component that can be tested and verified. Building the graphics subsystem involves wrapping the WebGL API into something friendlier to work with higher up within the program. This is also the level at which the API usage can be optimized.
Although the creation of a renderer that binds the whole of WebGL is a topic worthy of an entire tome, a smaller piece of the puzzle can be examined to learn how to go about building the larger whole. How the renderer deals with textures internally can provide that insight.
At a very high level, WebGL allows
- creation and deletion of objects
- manipulation of the underlying objects
- setting of the rendering pipeline
The code in Listing 9-4 begins to sketch out an implementation of this layer.
Listing 9-4. Graphics Library
function GraphicsDevice(gl) {
  this.gl_ = gl;
  this.context_ = new GraphicsContext(gl);
}

GraphicsDevice.prototype.createTexture2D = function() {
  var binding = this.gl_.createTexture(),
      texture = new Texture2D(this);
  texture.setBinding(binding);

  // The texture is not complete, and therefore not usable until
  // after the parameters have been set
  this.context_.initializeTexture(texture);
  return texture;
}

GraphicsDevice.prototype.deleteTexture = function(texture) {
  var binding = texture.getBinding();

  this.gl_.deleteTexture(binding);
  texture.setBinding(null);
}
//------------------------------------------------------------
function GraphicsResource(device) {
  this.device_ = device;
  this.binding_ = null;
}

GraphicsResource.prototype.getBinding = function() {
  return this.binding_;
}

GraphicsResource.prototype.setBinding = function(binding) {
  this.binding_ = binding;
}
//------------------------------------------------------------
Texture2D.prototype = new GraphicsResource();
Texture2D.constructor = Texture2D;

function Texture2D(device) {
  GraphicsResource.call(this, device);
}

Texture2D.prototype.getType = function() {
  // Corresponds to WebGLRenderingContext.TEXTURE_2D
  return 0x0DE1;
}
The layer is built to reflect those concerns. A GraphicsDevice class handles the creation and deletion of resources. Those resources are descended from the GraphicsResource class, which serves as a mechanism for binding the underlying objects WebGL provides. Resources such as textures and buffers would descend from the resource class and communicate an interface that allows the object’s internal state to be modified. The GraphicsContext class handles the state of the pipeline, containing a snapshot of its current condition, which is used to prevent redundant calls from being made.
The OpenGL is a C API, so it doesn’t have the clear separation of concerns that DirectX offers (see Listing 9-5). This means that the GraphicsContext class and GraphicsDevice class are more intertwined than is desirable, as initializing a texture requires calling to the context.
Listing 9-5. Texture Binding
function GraphicsContext(gl) {
  this.gl_ = gl;

  this.activeTexture_ = 0;
  this.boundTextures_ = new Array(8);
}

GraphicsContext.prototype.setTextureAt = function(index, texture) {
  // See if the texture is already bound
  if (this.boundTextures_[index] !== texture) {
    var gl = this.gl_;

    // See if the active texture unit is at the given index
    if (this.activeTexture_ !== index) {
      gl.activeTexture(gl.TEXTURE0 + index);

      this.activeTexture_ = index;
    }

    // Bind the texture
    gl.bindTexture(texture.getType(), texture.getBinding());

    this.boundTextures_[index] = texture;
  }
}

GraphicsContext.prototype.initializeTexture = function(texture) {
  // Bind the texture to the pipeline
  this.setTextureAt(0, texture);

  var gl = this.gl_,
      type = texture.getType();

  // Set the default sampler data
  gl.texParameteri(type, gl.TEXTURE_MAG_FILTER, gl.LINEAR);
  gl.texParameteri(type, gl.TEXTURE_MIN_FILTER, gl.TEXTURE_LINEAR_MIPMAP_NEAREST);
}
The GraphicsContext retains information that is contained within the underlying state machine. WebGL allows multiple textures to be bound to the pipeline at the same time, with each one residing in a separate texture unit. This information can be kept track of by holding an array of textures with the value held corresponding to the specific texture unit. The way to specify that texture unit is to make a call to the API, activeTexture, which specifies the index. This information also has to be retained.
When setting a texture to a given unit, the first thing to check is if that texture is already bound to the given location. This is done first, as the current texture unit only needs to be changed if the texture will actually be replaced. The check of the texture unit is performed when the texture is due to be replaced, because the texture unit may have been modified. During the process, whenever the internal WebGL state is modified, that same modification is applied to the context. This ensures that the underlying states are kept in lockstep with each other.
When building up the renderer further, it’s just a matter of extrapolating the same concepts to encompass other objects: only a single program can be bound to the pipeline at a time, the layout of the vertex buffer can be retained, and a uniform’s value should be changed only when a different input has been provided. All this, and more, needs to be reflected within the rendering context. Once these issues are handled, the interaction with WebGL is optimal at this level.
To verify that the API is being used properly, there are multiple techniques that can be implemented. Those interested in unit testing the graphics layer can do a mock of the WebGLRenderingContext and record the calls being sent. If a call passes through that shouldn’t have occurred, then the test should fail. Which framework to use is really dependent on developer choice, as there are a ton of frameworks available in JavaScript. The Closure Library provides a unit-testing and mocking framework, whereas QUnit is a popular unit-testing framework that can be coupled with Sinon.js for mocks. With Dart the choice is easier; it comes with a robust unit-testing library that also handles mocks. Writing unit tests is outside the scope of this chapter but is a great way to verify that no redundant calls are being made in an automated fashion.
What is more useful during the actual application development is to view the calls being made during a frame, by taking snapshots of what is actually happening. The most robust way to accomplish this is through the WebGL Inspector, a Chrome extension that allows the entire WebGL context to be viewed (see Figure 9-2). When WebGL content is available, a GL icon appears in the address bar, which is used to toggle the extension on and off.
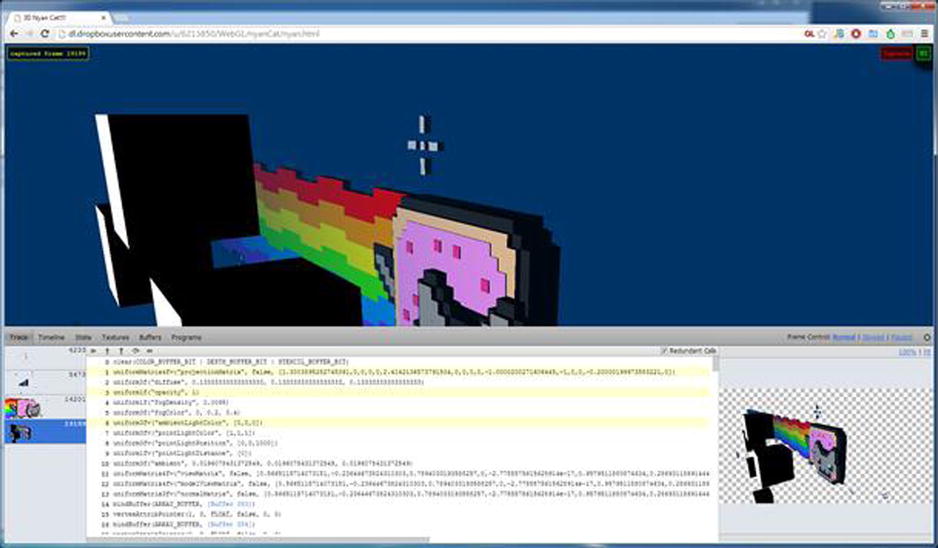
Figure 9-2. The WebGL Inspector
The extension allows the entire state of a single frame to be examined. Each call made to the API is recorded and can be played back in the window, making it simple to see what the rendering looks like step by step. The extension can also show what redundant calls were made to the API, which can be used to diagnose how the renderer is doing. Another feature of the extension is its ability to observe the contents of various buffers within the context. This includes textures, vertex buffers, and index buffers. Shader programs, including the source code that makes up the vertex and fragment stages, can also bestudied. Finally, the state of the API, such as what is enabled or disabled on the pipeline, can be seen within the user interface (UI).
There is another option that just relies on Chrome itself, the Canvas Profiler, which introspects not only WebGL usage, but Canvas 2D Context API usage as well. At the time of writing, the profiler is not as robust as as WebGL Inspector, but it is likely to gain the same sort of functionality as its development continues. To signal that the tool is still under development, it is currently hidden behind the Experiments tab in Chrome DevTools and has to be enabled before it will appear under the Profiles section of the tools. If the Experiments tab is not present within the DevTools settings, then it needs to be enabled through chrome://flags by turning on the Developer Tools Experiments option. Once deemed ready for mass consumption, it should be available without any further configuration within the browser.
Once up and running, the profiler can capture calls to the API. The biggest piece of functionality available in Canvas Profiler that is not present in WebGL Inspector is the ability to capture multiple frames and thus a block of time. In terms of the UI, the profiler groups calls into batches, based on when the actual draw calls occur. This allows the individual geometries being drawn to be tracked in a simple manner.
To see how redundant calls can negatively affect the performance of an application, sample code is included that makes varying degrees of redundant calls. The number of objects being drawn can be modified, and these tools can be used to determine how the application is making use of WebGL. From there on, other three-dimensional content can be examined to see how different applications use the API.
As graphics APIs evolve, they open up additional parts of the pipeline and offer new ways to perform more work with fewer calls. In the OpenGL world this functionality is exposed through extensions. OpenGL extensions allow developers to try new functionality and provide a path for promotion into the core specification. WebGL follows this same model and contains a number of extensions that can reduce the number of calls to the API.
It is important to note that there are no guarantees that an extension will be available, so relying on their presence can erode the number of potential users for the application. Unless the extension is widely supported, a fallback will be required for those users. A site such as WebGL Stats (http://webglstats.com), can give a good indication of what WebGL implementations in the wild have available. On the plus side all the extensions that will be examined here are present in the WebGL 2.0 specification.
Vertex Array Objects
When preparing to draw geometry, the buffers holding the vertex data need to be bound. During this process, the attributes, such as the positions and texture coordinates, must be specified for the vertex shader. Optionally, an index buffer can be specified. All this results in a number of calls to WebGL. With the vertex array object (VAO) extension, these calls can be minimized.
A VAO object keeps the vertex buffers bound and all the attributes specified. It even hangs on to the index buffer in use. The best way to visualize the functionality is to think of a sound recorder. The VAO is bound to the pipeline, the commands are issued, and the results are held in the object. When needed again, the VAO is pressed into service, and the commands are played back. Thus, to render geometry, only a single call is required to set up the vertex and index buffers.
The VAO extension is the easiest extension to support, as its presence is never integral to rendering. If it’s there, the number of calls can be reduced, but if it’s not, the user isn’t missing any graphical goodies.
Draw Buffers
Modern rendering techniques rely on making multiple passes over the same data, with each pass accumulating a different set. An example of this is deferred shading, a screen-space shading technique. In deferred shading the lighting is decoupled from the rendering of a model. The algorithm renders to a geometry buffer (G-buffer), which contains, at minimum, the position, the color information, and normal data for a pixel. If only one render target can be specified at a time, then the scene needs to be rendered once for each target. This involves a lot of overhead. With the draw buffers extension, multiple render targets are supported in WebGL.
WebGL allows the creation of framebuffer objects (FBOs), which can be backed by textures. With the draw buffers extension the framebuffer can be specified with multiple attachments. In the case of deferred shading, there would be a target for position, normal, and color. The fragment shader would then specify an index into gl_FragColor to target the output at the different components. Once the scene is done, these textures are used to create the final image by applying lighting, based on the information within the textures.
Although the draw buffers extension allows amazing effects in the browser, handling a case in which the extension isn’t supported on the device is fairly complex. As mentioned earlier, each geometry will have to be drawn once for each target, and shaders will have to be authored to handle outputting each component. Also, note well that rendering the scene multiple times may not be possible within the allotted time frame.
Instanced Arrays
In a three-dimensional scene it is quite likely that there are multiple objects within the scene sharing the same geometry. Commonly, this involves things such as vegetation, trees, and grass but also extends to characters. However, each of these instances has different parameters to give some amount of uniqueness, for example, different colors. Rather than rendering each mesh one at a time, the hardware allows many geometry instances to be rendered with one call. This functionality is afforded through the instanced arrays extension.
With instanced rendering, per-instance data, such as colors and positions, are transferred through vertex buffers rather than uniforms (see Listing 9-6). First, one or more vertex buffers need to be created to hold the individual instance data. From there on, the extension is used to notify the implementation that the buffer itself holds instanced data and to render the geometries.
Listing 9-6. Instanced Array Setup
// Create the instance data
gl.bindBuffer(gl.ARRAY_BUFFER, colorBuffer);
gl.enableVertexAttribArray(colorLocation);
gl.vertexAttribPointer(colorLocation, 4, gl.FLOAT, false, 16, 0);
ext.vertexAttribDivisorANGLE(colorLocation, 1);

// Draw the instanced meshes
ext.drawElementsInstancedANGLE(gl.TRIANGLES, indexCount, gl.UNSIGNED_SHORT, 0, instanceCount);
To use instancing, the shaders have to be modified, as the values are now coming from a vertex buffer rather than a uniform. This just means that any values that were in uniforms but that are now coming from the instanced vertex buffer have to be modified. The fix is simply to change occurrences of uniform with attribute. Also, if the uniform now being passed in as instance data was only in the fragment shader, it must be moved to the vertex shader and then passed over to the fragment shader as a varying variable, because fragment shaders cannot access vertex attributes.
The instanced arrays extension allows many geometries to be drawn with a single call. But, supporting devices without this extention requires a bit of work as well. Any shaders that act on instanced geometry will require a fallback version. Additionally, the renderer will need to handle setting uniform values directly instead of using a vertex buffer, which could be complicated, depending on the how the renderer is set up. Another word of caution: the number of API calls is based on the number of instances and the number of values per instance and thus could go up drastically. If the scene is bound by the number of draw calls being submitted, the number of instances will have to be slashed when the extension is not available.
There are some optimizations possible besides the promoted extensions for the next iteration of WebGL. At the time of writing, the specification has been released in draft form, so there is a possibility that things could change. WebGL 2 provides a wrapper over OpenGL ECMAScript 3 functionality, which is already available for use, so it’s doubtful that the finalized specification will deviate too far from what has already been proposed. Because at this time no browser vendors have implemented the specification, no example code is given here.
In WebGL 1.x all the information on how a texture is sampled is contained within the texture object itself. In WebGL 2.x this state is replicated within a sampler object. This allows the state of the texture to be easily changed and the same texture to be bound to multiple texture units with different sampling options.
When switching between geometries to draw, the uniform values will need to be updated. This can result in a lot of calls to set uniform data, even though the data may remain constant for the object. Uniform buffer objects offer a new way to set uniform data. Instead of setting a value within the shader program, data are set directly on the uniform buffer. From there on, the data are bound to the shader program, allowing multiple uniform values to be set with a single call.
With the renderer ensuring that no redundant calls are occurring, it’s time to focus on how the scene is being submitted. Even with the underlying optimizations present, the API usage may not be optimal when rendering the scene. For example, imagine that 100 cubes are visible and that each one can be one of three colors. Let’s also assume that there’s a uniform for the diffuse color and another uniform for the MVP matrix. The worst case scenario for the renderer diffuse value is that, modified for each cube, there are 200 uniform calls. This is almost 100 more than the best case scenario, in which the cubes are rendered by color, resulting in 3 calls to set the diffuse color and 100 calls setting the matrix. So, even though the underlying renderer is smart enough to prevent redundant calls, there can still be bottlenecks because of how the renderer is being fed the scene.
When optimizing, it’s important to think about the how the application works and to choose algorithms that fit the specific use. Generalization is usually in opposition to execution speed, so really think about how the scene should be rendered, and adjust accordingly. Additionally, profiling should be added from the start, as there is no way to prove that one algorithm is more effective than another without having any metrics to back that up. Also, remember that some optimizations may have a bigger effect on different hardware, so make sure to profile on a good sampling of devices that may run the program.
With graphics programming there are multitudes of published algorithms available to help speed the rendering. For this reason, it’s impossible to cover them all. However, there are a few optimization techniques that should be present in a software engineer’s toolbox.
Sometimes, the entire scene is not completely within the view of the user. In this case, it’s important to submit only geometry that can affect the final rendering. To determine what is visible, the bounds of the geometry can be compared with the viewing volume, and if the geometry is contained within the extents, it can be passed to the renderer.
The viewing volume (also called the viewing frustum) can be represented as a set of six planes: near, far, left, right, top, and bottom (see Figure 9-3). The bounding volume is then compared against those planes to determine whether it is contained within the frustum.
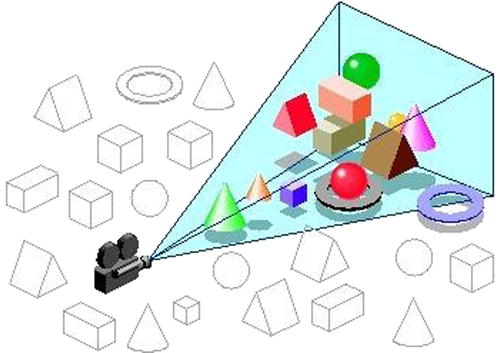
Figure 9-3. Frustum culling
The algorithm depends on the bounding volume used. The tighter the bounding volume, the higher the computational cost. The simplest is the bounding sphere (see Listing 9-7 for a simple implementation), which can easily be compared against the plane but which is highly unlikely to provide a snug fit around the geometry. An axis-aligned bounding box (AABB) is more likely to have a close fit than a sphere, resulting in less geometry’s being inadvertently set to the renderer, but the computation cost is greater. There are other potential bounding volumes—cylinder, capsule, object-oriented (OO) bounding box—but the sphere or AABB are the ones most likely to be encountered when working on the graphics side.
Listing 9-7. Naive Frustum Culling
/// Could be sped up by batching a number of spheres and removing branches.
Frustum.prototype.containsSphere = function(sphere) {
  var plane, dist, radius = sphere.getRadius();

  for (var i = 0; i < 6; ++i) {
    plane = this.planes_[i];

    dist = Vector3.dot(sphere.getCenter(), plane.getNormal()) + plane.getDistance();

    if (dist < -radius)
      return Frustum.Out;
    else if (Math.abs(dist) < radius)
      return Frustum.Intersect;
  }

  return Frustum.In;
}
For a bounding sphere the distance from the center point to the plane is compared, along with the radius of the sphere, to determine which side of the plane the sphere is on. If the sphere is outside any of the six planes making up the bounding volume, its geometry can be discarded from the visible set.
Rendering Order
The order in which geometry is sent to the graphics card can have a direct impact on the performance of the rendering. For example, the hardware will not run the fragment shader upon failure of the depth test. This is an optimization known in OpenGL as the Early Depth Test. For applications with expensive fragment shaders, or multiple passes over the same geometry, this test can have a positive effect on performance.
The OpenGL specification defines a pipeline in which the depth test occurs after the fragment shader is run (see Figure 9-4). However, in certain scenarios it is possible to run the depth test before the fragment shader, which meets this stipulation, as the depth test still functions as if it were being done after the fragment shader. Whether this optimization is available depends on the underlying OpenGL implementation and the fragment shader being used. The optimization is likely to be turned off if the source uses the discard keyword. Also, if the shader uses gl_FragDepth, which isn’t present in WebGL 1.x but which is likely to be present in WebGL 2.x, the technique will not be available.
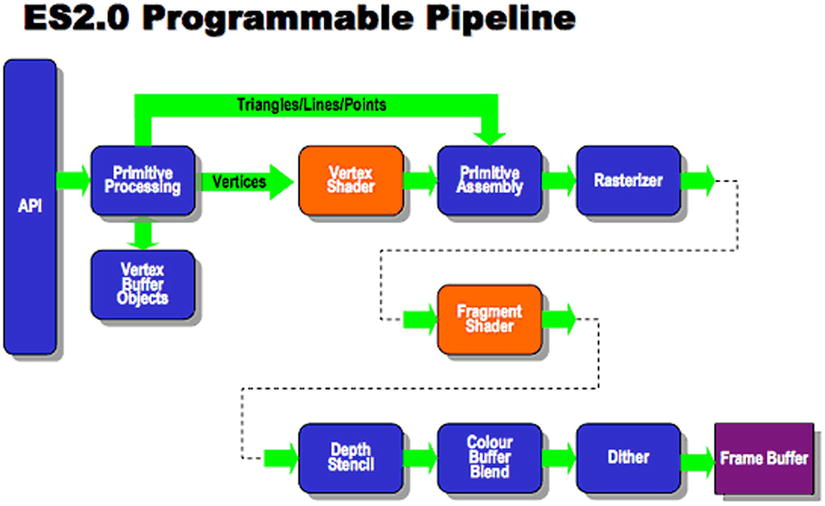
Figure 9-4. OpenGL ES 2.0 pipeline
A way to exploit this functionality is to render all opaque geometry from front to back. This can be done by measuring the distance from the camera to the geometry and sorting, based on the calculation. From there on, the geometry is submitted according to that ordering, which will likely result in use of the Early Depth Test.
Although it’s often useful to think of a geometry as a singular object with its own data, there is nothing preventing multiple geometries from sharing the same underlying vertex buffer; in fact, this can drastically reduce the number of calls to the underlying API. Packing multiple sets of geometry in the same vertex buffer, known as batching, is a common technique for geometry that contains a small number of vertices, such as sprites.
Assume that a scene has 100 of the same sprite being displayed on-screen. To draw the sprites in the best way, such that the vertex buffer is shared between all instances, will necessitate setting a uniform for the transformation and a draw call for each instance, requiring a total of 200 calls. However, if batched together through a shared vertex buffer, all the sprites can be sent to the GPU with a single draw call.
Batching goes hand in hand with another technique, texture sheeting (see Figure 9-5). In a texture sheet (also called a sprite sheet or texture atlas), multiple smaller textures are combined into a single texture. The individual sprites are displayed by setting texture coordinates that correspond to the position of the texture data within the larger sheet. This allows a greater number of sprites to be rendered in a single call.

Figure 9-5. A texture sheet
Batching gets a bit more complicated when the sprites are mobile instead of being statically placed within the world, as with a tile map. In this case, the vertex data need to be updated whenever the sprite’s position changes. This means keeping a separate copy of the position data, as WebGL does not have a way to get back the data held in the buffer. Once all the vertex data have been updated, they must then be applied to the vertex buffer, as shown in Table 9-3.
Table 9-3. Buffer Usage Enumeration
Enumeration |
Behavior |
|---|---|
(i) STREAM_DRAW |
The data store contents will be modified once and used at most a few times. |
(ii) STATIC_DRAW |
The data store contents will be modified once and used many times. |
(iii) DYNAMIC_DRAW |
The data contents will be modified repeatedly and used many times. |
When setting up vertex buffers, it’s important to think about how they are going to be used. In this case, the position data are likely to change often, whereas the texture coordinates are going to be constant. For this reason, it’s best to place them in two separate buffers. When populating the data, there are enumerations, which tell the underlying driver how the data are going to be used. This functions as a hint to the underlying implementation on how it should store the data internally. The position buffer should be passed the DYNAMIC_DRAW enumeration, whereas the texture coordinate buffer receives the STATIC_DRAW usage. This lets the underlying implementation optimize accordingly.
Conclusion
Effectively using WebGL is integral for three-dimensional applications on the Web. Spending more time than is required within the API results in less time for the rest of the application to do its work. Hitting a smooth 60 frames per second, or at the very least30, is integral to the user experience and is a goal that needs to be met.
By ensuring that the application is not making unwarranted calls to the API, the battle is largely won. The application should leverage any extensions available to further reduce the number of calls. And, finally, the renderer should be fed in a way that is efficient for dealing with the scene being displayed. With all that in place, the rendering path is optimized, maximizing the amount of frame time available for the rest of the application.