As you have seen in the preceding chapters, VMware provides a number of tools and features to manage your ESXi environment. As your environment grows, you will likely find that you need to integrate your vSphere deployment with the other systems that exist on your network. This chapter examines a number of features and tools that help integrate ESXi and vCenter Server with the rest of your network.
This chapter examines the following items:
Using Active Directory Integration to eliminate the need for using local accounts when managing an ESXi host directly
Synchronizing the time on your hosts with Network Time Protocol (NTP)
Configuring ESXi to forward log data to a centralized syslog servers
Monitoring your host with vCenter alarms, performance charts, and storage views
Managing the hardware health for your ESXi hosts
Integrating your hosts with systems management software
Backing up ESXi configurations and virtual machine data
Past versions of ESX have included the ability to integrate authentication with Active Directory (AD), but the setup could be difficult and required access to the service console. With vSphere 4.1, AD integration is now configurable within the vSphere client and support now extends to ESXi. It is also possible to configure AD integration with the vCLI or Host Profiles. In the same manner as with vCenter Server, it is possible to assign AD users to either the predefined or custom roles on an ESXi host to grant those users specific permissions that they may require to manage the host. ESXi AD integration can also eliminate the need to share the root login to the host and instead vSphere administrators can rely on their AD credentials for running vCLI scripts or for accessing local and remote Secure Shell (SSH) technical support.
A number of prerequisites need to be met to ensure that the ESXi host is able to join the AD domain:
Ensure that the account that will be used to join the ESXi host to the domain has the required privileges to join a computer to the domain.
Ensure that the ESXi host is using the same time source as the AD controllers. The NTP configuration settings for the host can be set in the vSphere client on the Configuration Time Configuration screen or with the command
esxcfg-ntpfrom the vCLI.Configure the ESXi host to use the AD domain’s domain name service (DNS) server(s) and to have the same DNS suffix. DNS settings can be configured in the vSphere client on the Configuration DNS and Routing screen. With the vCLI, the
esxcfg-dnscommand can be used to set both the DNS suffix for the host and the DNS server(s) that will be used by the host.
Caution
When an ESXi host is joining a domain, if the group ESX Admins exists within AD, that group is granted the built-in Administrator role to the host. This is shown in Figure 6.1.

After the prerequisites are in place, the ESXi host can be joined to the AD domain using the Configuration > Authentication Services screen:
On the Authentication Services screen, click Properties.
For the User Directory Service option, change the type from Local Directory (default) to Active Directory.
Enter the AD domain to join and click Join Domain. The Join Domain screen then appears, as shown in Figure 6.2. After the appropriate AD credentials are entered and you click Join Domain, the task pane displays the Join Windows Domain task.
After the task has completed, click OK to close the configuration screen.
If the task has completed successfully, the Authentication Services screen should display Active Directory as the Directory Services Type. The Domain Setting section will show the AD domain that was joined and should the domain trust other domains, those will be listed in the Trusted Domain Controllers section. A computer account will have also been created in the default Organizational Unit for computer objects. Should the ESXi fail to join the domain, an error will be displayed and further troubleshooting information may be logged to the system log (/var/log /messages).
You may encounter the error The specified domain either does not exist or could not be contacted. Within /var/log/messages, you would also see the following error. If this is your case, you should check the NTP setup for the host and also ensure that previously specified DNS requirements have been met.
Mar 22 04:08:21 Hostd: [2010-03-22 04:08:21.343 49D81B90 error 'ActiveDirectory
Authentication' opID=D697C122-00000091] vmwauth NoSuchDomainException: Exception
0x0000054b: The specified domain either does not exist or could not be contacted.
If you need to remove a host from a domain, you can use the Configuration > Authentication Services screen. Once you have completed the following process, the Authentication Services screen should display a Directory Services Type of Local Authentication.
On the Authentication Services screen, click on the Properties link.
The Directory Services Configuration screen appears. Click Leave Domain.
You will be prompted with the Leave Domain Warning screen. This screen informs you that leaving the domain will remove all domain-related permissions that have been configured for this host. Click OK to continue.
The Leave Windows Domain task begins and is shown in the Recent Tasks view. Click OK to close the Directory Services Configuration screen.
The second option to configure AD Integration is with Host Profiles. Chapter 3, “Management Tools,” reviewed the process of creating and applying a host profile. You can configure one of your hosts and then create a host profile with the process provided to apply that change to your other hosts. If the host being used for the Host Profile has already been joined to the domain, you can refresh the Host Profile to import the AD Integration settings configured on the host. With the vSphere client connected to vCenter Server, go to the Home view and then select Host Profiles. Right-click on the Host Profile you want to update, and select Update Profile from Reference Host. Once the Update Host Profile task has completed, you can edit the profile to review the changes. The username and password used to join the domain will not be stored in the Host Profile. The following process configures an existing profile to join your ESXi hosts to your domain:
Start the vSphere client and connect to vCenter Server.
Select the Home view and then click the Host Profiles icon.
Choose the profile to update and click Edit Profile.
Browse to the Active Directory Configuration node to configure the options shown in Figure 6.3.
For the User Name and Password options, the only available choice with this release is to be prompted during the application of the profile for appropriate user credentials. For the Domain Name option, select the option Configure a Fixed Domain Name and specify the domain that your ESXi host will join.
Select the Compliance Details tab for the Domain Name policy and ensure that the option Validate That the Host Is Not Joined in Any Domain is checked. This ensures that the policy will not attempt to join the ESXi host to the domain repeatedly.
Click OK to save your changes and close the Edit Profile window.
Once you have updated or created a profile that includes the Active Directory Configuration policy, you are ready to apply the profile to a cluster or host. The process for applying a profile to a cluster was discussed in Chapter 3. The following process applies the policy to an individual host.
To apply the profile to a host, first select the Inventory > Hosts and Clusters view.
Right-click on the ESXi host and select Host Profile > Manage Profile. If no profile has been set for this host, you can select the profile that was updated earlier in this process. Otherwise, you can click Change to switch the profile used or Cancel if the correct profile is being used.
Right-click on the host and select Host Profile > Check Compliance. Once the Check Compliance task has completed, the Summary tab displays a message if the host is not compliant.
Before the policy can be applied, the host must be in maintenance mode. Right-click on the host and select Enter Maintenance Mode.
To apply the policy, right-click on the host and select Host Profile > Apply Policy.
In the Apply Profile wizard, you will be prompted to enter a User Name and Password that will be used to join the host to the domain. After you enter the appropriate credentials, click Join Domain.
The Apply Profile wizard displays a summary of changes to be made to the host. A task to join the host to your domain should be listed. Click Finish to apply the changes listed.
The third option for configuring your host for AD Integration is the vicfg-authconfig command from the vCLI. With this command, you can add your host to a domain, check the current setup, or remove the host from a domain. The following section demonstrates the basic usage for the command.
The --getremoteauthstore | -a option is used to query the ESXi host for the current authentication mechanism. The following example shows a host that has not been configured for AD Integration. A configured host would show Active Directory as the configured mechanism.
vicfg-authconfig.pl --server esx05 --getremoteauthstore
Currently active authentication schemes:
= = = = = = = = = = = = = = = = = = = = = = = = = = = = = = = = = = = = = = = = = = =
Local Authentication
The --joindomain | -j <domain_FQDN> option is used to join a host to your domain. The --authscheme option is required with the AD argument. You can also specify the --adusername and --adpassword options, but if you do not, you are prompted for credentials to join a server to the domain as follows:
vicfg-authconfig.pl --server esx05 --joindomain mishchenko.net --authscheme AD Enter
AD username: dave.mishchenko
Enter AD password:
Successfully joined mishchenko.net
The --currentdomain option can be used to query the currently joined domain. You must include the --authscheme option.
vicfg-authconfig.pl --server esx05 --currentdomain --authscheme AD
Current Domain: MISHCHENKO.NET
Lastly, if you want to remove your host from the domain, you use the --leavecurrentdomain | -L option. You must also specify the --authscheme option. If you have assigned permissions to AD users and run this command, you get the error shown in the first example that follows. To overcome this situation, use the --force option to delete all AD-assigned permissions and remove the host from the domain.
vicfg-authconfig.pl --server esx05 --leavecurrentdomain --authscheme AD
Could not part with the current domain: The operation is not allowed in the current state.

vicfg-authconfig.pl --server esx05 --leavecurrentdomain --authscheme AD --force
Successfully parted with the current domain.
Once you have joined your ESXi host to your domain, you’ll be ready to assign permissions to AD users and groups. Permissions and roles are discussed further in Chapter 7, “Securing ESXi,” but for now you will see how to briefly assign a role to your AD user or group. If you plan to assign permissions manually with the vSphere client, you must connect directly to the ESXi host. If the vSphere client is connected to vCenter Server, the permissions will be granted in vCenter but not specifically on the host for direct client connections. You may also use Host Profiles to assign permissions at the host level.
To assign permissions with the vSphere client, you will follow this process:
Start the vSphere client and log in directly to the VMware ESXi host.
Select the Permissions tab for the object to which you want to add a new role for an AD user or group.
Right-click on a blank space on the Permissions tab and select Add Permission or select File > New > Add Permission.
Click the Add icon on the Assign Permissions screen to access the Select Users and Groups window as shown in Figure 6.4.
Select the domain to use as the source for the user and group listing. You can choose among (Server), which refers to the security entities defined locally on ESXi, the domain to which you joined your ESXi host, or any trusted domains.
Select the user of group to which you want to assign a role on the ESXi host, and then click OK.
Choose a role to grant to the user or group account and click OK on the Assign Permissions screen to complete your change.

Tip
If you manually enter a user or group and then use the Check Names button on the Select Users and Groups screen, a case-sensitive search is performed. Searching for MISHCHENKODomain Users will result in success, whereas searching for mishchenko domain users will not.
You can also assign roles to AD users and groups at the host level with Host Profiles. If the host being used for the Host Profile has already been configured, you can refresh the Host Profile to import the settings configured on the host. With the vSphere client connected to vCenter Server, go to the Home view and then select Host Profiles. Right-click on the Host Profile you want to update, and select Update Profile from Reference Host. Once the Update Host Profile task has completed, you can edit the profile to review the changes. Use the following process to accomplish that:
Start the vSphere client and connect to vCenter Server.
Select the Home view and then click on the Host Profiles icon.
Choose the profile to update, and then click Edit Profile.
Open the Security Configuration policy, right-click on Permission Rules, and select Add Profile.
Select the new policy and then click on the Edit link to configure a new permission.
Change the policy to use the Require a Permission Rule option.
Enter the User or Group Name and check the Name Refers to a Group of Users option if applicable, as shown in Figure 6.5.
Enter the Role Name to be assigned to the AD user or group. This will be a local role on the ESXi host and can be either one of the built-in roles or a role that you have created. If you are using one of the three built-in roles of Administrator, Read-Only, or No Access, you should enter the role as Admin, ReadOnly, or NoAccess.
If applicable, check the Propogate Permission option.
Click OK to save the profile. You are now ready to apply the profile as has been previously shown.
Time synchronization will play an important role on your hosts. As noted earlier, the time on your ESXi hosts must be in sync with your domain controllers for AD Integration to function properly. Accurate time keeping for the host will also ensure that log files accurately reflect the real time when troubleshooting any problem events. For virtual machines, you may configure the guest operating systems to use the Windows Time Service or NTP to manage time, but certain events for the virtual machine will still depend on the time kept on your VMware ESXi host. These events include starting up VMware Tools, taking a snapshot, resuming from a snapshot or suspension, and using vMotion of the virtual machine. In these cases, the guest operating system is synced with the host’s clock even if VMware Tools periodic time sync is disabled. Thus it is critical to ensure that the host’s clock is kept in sync with a reliable time source.
To read more about timekeeping in virtual machines, you can consult the following resources.
Timekeeping for Linux guests: http://kb.vmware.com/kb/1006427
Timekeeping for Windows guests: http://kb.vmware.com/kb/1318
Timekeeping in VMware Virtual Machines: http://www.vmware.com/resources/techresources/238
You can configure the NTP client settings for your host on the Configuration > Time Configuration screen. This screen displays the current time, the status of the NTP client, and currently configured NTP servers, as shown in Figure 6.6. Note that the host will be running in the Coordinated Universal Time (UTC) time zone and that the time displayed is translated to match the time zone on the workstation running the vSphere client.
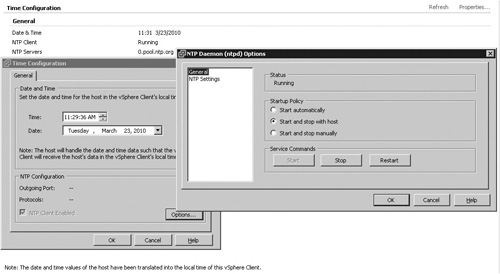
Click on the Properties link to edit the time and date on the Time Configuration screen. You should avoid manually changing the time if possible, as it is ideal to allow the NTP client on ESXi to synchronize your host’s time. You can click Options to configure the NTP client. The NTP Daemon (ntpd) Options screen consists of the following configuration options: General and NTP Settings. The General tab, which is shown in Figure 6.6, displays the current service status as well as the Startup Policy for the service. The policy should be set to either Start Automatically or Start and Stop with Host. Lastly, on the General tab, you can control the service with the Start, Stop, and Restart buttons.
Tip
If you need to restart the NTP service, you can also do this on the Configuration > Security Profile screen. When you click Options for the NTP Daemon, you will be presented with the same NTP Daemon screen as described previously. If you are at the console of your ESXi host, you can use the Restart Management Agents to restart the NTP service along with other system services.
On the NTP Settings tab, you can configure the NTP servers that the ESXi host will use. You can use the Add, Edit, or Remove buttons to manage the list of servers that you want to use. The NTP servers can be entered as a hostname, an Internet Protocol (IP) address, or an IPv6 address. If you make changes to the server list, you can check the Restart NTP Service to Apply Changes option to restart the NTP service on ESXi when you click OK to save your changes.
If you have updated your reference host with your required NTP configuration using the vSphere client, you are ready to update your Host Profile. With the vSphere client connected to vCenter Server, go to the Home view and then select Host Profiles. Right-click on the Host Profile you want to update and select Update Profile from Reference Host. Once the Update Host Profile task has completed, you can edit the profile to review the changes.
You can also manually edit the profile to configure NTP settings by following these steps:
Start the vSphere client and connect to vCenter Server.
Select the Home view and then click on the Host Profiles icon.
Choose the profile to update and click Edit Profile.
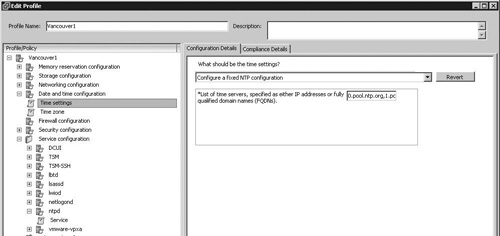
Open the Date and Time Configuration policy and select Time Settings. You will note that there is a Time Zone policy but you cannot apply this policy to ESXi hosts.
For the Time Settings policy, change the setting to Configure a Fixed NTP Configuration. Enter a list of NTP servers by hostname or IP address. Separate multiple hosts with a comma, as shown in Figure 6.7. If you have configured your host to use IPv6, you can enter an IPv6 address.
Open Service Configuration > Ntpd and select the service policy. Choose the Establish a Fixed Service Configuration and set the service policy to
automaticoron.Click OK to save and close the policy. Then use the procedures described earlier to apply the policy to your hosts.
The vCLI contains the command vicfg-ntp, which you use to manage the configured NTP servers for a host as well as to stop and start the NTP service. While the command is adequate for running on a single host as part of a configuration script, if you want to update a number of hosts, the advantages of PowerCLI become evident. PowerCLI includes the cmdlets Add-VMHostNtpServer, Get-VMHostNtpServer, and Remove-VMHostNtpServer to configure the NTP settings for your host. You will also use Get-VMHostService and Restart-VMHostService to restart the NTP server after making your changes.
If you run Get-VMHostNtpServer against a single host, the command simply returns the list of configured NTP servers just as the vicfg-ntp command would do:
get-vmhostntpserver
0.pool.ntp.org
If you utilize Get_VMHost, you can obtain a list of all your ESXi hosts in vCenter Server. That output can then be used to query for the NTP server for each host as well as to check the status of the NTP service on each host:
Get-VMHost |Sort Name|Select Name, @{N="NTP Server(s)";E={$_
  |Get-VMHostNtpServer}}, @{N="Service Status";E={(Get-VmHostService
  -VMHost $_ |Where-Object {$_.key-eq "ntpd"}).Running}}
Name                   NTP Server(s)                Service Status
____                   ____________                 _____________
esx01.mishchenko.net   0.pool.ntp.org               True
esx02.mishchenko.net   {0.pool.ntp.org, 1.pool... False
esx05.mishchenko.net   0.pool.ntp.org               True
The following script generates a list of ESXi hosts connected to vCenter Server. For each host, the script creates a list of currently configured NTP server and then removes those items. It then adds a new NTP server to the host and restarts the NTP service so that your ESXi hosts can begin to use the new NTP server.
$Hosts = Get-VMHost
ForEach ($Hostname in $Hosts)
{
$Current_NTP = Get-VMHostNtpServer -VMHost $Hostname
    ForEach ($NtpServer in $Current_NTP)
    {
    Remove-VMHostNtpServer -NtpServer $NtpServer -VMHost $Hostname
    }
Add-VmHostNtpServer -NtpServer "2.pool.ntp.org" -VMHost $Hostname | Out-Null
Get-VmHostService -VMHost $Hostname | Where-Object {$_.key -eq "ntpd"} |
   Restart-VMHostService -Confirm:$false | Out-Null
write "NTP Server was changed on $Hostname"
}

Remove NtpServer '0.pool.ntp.org' from VM host 'esx01.mishchenko.net'?
[Y] Yes [A] Yes to All [N] No [L] No to All [S] Suspend [?] Help
(default is "Y"):
NTP Server was changed on esx01.mishchenko.net
Remove NtpServer '0.pool.ntp.org' from VM host 'esx02.mishchenko.net'?
[Y] Yes [A] Yes to All [N] No [L] No to All [S] Suspend [?] Help
(default is "Y"):
NTP Server was changed on esx02.mishchenko.net
Tip
As you begin to create complex PowerCLI scripts, you will have to start spending time on troubleshooting and coding for error conditions in your scripts. The preceding script assumes that each host has at least one NTP server configured and that the NTP service is running. For a host that does not have the service running, an error is generated as shown in the following script, but the script continues to run. Since the script is executed against vCenter Server, you can track the progress in the Recent Tasks pane or on the Tasks & Events tab for each host. In the case of this script, two Update Configuration tasks are created for each host followed by a Restart Service task for each host as well.
Restart-VMHostService : 3/23/2010 9:18:24 PM    Restart-VMHostService
   06BB6C44-57D2-400C-825B-46F84BB0487E    The operation is not allowed in
   the current state.
The syslog protocol was developed in the 1980s as a method to separate the application that was generating log data from the system that would store the logging data. Syslog has been the standard logging solution for Unix and Linux systems for some time and is generally used to send system management and security auditing data to a central syslog receiver. Syslog messages can be sent via User Datagram Protocol (UDP) or Transmission Control Protocol (TCP) and uses a default port of 514.
As the ramdisk file system does not persist when the host is restarted, the log files for ESXi do not survive a reboot. Enabling the syslog service on ESXi enables you to forward all log information to a central server. VMware ESXi will use UDP to transmit data to the syslog receiver.
Configuration of the syslog settings on ESXi is done on the Configuration > Advanced Settings (Hardware) screen. The following options are available for configuration (see Figure 6.8):
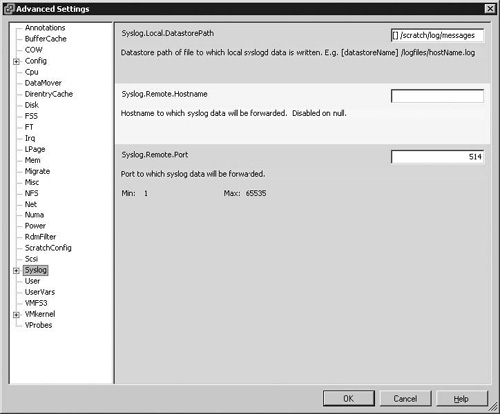
Syslog.Local.DatastorePath. This is a local path to which the syslog files will be written. This can be a location within the ramdisk or a datastore location.
Syslog.Remote.Hostname. This is the remote host to which syslog data will be forwarded. If this setting is left empty, remote syslog forwarding will be disabled.
Syslog.Remote.Port. This is the destination port to which syslog data will be forwarded.
Note
The default setting for Syslog.Local.DatastorePath has changed with VMware ESXi 4.1. With ESXi 4.0 and earlier versions, the setting was not defined and thus the syslog service would use the default location of /var/log/messages. Files in this location were not preserved over a restart of the host. With ESXi 4.1, the default location is now /scratch/log/messages. With that new setting, syslog files will survive a reboot, but you need to access the Tech Support Console to gain access to the files.
You can use the following process to configure syslog for an ESXi host. The vSphere client can be connected directly to the host or to vCenter Server.
Select the host in the vSphere client inventory.
Select the Configuration tab and then click on Advanced Settings (Hardware).
Select Syslog in the tree control as shown in Figure 6.8.
Enter a valid datastore for Syslog.Local.Datastore. The path format is
[<datastore-name>] </path/file>, but you can also enter/vmfs/volumes/<datastorename>/ <path>/<file>and the path will be stored in the preferred format.In the Syslog.Remote.Hostname box, you can enter the hostname or IP address for the server to which syslog data will be forwarded. If no value is entered, forwarding is disabled.
In the Syslog.Remote.Port box, enter the port on which the syslog receiver will be listening. The default value is port 514. This setting is ignored if Syslog.Remote.Hostname is not configured.
Click OK to close the Advanced Settings window.
Any changes you make immediately take effect. There is no need to restart the host or any services after configuring syslog settings.
Note
If you have configured syslog with ESX, you’ll have become familiar with the process of editing /etc/syslog.conf, opening the Service Console firewall to allow syslog traffic, and restarting the management services to complete the configuration. With ESXi, you can use the vSphere client, vicfg-syslog from the vCLI, or PowerCLI commands to configure your hosts. You should also note that with ESXi you can configure only a single syslog receiver. If you need to send data to multiple syslog hosts, you’ll need to send the host’s syslog data to a host that is configured to forward the data to other syslog receivers. Lastly, with ESXi, you cannot configure the level of errors that are forwarded. All events in the system logs will be forwarded; this is unlike ESX, which you can configure, for example, to send log items at a level of critical or higher to the syslog receiver.
PowerCLI includes two cmdlets that may be used to query and set syslog receiver on your ESXi hosts. These are get-VMHostSysLogServer and set-VMHostSysLogServer. As with vicfg-syslog from the vCLI, these cmdlets can be used to set and query the remote syslog server settings on a host as shown in the following listing. When setting the syslog server, you can specify either the IP address, hostname, or IPv6 address.
get-VMHostSysLogServer -VMHost esx02
Host                         Port
____                         ____
vcenter41                    514

Set-VMHostSysLogServer -SysLogServerPort 514 -SysLogServer 192.168.1.52
Host                         Port
____                         ____
192.168.1.52                 514
If you need to check or update a number of hosts, you can use the following simple script. For configured hosts, a syslog server and port are displayed. Unconfigured hosts will not show a syslog server or port.
Get-VMHost |Sort Name|Select Name, @{N="Syslog Server";E={$_ |
   Get-VMHostSyslogServer}}
Name                         Syslog Server
____                         _____________
esx01.mishchenko.net         192.168.1.52:514
esx02.mishchenko.net         192.168.1.52:514
esx05.mishchenko.net
The following script updates all hosts connected to your vCenter Server host with the specified syslog server IP address and port number:
$Hosts = Get-VMHost
ForEach ($Hostname in $Hosts)
{
Set-VMHostSysLogServer -SysLogServerPort 514 -SysLogServer 192.168.1.52
   -VMHost $Hostname
write "Syslog Server was changed on $Hostname"
}
Host                         Port
____                         ____
192.168.1.52                 514
Syslog Server was changed on esx05.mishchenko.net
192.168.1.52                 514
Syslog Server was changed on esx01.mishchenko.net
192.168.1.52                 514
Syslog Server was changed on esx02.mishchenko.net
Now that you know how to configure your hosts to forward log data to a syslog server, it is worthwhile to see what it will be like to manage that data. Use of a syslog server provides an easy way to create a central repository of your log data. This repository of data is beneficial to provide an untouched set of logs for review should you experience an intrusion or other problem that requires careful examination of log data. As mentioned earlier, ESXi stores log files in a ramdisk for a limited period so that log files will not be permanently available.
The following sample uses Splunk, which is available from www.splunk.com. After the product is installed, the first step is to set up Splunk to receive syslog data. The following setup was done with Splunk 4.1 running on Windows 2008. If you have a firewall enabled on your syslog receiver, ensure that it is configured to allow inbound syslog data.
You can use the following process to enable Splunk to receive syslog data:
Log in to the Splunk administration Web site. The login after a new installation is
adminand the password ischangeme.Click the Add Data link to create a new Data Input.
On the Data Inputs page, click the Add New link for the data type of UDP.
On the Add New page, enter a UDP port of 514. You may also change the Host setting to DNS to have Splunk log data with the DNS hostname for your ESXi hosts instead of their IP addresses.
Click Save on the Add New page to save your new syslog data input.
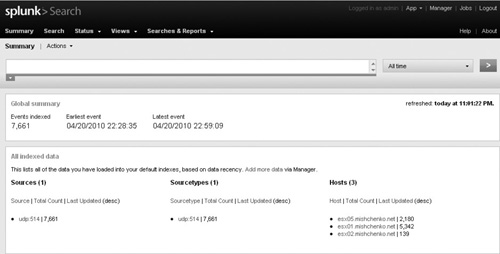
If you have previously configured your ESXi hosts to forward syslog data, Splunk immediately begins to collect that data. As the syslog data is an exact duplicate of the log data that ESXi is generating internally, the number of events sent to your Splunk server can be significant. To view the raw data, return to the home page for your Splunk server and select the Search link. The Search page displays the links for all the syslog data that has been captured and links to access syslog data for specific hosts, as shown in Figure 6.9.
If you select to view syslog data for a specific host, Splunk provides that data as shown in Figure 6.10. Note that each event contains two time stamps. The first reflects the time that the Splunk server received the data and the second is the time that the event was generated on the ESXi host. The seven-hour difference is caused by the ESXi host running in the UTC time zone. You can change the settings for Splunk to have the second time stamp match the time zone in which your ESXi hosts are located, using the procedure outlined at this link: http://www.splunk.com/wiki/Community:VMwareESXSyslog.

The default Search view for a specific host displays all data collected for the data. If you want to view data only for a specific period, select the All Time drop-down menu as shown in Figure 6.10 and select a more appropriate time period. The time ranges shown are based on the time zone for the Splunk host, so you may need to adjust your time period to reflect the correct time period that you want to examine for your host. If you want to use the data in another application, select the Actions drop-down menu and choose Export Results. You can export to a number of formats, including Comma Separated Values and Raw Events.
You may also find it valuable to configure your syslog server to alert you based on certain events that are found. For example, you could use your syslog receiver to alert you to a certain event that is being logged but not generating alerts in your other monitoring tools. The following example configures Splunk to send an alert should a syslog entry contain the text “failed on physical path”:
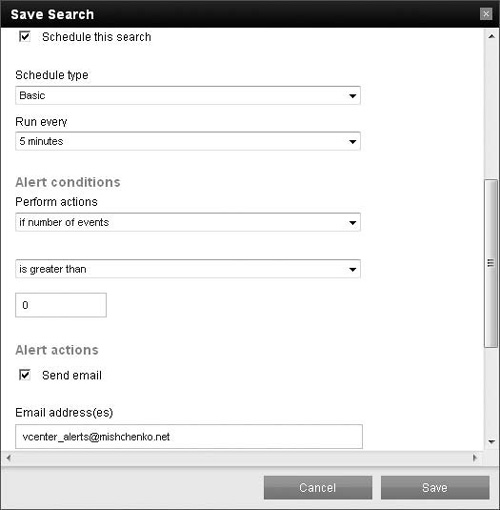
On the Search screen, create a search that will find the events for which you want to receive an alert. For this example, the search is
sourcetype="udp:514" startminutesago::5 "failed on physical path", which will include syslog data coming from all ESXi hosts. Thestartminutesago::5option limits the search to the last five minutes of syslog data.Select the Action drop-down menu, as shown in Figure 6.10, and choose Save Search.
On the Save Search dialog box, specify a Name and optionally a Description.
Check the Schedule This Search option and then enter an appropriate frequency in the Run Every drop-down menu, as shown in Figure 6.11.
Change the Alert Conditions to generate an alert if the number of events is greater than zero.
Choose your desired alert Action. Splunk is able to send an e-mail, create an RSS feed, or run a shell script. In this example, the e-mail option is chosen, but you could use the script option to run a PowerCLI or vCLI script.
Click Save to close the dialog box.
To receive e-mail alerts, you must specify a mail host to be used to relay e-mail. You can set this in Manager > System settings > Email alert settings. With the option to run a shell script, you could even create a script that could generate an alert within another monitoring system. Splunk can also be configured to forward data to other syslog receivers, which can overcome the limit on ESXi of being able to set only a single syslog server.
Simple Network Management Procotol (SNMP) is a UDP-based protocol developed in the 1980s to manage network devices. An SNMP deployment consists of the managed devices, the SNMP agents running on the devices, and a network management server that receives and retrieves data from the agents. The SNMP agents running on the devices expose data such as the host hardware model, memory use, and network configuration. The management system is able to acquire this data with one of the following methods. The management system can use an SNMP GET operation, in which it sends a specific request for data to the SNMP agent. The SNMP agent can also send a trap to the management server to notify it of a certain condition or event. SNMP typically uses UDP port 161 for the agent and port 162 for the management server. The configuration of SNMP also uses the concept of communities. Communities are used to group devices and management stations. A device running an SNMP agent can belong to multiple communities.
If you plan to integrate vCenter Server and VMware ESXi into your SNMP deployment, it is important to understand that both products support only SNMP traps. The vCenter and ESXi SNMP agents do not support other SNMP operations such as GET.
To configure SNMP to monitor your vSphere datacenter, you need to enable SNMP on your ESXi hosts and vCenter Server. To configure SNMP on vCenter Server, use the following process:
Start the vSphere client and connect to vCenter Server.
Select Administration > vCenter Server Settings.
Click SNMP on the navigation list.
Change the Receiver uniform resource locator (URL) for the Primary Receiver from localhost to the hostname or IP address for your SNMP management server.
If required, you can also change the Port and Community String for the Primary Receiver.
Click OK to save your changes.
On the vCenter Server Settings dialog box, notice that you can enable up to four SNMP receivers. These could be different management servers or different communities on the same server.
To configure VMware ESXi to enable SNMP, you use the vCLI command vicfg-snmp. The command has the options found in Table 6.1.
Table 6.1. Options for the vCLI Command vicfg-snmp
Option | Description |
|---|---|
| Specifies the SNMP communities to which the host will belong. When you use this option, any prior settings are overwritten. |
| Stops the SNMP service on your host. |
| Starts the SNMP service on your host. |
| Sets the port to be used by the SNMP agent. The default is UDP 161. |
| Clears the currently configured communities and targets on the host. |
| Displays the current SNMP configuration. |
| Sets the destination for SNMP traps. For vSphere 4.0 and later versions, you can use IPv6. |
| Sends a test notification to the configured target or targets. |
The following process can be used to configure your ESXi host for SNMP. The --show option can be used to display the current configuration on the host. By default, there is no configuration for targets and communities and the value of 0 for the Enabled parameter indicates that the agent is not running.
vicfg-snmp --server esx01 --show

Current SNMP agent settings:
Enabled : 0
UDP port : 161
Communities :
Notification targets :
Before you can enable the SNMP agent on ESXi, you must configure at least one community. Your host can be a member of multiple communities, but it will be able to share SNMP data only with management servers that belong to the same community group. The following command sets the communities for the host to public and vsphere. If you set multiple communities, you have to set them with one command. Running the vicfg-snmp command again to set a second community overwrites the previous community configuration.
vicfg-snmp --server esx01 --communities public,vsphere
Changing community list to: public,vsphere. . .
Complete.
The next step to set up your host for SNMP is to specify your SNMP management server. The --target option is used to specify the target (SNMP receiver) address, community, and optionally the UDP port to use. The following command sets two target servers:
vicfg-snmp.pl --server esx01 -targets
    192.168.1.52@162/public,192.168.1.53@162/vsphere

Changing notification(trap) targets list to:
    192.168.1.52@162/public,192.168.1.53@162/vsphere. . .
Complete.
Once you have configured the appropriate community and target, you can use the --enable option to start the SNMP agent on your host, as shown in the following command:
vicfg-snmp --server esx01 --enable

Enabling agent. . .
Complete.
If you want to review the configuration of your host, you can use the --show option:
vicfg-snmp --server esx01 --show
Current SNMP agent settings:
Enabled : 1
UDP port : 161
Communities :
public
vsphere
Notification targets :
192.168.1.53@162/vsphere
192.168.1.52@162/public
If you are having any problems with your SNMP configuration, you can run vicfg-snmp with the --test option to send an SNMP trap to your configured management servers:
vicfg-snmp --server esx01 --test

Sending test nofication(trap) to all configured targets. . .
Complete. Check with each target to see if trap was received.
After you have configured your ESXi hosts and vCenter Server to send SNMP traps to your SNMP management server, you must configure the management server to accept those traps and to have the necessary information to interpret the traps. Interpretation of the SNMP trap data is handled by Management Information Base (MIB) files. The VMware MIB files define the structure of the management data sent by the monitored device using a hierarchical namespace containing object identifiers (OIDs). Each OID identifies a variable that can be set or read with SNMP.
Caution
Both vCenter Server and VMware ESXi use SNMP version 1 to send trap data. The SNMP agent sends the community strings as clear text data, and anyone with a packet sniffer can capture and view this data. Further, as the data is sent via UDP, it is possible to spoof the IP address of one of your hosts to send fraudulent or corrupted data to your SNMP management server. If you use SNMP to monitor your ESXi host and vCenter Server, it is best to ensure that the SNMP traffic remains on a secured management network.
To configure your host to accept SNMP traps from your ESXi hosts and vCenter Server, use the following process:
Access your SNMP management software and ensure that your ESXi hosts and vCenter Server are listed as SNMP managed devices.
Add the same community names to your SNMP software as you used to configure your ESXi hosts and vCenter Server.
If you have configured your hosts to send SNMP traps to a port other than UDP 162, update your management software to use the same port.
Download the latest VMware MIB files from http://communities.vmware.com/community/developer/managementapi.
Load the VMware MIB files into your management software to ensure that the management software is able to display the appropriate names for the variables that will be sent in the SNMP traps.
Table 6.2 provides a list of VMware MIB files that are available for use with VMware ESXi and vCenter Server along with a description of the information that each file provides.
Table 6.2. VMware MIB Files
MIB File | Description |
|---|---|
| Contains VMware’s enterprise OID and top-level OID assignments. |
| Contains common textual conventions used by all VMware MIB files. |
| Defines OIDs to identify each SNMP agent for each VMware platform by name, version, and build platform. |
| Defines trap types and variables used to report on the state of physical hardware of the host computer. |
| Defines variables used to report information on resource usage of the VMkernel. |
| Contains trap definitions sent by vCenter Server. |
| Defines the capabilities of the VMware agents by the various product versions. |
| Contains the variables used to report information about virtual machines. |
| Defines OIDs that have been made obsolete to maintain backward compatibility with earlier versions of VMware ESXi. These variables were previously defined in the obsolete files |
One of the critical aspects of managing your VMware ESXi deployment is monitoring the performance and health of your hosts to ensure that you have sufficient capacity and that performance issues are not adversely impacting your end users. VMware ESXi and vCenter Server provide a number of tools that you will use to monitor the performance of your hosts.
The Resources pane is available on host and virtual machine objects. On a host object, the Resources pane provides a summary of central processing unit (CPU) usage, memory usage, a summary of accessible datastores, and a list of available virtual machine networks. The Resources pane for a virtual machine shows the same items, but for memory displays both the amount of host memory consumed as well as the quantity of memory being actively used by the virtual machine. The pane also displays both the amount of storage being used and the quantity of storage provisioned. These values can be useful to determine whether you are using snapshots or thin provisioned disks. While the Resource pane does not provide comprehensive performance data, it can be used to get a quick view of the performance of a host or virtual machine and potentially point in the direction of a resource bottleneck or constraint.
Another tool to gather a performance overview quickly is the Virtual Machines tab. This tab is available at a number of vCenter Server objects and displays the data shown in Table 6.3. This information can be used to isolate a virtual machine that may be consuming an excessive quantity of resources. Similar to the Virtual Machines tab is the Hosts tab. The Hosts tab is available on the vCenter Server, folder, datacenter, and cluster objects. As with the Virtual Machines tab, the Hosts tab provides a high-level overview of performance, which may, for example, isolate a problem host within a cluster.
Table 6.3. Virtual Machines Tab Column Information
Label | Description |
|---|---|
Name | The name of the virtual machine |
State | The virtual machine state, such as powered on, powered off, or suspended |
Status | The condition of the virtual machine |
Provisioned Space | The maximum potential datastore space required to run the virtual machine |
Used Space | The datastore space currently used by the virtual machine, including snapshot data |
Host | The vSphere host that is currently running the virtual machine |
Host CPU – MHz | The processor usage of the virtual machine |
Host Mem – MB | The amount of host memory being used to run the virtual machine |
Guest Mem - % | The percentage of memory assigned that is actively being used by the guest operating system |
Guest OS | The guest operating system for the virtual machine |
VM Version | The virtual machine hardware version |
Memory Size | The amount of memory allocated to the virtual machine |
CPU Count | The number of virtual CPUs assigned to the virtual machine |
NIC Count | The number of virtual NICs assigned to the virtual machine |
Uptime | The amount of time that the virtual machine has been powered on |
IP Address | The IP address of the guest operating system as detected by VMware Tools |
VMware Tools Status | The status of VMware Tools, which may be OK, Not Installed, Out of Date, or Unmanaged |
DNS Name | The DNS name for the guest operating system as detected by VMware Tools |
EVC Mode | The Enhanced vMotion Compatability mode under which the virtual machine is operating |
UUID | The Universally Unique Identifier for the virtual machines |
Notes | Note data entered for the virtual machine |
Alarm Actions | The status of alarms, which can be set to Enabled or Disabled for each virtual machine |
vCenter Server provides the ability to create alarms for events, conditions, and states that occur with objects in your vSphere datacenter. A number of predefined alarms are available that monitor clusters, hosts, virtual machines, and other objects. You may also create custom alarms for conditions, states, and events that are not covered by the predefined alarms. Creating and managing alarms are covered in the following section.
Another of the tools in vCenter Server for monitoring the performance of your ESXi hosts is the Performance tab. ESXi collects a large number of performance statistics for various objects and these are stored in the vCenter database for long-term analysis. With vSphere 4.1, a number of new counters are now included in the following categories: Datastore, Power, Storage Adapter, and Storage Path. Use of the Performance tab is covered further in the section “Working with Performance Charts.”
The last vCenter tool that will be highlighted in the following sections is the Report view on the Storage Views tab. The Reports view can quickly show information about items such as storage allocation and utilization, summarized storage use by individual virtual machines, and multi-pathing status.
vCenter Server alarms are not a new feature with vSphere 4.1, but each new release increases the number and scope of triggers that are available to generate new alerts about potential problems with your vSphere environment. For example, with vSphere 4.1, there are two new host alarms. With one of the alarms, you can monitor the status of your host’s Baseboard Management Controller. With the other, you can monitor the fullness of the host’s IPMI System Event Log.
vCenter Server comes with a number of predefined alarms on the vCenter Server objects. These include alarms for host errors, virtual machine issues, and storage problems, among others. To view these alarms, select your vCenter Server host, and then select the Alarms tab and click Definitions. When you create an alert on a vCenter object, it applies to all child objects, such as folders, datacenters, clusters, network, datastores, hosts, and virtual machines. So the alarms that come predefined on the vCenter Server object will be applied to all objects within your datacenter. If you select the Alarms tab on a child object, the list will be filtered to show only applicable alarms. The Alarms tab for a host will show alarms related to host hardware, licensing, and networking, but none for virtual machines. Likewise, the Alarms tab for a virtual machine will display only alarms that apply to virtual machines.
You can create alarms at any level within vCenter. In some cases, you may find it best to define your alarms at the vCenter Server object so that it will apply to your entire vSphere infrastructure. However, sometimes you may want to create an alarm for a specific cluster should you have specific alerting requirements for it that do not apply to the other clusters in your datacenter.
When you create an alarm, you must define a trigger that generates a warning or alerts for a specific criteria being met. Triggers can either be event triggers or condition and state triggers. With an event trigger, a specific event will have occurred for a vCenter Server object. This can include a host being found to be noncompliant with the host profile assigned to it or an account being created on the host. Condition and state triggers monitor the current condition and state of vCenter Server objects, such as hosts and virtual machines. Common examples of these triggers include the CPU usage for a host or the power state for a virtual machine.
When you’ve decided which level to create a new alarm at, the following process can be used to create a new alarm. This example creates an alarm that monitors for datastore overallocation. With the support in vSphere for Thin Provisioning, it is possible to allocate more disk space to virtual machine disk files than is actually available in the datastore, so it is important to monitor available space on your datastores. There is a predefined alarm that will monitor the actual space being used on the datastore, but the disk overallocation trigger will help you find data-stores that may experience future space constraints.
In the inventory view, select the vCenter object on which you will create the alarm.
Select the Alarms tab and then click Definitions. You will see a list of alarms that have been defined for the object.
Right-click on a blank space around the predefined alarms and select New Alarm.
Enter an Alarm Name and Description on the General tab of the Alarm Settings dialog box.
In the Monitor drop-down list, select Datastores. If the Datastores option is not available, you need to create the alarm on a vCenter object that supports Datastore alarms. For example, if you try to create a new alarm on a cluster object, you have only the Monitor options of Virtual Machines, Hosts, and Clusters.
Select the radio button Monitor for Specific Conditions or State.
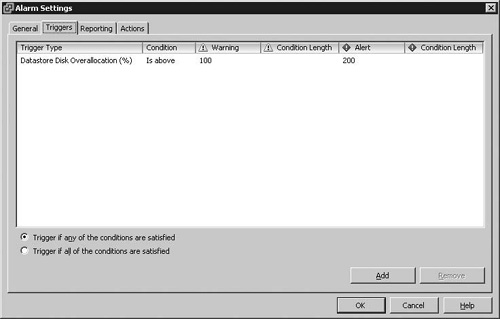
Select the Triggers tab and then click Add to create a new trigger. In this example, a single trigger is used, but you can add multiple triggers and also specify whether the alert should trigger if any or all conditions are met.
Change the Trigger Type to Datastore Disk Overallocation (%) as shown in Figure 6.12. As a condition trigger, the Condition state is set to issue a warning or error when the condition is above a certain measurement. You can change the default values of 100 and 200 that are used to determine when to send a warning or alert.
On the Reporting tab, no change to the Range and Frequency setting is required.
Select the Actions tab and click Add. For a datastore alert, you may select among the actions of Send a Notification Email, Send a Notification Trap, or Run a Command. You can have multiple actions and you can also specify to which change-level notification an action will apply. Select the default Action of Send a Notification Email, and then click the Configuration field. Enter an e-mail address to which the alert will be sent. If you enter multiple e-mail addresses, separate them with commas.
Click OK to complete the process of creating an alarm.
One of the improvements to alarms that was introduced in vSphere was the ability to create triggers based on events. This allows for the monitoring of a wide range of events for virtual machines, hosts, clusters, and other vCenter objects. Event triggers can be created on any event that is available within the vSphere application programming interface (API). The API reference for vSphere 4.1 can be found at the following link: http://www.vmware.com/support/developer/vc-sdk/visdk41pubs/ApiReference/index.html. The API Reference documentation does not include a specific list of event triggers, but the VMware Communities document “vSphere Alarm Triggers” found at http://communities.vmware.com/docs/DOC-12145 includes a number of PowerCLI scripts to generate a list of event triggers.
The first example will create an alarm that triggers should the host loose network connectivity.
In the inventory view, select the vCenter object on which you will create the alarm.
Select the Alarms tab and then click Definitions. You will see a list of alarms that have been defined for the object.
Right-click on a blank space around the predefined alarms and select New Alarm.
Enter an alarm name and description on the General tab of the Alarm Settings dialog box.
Select Hosts for the Monitor type, and check the option Monitor for Specific Events Occurring on This Object.
Select the Triggers tab; then click Add to add a new event.
Change the event to Lost Network Connectivity. The status should be changed to Unset.
You can then configure any desired actions to be taken should the aarm be triggered.
Click OK to save the new alarm.
With the proceeding example, no advanced conditions were set for the event trigger. The trigger of Lost Network Connectivity will either be true or false, so no further conditions need to be configured. The following example looks at the host’s power status. In this case, the trigger has a status of Normal, Warning, or Alert. When you’re examining the API documentation or the output of the PowerCLI scripts from the “vSphere Alarm Triggers” document, you’ll find that the Power status of a host is a condition of the Hardware Health Changed event trigger. To enable an alarm based on the power status of the host, you have to configure advanced conditions, as shown in this example.
In the inventory view, select the vCenter object on which you will create the alarm.
Select the Alarms tab, and then click Definitions. You see a list of alarms that have been defined for the object.
Right-click on a blank space around the predefined alarms, and select New Alarm.
Enter an alarm name and description on the General tab of the Alarm Settings dialog box.
Select Hosts for the Monitor type, and check the option Monitor for Specific Events Occurring on This Object.
Select the Triggers tab; then click Add to add a new event.
Change the event to Hardware Health Changed. Set the status to Normal; then click the Advanced link in the Conditions column.
Create two arguments. The first will have an argument type of Group with an operator of Equal To and a value of Power. The second argument should be set to a type of NewState with an operator of Equal To and a value of Green. Click OK to close the Trigger Conditions window.
Repeat steps 6 to 8 to add events with a status of Warning and Alert. The Warning event will be set to have a NewState of Yellow, and the Alert event will have a NewState of Red.
Once you have added the three event triggers, add your desired Actions. Then click OK to save the new alarm.
In the previous section of this chapter, you learned how to create alarms with vCenter Server. You create and edit alarm definitions by selecting the Alarms tab and then choosing the Definitions view. To view triggered alarms, you select the Triggered Alarms view as shown in Figure 6.13. The Triggered Alarms view shows any warning or alerts that have been triggered for the vCenter object that you have selected or any child objects. The sample in Figure 6.13 has the vCenter Server object selected and it has three child objects with warnings or alerts that have been triggered.
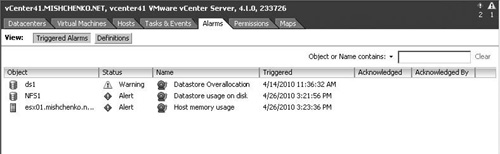
When you select any vCenter object that has a triggered alarm for itself or a child object, the vSphere client displays either a warning or alert icon in the top-right corner of the content pane along with the number of warnings or alerts. This is also shown in Figure 6.13. If you click on the icons, the vSphere client switches to the Triggered Alarms view for that object.
Once you have reviewed the triggered alarms for an object, there are a number of actions that you can take. These include acknowledging the alarm, resetting the alarm, changing the alert, and disabling alarms.
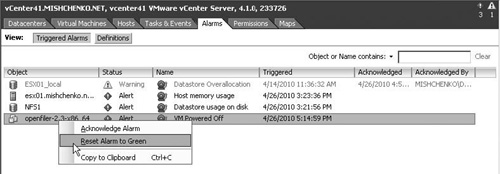
Alarms that have a type of Monitor for Specific Conditions or State have typically been set up to monitor resource usage such as host CPU usage or space consumed on a datastore. With these alarms, as long as the condition that triggered the alarm persists, the alarm remains displayed in the Triggered Alarms view. Only after the alarm condition is resolved is the alarm removed from the list of triggered alarms. For these alarms, you can select the Acknowledge Alarm option. If you right-click on the triggered alarm, you have the option Acknowledge Alarm. Once you have selected the option, the Acknowledged column shown in Figure 6.13 is populated with the time stamp showing when the alarm was acknowledged, and the Acknowledged By column shows the user who acknowledged the alarm. The alarm still appears in the Triggered Alarms view, but it is grayed out. Once the alarm condition no longer exists, the alarm is removed from the view.
The other alarm type is set up to Monitor for Specific Events Occurring on This Object. Examples of this type of alarm include a virtual machine being powered off or a host being noncom-pliant with its host profile. With this type of alarm, you can also select the Acknowledge Alarm option or you can select the option Reset Alarm to Green as shown in Figure 6.14. This option is useful if vCenter Server does not retrieve an event that indicates that the alarm condition has returned to normal conditions. To reset an alarm right-click on the triggered alarm and select Reset Alarm to Green. The alarm is no longer displayed in the Triggered Alarms view until the alert condition reoccurs.
In some cases, you might find it appropriate to disable alarm actions. This is a different option than editing an alarm and clearing the Enable This Alarm option. When you disable alarm actions, this is done on a vCenter object. Alarms are still triggered for an object, but the actions associated with the alarms no longer run. When you choose to disable alarm actions for an object, all alarm actions are disabled. However, alarm actions for child objects continue to execute. To disable alarm actions, right-click on the object when connected to vCenter Server and select Alarm > Disable Alarm Actions. You can enable alarm actions by right-clicking on the object again and selecting Alarm > Enable Alarm Actions.
While it is a useful option to disable alarm actions for an object, you may want to do so only temporarily. You can find objects that have had alarm actions disabled by looking in the following places in the vSphere client:
In the General pane of the object’s Summary tab.
On the object’s Alarm tab. If alarm actions are disabled, a warning message is displayed.
In the Alarm Actions column of an object’s child objects tab. This includes the Datacenters, Hosts, Virtual Machines, and Datastores tabs. Each item listed in the view has a status of either Enabled or Disabled for the Alarm Actions column.
Lastly, when managing your alarms, you may want to change an alert. After you create an alarm, you may find that you need to edit the trigger conditions to better match those that are true alarm conditions in your environment. To change an alarm, you select the Definitions view and then right-click on the alarm to select Edit Settings. If you see the View Settings option instead, the alarm has been defined on a parent object and should be edited at that level.
Although vCenter Server alarms are great for alerting you to problem conditions or that certain conditions have occurred, the information that they provide is insufficient to deal with problems such as performance response. vCenter Server performance charts allow you to view CPU, disk, memory, and storage metrics for a number of vCenter objects. Chart types include bar charts for displaying datastore storage metrics in a selected datacenter; line charts for displaying metrics for a single inventory object such as network packets received by a host; pie charts for displaying storage metrics for a single datastore or virtual machine; and, lastly, stacked charts for displaying performance metrics for the child objects of a selected parent object.
Performance charts are available on the following vCenter objects: datacenters, clusters, hosts, resource pool, virtual machines, and datastores. When you select one of these options, the performance chart defaults to the Overview layout. The Overview layout summarizes a number of relevant performance metrics for that object. You can also select the Advanced layout. With this layout, you can see data point information for specific performance metrics, customize chart views, and export data for use with other applications. With vCenter Server 4.1, the Advanced layout is available for all of the previously mentioned objects except datastores.
Note
The Overview layout views on the Performance tabs are dependent on the VMware VirtualCenter Management Webservices service running on your vCenter Server host. If you receive any errors when accessing the Overview layout, make sure that the service is running. This is not the case for the Advanced chart layout, but is also the case for the Storage Views and Hardware Status tabs, which will be discussed later in this chapter.
The Overview layout is the default view when selecting a Performance tab for a vCenter object. It provides a high-level overview of the relevant performance metrics for the object you are viewing. A number of charts are shown at the same time, allowing you to do a side-by-side comparison of resource usage for your chosen vCenter object. Figure 6.15 displays the Space view for a datastore on an ESXi host. The two pie charts at the top of the Space view display the space utilization by file type and by the top-five space-consuming virtual machines. The Space view also includes a line chart that summarizes the space being used in the datastore. Most views contain a number of charts that extend beyond what the vSphere client can display, so in most views you need to use the scroll bars to view all the charts provided. Table 6.4 provides a summary of the available views for the vCenter objects for which an Overview performance layout is available. Each Overview layout provides at least one view and you can select the View drop-down menu to choose another view.
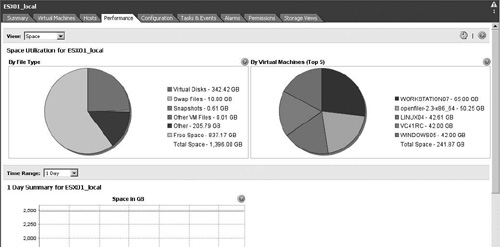
Table 6.4. Available Views for Various vCenter Objects When Using the Overview Performance Layout
Performance Tab | View Option | Description |
|---|---|---|
Datacenter | Storage | The view summarizes datastore usage, including utilization by datastore, space used by datastore, and line charts showing changes in datastore space usage. |
Cluster | Home | The Home view is the default view for clusters. Two charts summarize the CPU and memory usage for the cluster. |
Hosts | This view shows a number of CPU, memory, and disk charts for each host in the cluster. The view also summarizes CPU and memory usage for the top-10 consuming hosts in the cluster. | |
Resource Pools & Virtual Machines | This view summarizes CPU and memory usage for resource pools and CPU, memory, and disk statistics for virtual machines. The view also summarizes CPU and memory usage for the top-10 consuming virtual machines in the cluster. | |
Host | Home | The Host Home view displays a number of summary charts for CPU, memory, disk, and network usage. |
Virtual Machines | This view summarizes CPU, memory, and disk statistics for virtual machines. The view also summarizes CPU and memory usage for the top-10 consuming virtual machines on the host. | |
Resource Pool | Home | On the Resource Pool Home view, two charts summarize the CPU and memory usage. |
Resource Pools & Virtual Machines | This view summarizes CPU and memory usage for resource pools and CPU, memory, and disk statistics for virtual machines. The view also summarizes CPU and memory usage for the top-10 consuming virtual machines in the resource pool. | |
Virtual Machine | Home | The Virtual Machine Home view displays CPU, disk, memory, and network performance metric charts for the virtual machine. |
Storage | The Virtual Machine Storage view shows the space utilization by file type, space utilization by datastore and a line chart showing the space used by the virtual machine over a period of time. | |
Datastore | Space | The Space view is the default view for the datastore Performance tab. It displays the space utilization by both file type and top-five virtual machines. The view also shows a summary of space usage for a selected period of time. |
Performance | The Datastore Performance view includes a number of charts displaying storage-related performance metrics such as I/O operations per second (IOPS) and disk latency. |
For some time-based line charts, you can select the range of data displayed. This is the case with the Space in GB chart shown in Figure 6.15. Depending on the object you are looking at, you can select a range of Realtime, 1 Day, 1 Week, 1 Month, 1 Year, or a custom period. The Realtime range displays the last hour of performance data that the host has generated.
Note
The Overview layout is available only when the vSphere client is connected to vCenter Server. If you are connected directly to an ESXi host, you will only have access to the Advanced layout and only for the host, resource pool, and virtual machine objects. When connected directly to an ESXi host, you are limited to viewing only real-time statistics, which includes the last one hour of performance data.
With advanced performance charts, you can customize your charts with the metrics you want to examine more closely. There are a number of customization options you can choose and you can export the performance data to a Microsoft Office Excel Workbook or a number of image file formats.
Figure 6.16 displays the Advanced layout for a VMware ESXi host. In the top-left corner of the image, you can see that the Power performance metrics are being displayed and that the data is being shown in real time. The Chart Options link allows you to configure the data shown in the chart; you can select the performance metric group to display, the chart type to use, and the time period to display. To the right of the Chart Options link you can use the Switch To drop-down menu to select a performance metric group to display. The available performance metric groups displayed depend on the type of vCenter object that you have selected. A summary of those groups is available in Table 6.5. To the right of the Switch To menu are icons for printing the current chart, refreshing the chart data, saving the chart, and detaching the chart from the vSphere client. The option to detach the performance chart is helpful if you want to keep the performance chart open while you perform other tasks with the vSphere client. You can detach multiple performance charts for side-by-side comparisons. When you select to save a chart, you can save it as an image file or an Excel Workbook. When you save the chart as an Excel Workbook, the spreadsheet is populated with the data points that comprise the chart along with chart that is based on that data.
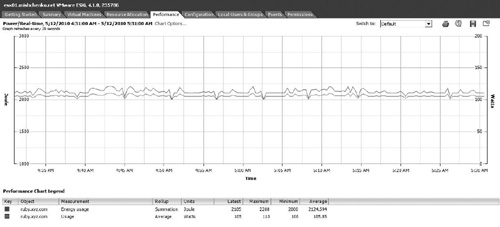
Table 6.5. Summary of vSphere Performance Metric Groups
Performance Tab | Description |
|---|---|
Cluster Services | Displays aggregate CPU and memory statistics for DRS and HA failover statistics. This view is available for clusters and hosts that are part of a cluster. Cluster Services does not provide real-time statistics. |
CPU | Shows various CPU statistics. Available for clusters, resource pools, hosts, and virtual machines. |
Datastore | Displays counters related to datastore performance, such as IOPS and latency. This view is available for hosts and virtual machines. Only real-time statistics are available. |
Disk | Storage performance statistics are displayed. This view is available for hosts and virtual machines. |
Memory | Displays the amount of memory granted. Available for clusters, resource pools, hosts, and virtual machines. |
Network | Shows various network performance statistics. This view is available for hosts and virtual machines. |
Power | Displays real-time energy statistics for hosts and virtual machines. |
Storage Adapter | Presents real-time write and latency statistics for a host’s storage adapters. |
Storage Paths | Shows real-time write and latency statistics for each storage path that a host has for each storage logical unit number (LUN). |
System | Displays statistics for system availability, CPU usage, disk usage, and memory overhead. This view is available for hosts and virtual machines. |
Virtual Disk | Provides real-time write and latency storage statistics for virtual machines. |
Virtual Machine Operations | Displays counts for various virtual machine counters, such as power on count, cloning, and vMotion events. |
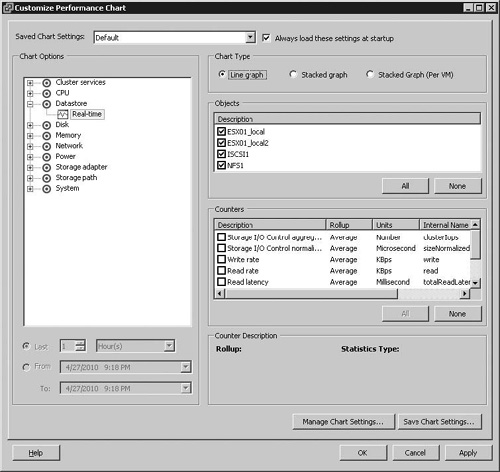
When you select a group of performance counters to view with the Switch To menu, a set of default counters is displayed for the chosen performance metric group. You click on the Chart Options link to change the counters that are displayed as well as the chart type and time period shown. To customize your performance chart, you can follow this process:
Select the object you want to obtain performance data for and click the Performance tab.
Click Advanced and then select Chart Options.
Select the metric group to display.
Select a time range for the metric group. Some metric groups such as the Datastore group have only a real-time option, as shown in Figure 6.17. You can select Custom to specify your own time range if desired.
Select an appropriate chart type for your custom chart. When you select a stacked graph option, you may select only a single performance counter. If you are changing the chart options for a host, you also have the option Stacked Graph (per VM).
In the Objects pane, select the inventory objects to display in your chart.
In the Counters pane, select the performance counters to display. If you select a counter, information will be displayed about it in the Counter Description panel.
Click Apply to update your performance chart.
Click OK to close the dialog box and return to your performance chart.
If you plan to use the same chart settings on a continual basis, you can save your settings. Once you have configured your chart settings, click Save Chart Settings. Enter a new chart name in the dialog box that appears and then click OK to save the chart. You can select your new custom chart in the Saved Chart Settings drop-down menu and optionally check Always Load These Settings at Startup to make your new chart the default for when you select the Advanced layout for that specific vCenter object again. Chart settings are saved on a per-vCenter-object basis, so if you save a custom chart for one ESXi host, it will not be available for your other hosts. To delete a custom chart view, click Chart Options for the vCenter object and then select Manage Chart Settings. Select the chart to remove and click Delete. The chart will no longer be available on the Switch To menu.
On a performance chart, you can save the chart data to an Excel file that contains the data for that specific chart. You can also export all performance counters to an Excel file with the following steps:
Select the object in the inventory pane.
Select File > Report > Performance. The Performance menu option is available only if performance data is available for that specific vCenter object.
Select an export filename on the Export Performance dialog box, as shown in Figure 6.18.
Choose a time range for the chart. If you are connected directly to your ESXi host, this option will not be available and you will only be able to download real-time data.
Select the chart type.
Select the performance metric groups to export. You can optionally click Advanced and then use the Customize Performance Chart dialog box as shown in Figure 6.17 to choose specific performance counters.
Select the size of the chart to be created in the exported files.
Click OK to export your data.
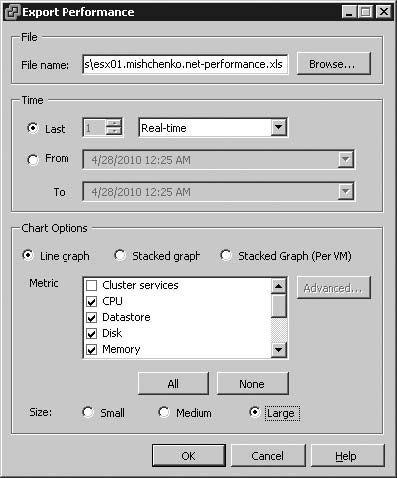
The export process creates an individual Excel file for each metric group and another Excel file that pulls each of those files into a single Excel workbook.
Note
If you have performed performance monitoring or troubleshooting with VMware ESX, one of the tools you may have used is esxtop. This tool is based on the Unix tool top. You can use esxtop to monitor real-time performance statistics for your host and the virtual machines running on it. As it is a Service Console tool, it is not available with ESXi (it is available in Tech Support Mode, but should not be used for regular production use). Instead, the vCLI provides the tool rexstop to use. You’ll see how to use that tool in Chapter 8, “Scripting and Automation with the vCLI.”
One of the challenges of monitoring virtual machine performance in a virtualized environment is that the virtual machines are sharing various resources without knowing it. On a physical server, the operating system (OS) is aware of the total amount of physical memory that the host has. That’s not the case for an OS running in a virtual machine. It is aware of how much memory has been allocated to it, but that memory could be physical memory allocated solely to that virtual machine, or physical memory shared with other virtual machines; or, if the host is running low on memory, the virtual machine’s inactive memory may have been swapped by ESXi to disk. Thus when you’re troubleshooting performance issues in a virtual machine, you cannot depend solely on the performance counters that the guest OS is reporting.
For Windows guests, VMware Tools includes virtual machine–specific performance counter libraries for the Windows Performance Monitor utility. With these performance counter libraries, you can accurately see virtual machine CPU and memory usage. To access these performance counters with Windows 2008 Server, use the following process:
On the Start menu, go to Administrative Tools > Reliability and Performance Monitor.
Select the Performance Monitor view.
In the Add Counters dialog box, select Local Computer as the source for counters.
Scroll down the list of performance metric groups to find VM Memory and VM Processor.
Select the performance counters you want to monitor and click Add.
Click OK to close the dialog box.
If you consider the issue described previously with memory, when you use native memory performance counters, you can ascertain what the OS believes is happening with memory. If it is low on memory, you can determine that the OS is starting to page memory to disk. But you will not be able to see what the host is doing with memory. With the VMware performance counters, you can see whether the host is swapping the virtual machine’s memory to disk. You can also determine the share allocation for memory, if a limit exists and if the memory balloon driver is being used. Likewise, with the VMware CPU performance counters, you can determine things such as actual CPU usage, determine the time that the virtual machine was runnable but not scheduled to run, and whether a CPU limit exists.
vSphere 4.1 Memory Compression
Memory compression is a new feature in vSphere 4.1 used to further enhance vSphere’s ability to perform memory overcommitment and thus to increase the number of virtual machines running on a single host. With memory over-commitment, you can allocate more memory to virtual machines than exists on a host as there will typically be virtual machines that are not using the full allocation of memory granted to them.
With vSphere 4.0 and prior versions of ESXi and ESX, the following three methods were used to reclaim memory from virtual machines: sharing memory across virtual machines, using the memory balloon driver, and using swap files.
A typical workload running on VMware ESXi includes the same guest operating systems, the same applications, and common data. ESXi uses the transparent page sharing (TPS) technique to share memory between those virtual machines. ESXi runs a background TPS process to find and eliminate redundant copies of memory pages. With a fairly constant workload, ESXi can slowly increase the amount of free memory on the host, allowing you to run more virtual machines on that host.
Part of the installation of VMware Tools includes the driver vmmemctl, which enables the memory balloon driver. When a host is running low on physical memory, the memory balloon driver uses a proprietary ballooning technique that causes the guest operating system to determine that it is running low on memory. The guest OS then uses its own native memory management tools to determine which memory pages to reclaim and if necessary which memory pages to swap to its own memory swap file on its virtual disk.
If the vmmemctl driver is not responding or able to force the guest OS to free any additional memory, ESXi uses swap files to reclaim memory forcibly from virtual machines. For optimal performance, ESXi relies on the memory balloon driver to reclaim memory before it begins to use swap files.
With ESXi 4.1, compressed memory is a new level in the memory hierarchy existing between RAM and disk swap files. Memory compression is enabled by default, and if a host’s memory becomes overcommitted, ESXi uses compression before it uses swap files, as accessing compressed memory is much faster than accessing the same memory page that has been swapped to disk. When a memory page in a virtual machine must be swapped, ESXi first attempts to compress the page. If the page can be compressed to 2KB or smaller, it is stored in the virtual machine’s compression cache rather than being swapped to disk. Figure 6.19 shows the quantity of compressed memory per virtual machine for a host that is memory overcommitted.
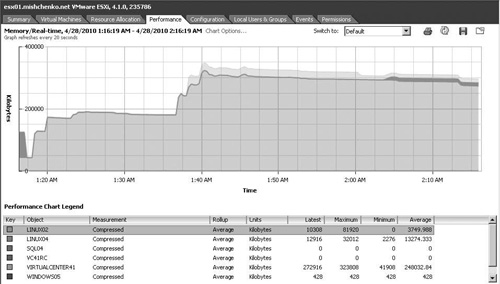
Memory compression is controlled by using the Advanced Settings dialog box in the vSphere client. There are a number of settings that will control the behavior of memory compression on the host. The setting Mem.MemZipEnable is used to enable or disable memory compression and by default is enabled with a value of 1. The setting Mem.MemZipMaxPct is used to configure the size of the compression cache for the virtual machines on the host. The default value is 10 percent. With that value, for a virtual machine with 1000MB of memory, ESXi uses up to 100MB of memory for a compression cache.
The last vCenter Server tool that this section examines is the Storage Views tab. With prior versions of vCenter Server, it was difficult to find information about disk utilization or snapshot usage. With the Storage Views tab, it is now possible to determine information such as the free space for all datastores, the snapshot space being used by individual virtual machines, and the status of all storage paths.
Note
Several requirements must be met before you can use the Storage Views tab in the vSphere client. First, it is available only when connecting to vCenter Server. Second, it is dependent on the VMware VirtualCenter Management Webservices service that runs on your vCenter Server host. Last, the Storage Views tab is delivered as a vSphere client plug-in. The plug-in is installed by default when you install the vSphere client. If the tab is missing, go to Plug-ins > Manage Plug-in in the vSphere client and ensure that the vCenter Storage Monitoring plug-in is installed and enabled.
The Storage Views tab is available on the following vCenter objects: datacenters, datastores, clusters, hosts, resource pools, and virtual machines. The tab provides both a Reports view and a Maps view. The Reports view provides a number of relationship tables that display how the object is related to storage resources and summary storage usage for the object. The Maps view provides storage topology maps that represent the relationships between the vCenter object and its storage resources.
The Reports view on the Storage Views tab provides a number of helpful reports on storage information. If you select the Datastore inventory view and then look at a specific datastore, you can quickly ascertain which virtual machines are using the datastore, which hosts have access to the datastore, and the status of all paths to the storage LUN. Figure 6.20 shows a report for a specific datastore. By default, the report shows which virtual machines are using the datastore, which host the virtual machine is on, what the multipathing status is, how many virtual disks for the virtual machine are on that datastore, the total datastore space used, and how much snapshot space is used for the virtual machine.
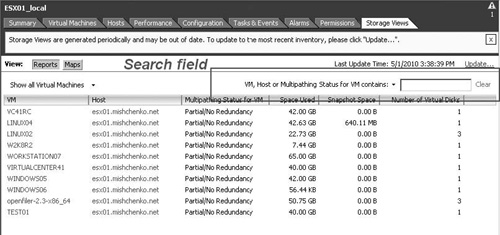
Note
You’ll note in Figure 6.20 that the Last Update Time is displayed for the report. Report data is refreshed every 30 minutes, but you can click the Update link to refresh the data displayed manually.
For each vCenter object, there are a number of specific category report views that you can use. To change the report category, use the Show All < Category Name drop-down menu. Figure 6.20 has the Show All Virtual Machines category displayed, and depending on the vCenter object you have selected, you’ll have the choice of the following categories:
In certain report categories, you’ll note that some items are highlighted in blue. In the case of Figure 6.20, the virtual machines and host are highlighted in such a manner. If you click on one of those items, the vSphere client will take you to the Storage Views tab for that specific object. You can also change the columns that are displayed for a specific category. Right-click on the column headings in the Report view and you will be presented with a list of columns to show or hide. With the Show All Virtual Machines category, you can select to view Virtual Disk Space, Uncommitted Space, and other columns relevant to virtual machine storage usage.
If you find that too much data is shown in a certain category report, you can filter the results using the search field shown in Figure 6.20. Click the search field arrow and select the attributes to include in the search. Type in a keyword and press Enter to search the Report view. You can click the Clear link to remove your search filter.
If you want to work with the data in the Report view in another application, you can easily export the data. Right-click below the table data and select Export List menu option. On the Save As dialog bog, enter a filename for your export file, select an appropriate file format, and click OK to save the file.
Storage maps provide a visual representation of the relationships between the vCenter object that you select and the storage resources that it uses. The storage maps display only items relevant to the specific object and are object-centric. As with the Report view map, data is updated every 30 minutes but you can click the Update link shown in Figure 6.21 to refresh the data used to generate the map.

Figure 6.21 displays the storage map for a specific host. Using the Show options, the user has updated the display to show only the datastores available to the host and the virtual machines stored on those datastores. You can select any number of items in the Show area and then click Update Now to update the generated map.
In some cases, you may find the map so cluttered that you cannot properly view all the items. You can right-click on an item and select Hide Node to remove it from the map. To select multiple objects, press the Ctrl key while selecting the objects and then right-click to select Hide Node. To display any hidden objects, right-click on the map and select Show Hidden Nodes. For an alternative to hiding items, you can click one or more objects in the map to select them and then drag them to an empty space on the map.
You can export the map for use in other applications. Right-click on an empty space in the map and select Export Map. You can select among a number of image formats when saving the file. If you want to examine an object in the map more closely, you can right-click on an object to view a number of Switch To options on the context menu. In Figure 6.21, a datastore is selected and you can switch to the Configuration tab, Summary page, Storage Maps view, or one of the Storage Report views for the datastore.
In earlier versions of ESX, if you wanted to monitor your hardware, you were required to install a Service Console–based agent. For example, if you wanted to monitor and manage an Emulex Host Bus Adapter (HBA), you would need to download and install Emulex’s HBAnywhere agent and command-line interface (CLI) within the ESX Service Console. As VMware ESXi is designed to make the server a computing appliance, it runs more like the firmware you would find on a router or storage area network (SAN) rather than a traditional software package. Without the Service Console, it is no longer possible to install hardware agents on ESXi; thus VMware has provisioned Common Information Model (CIM) providers through which monitoring and management tasks can be accomplished. VMware partners are also able to add their own proprietary CIM providers. In the case of monitoring Emulex HBAs, an Emulex CIM provider is included on the ESXi installation media and you can manage your HBAs with HBAnywhere running on a remote management workstation.
To reduce the system footprint and eliminate the need for additional third-party agents, which can introduce instabilities and other problems, VMware has incorporated the standard CIM into ESXi and ESX. The CIM is an open standard that defines how managed elements in your information technology (IT) environment are represented as a set of common objects and the relationships among them. The CIM standard is defined and published by the Distributed Management Task Force (DMTF). Another DMTF standard used is the Web-Based Enterprise Management (WBEM), which defines a particular implementation of CIM, including protocols for discovering and accessing CIM implementations.
The CIM framework consists of CIM providers, which in this case are developed by VMware and its partners to enable management and monitoring of the hardware devices in your vSphere environment. As your hardware environment is represented using an open standard, any management tool that implements the CIM standard can manage your host. Management applications use protocols such as CIM Extensible Markup Language (CIM XML) and Web Services for Management (WSMAN) to monitor and manage the device information provided by the CIM providers. The ESXi CIM implementation consists of the components shown in Figure 6.22.

Providing data to the CIM providers are various components such as the drivers used to interact with your host’s hardware, the host’s Intelligent Platform Management Interface (IPMI), and the system management Basic Input/Output System (SMBIOS). The CIM providers are used to access the device drivers and the host’s hardware. VMware writes providers that implement monitoring of hardware components, the storage infrastructure, and virtualization specific resources. Hardware vendors can also provide CIM providers for their specific devices. In some cases, these provide an interface that can be used to configure hardware devices, such as changing an array on a storage controller. In other cases, these providers extend the information that is available to management applications. While the VMware provider supplies basic information about a host’s CPUs, the vendor provider includes CPU temperature and more detailed CPU model and version information. Vendor-supplied CIM providers will either be included on the installation media or added as described in the next section.
Managing the CIM providers is the CIM object manager (CIMOM). The CIMOM can also be referred to as a CIM broker. The CIMOM in ESXi implements the Common Manageability Programming Interface (CMPI) standard. The CMPI standard defines a common standard of interfacing between CIM providers and clients and the CIM broker. VMware ESXi uses the Small Footprint CIM Broker (SFCB), which is designed for environments with constrained resources.
The CIM client running in ESXi is Openwsman, which is an open source implementation of the Web Services Management specification. Openwsman communicates with the CIMOM via the CMPI standard. The Openwsman service in turn exposes CIM data to external CIM clients such as the vSphere client. Openwsman supports CIM connections over CIM XML, WSMAN, and the Service Location Protocol (SLP).
In Chapter 2, “Getting Started with a Quick Install,” the section “Adding CIM Support to the Generic ESXi Installable Image” discussed how hardware vendors have begun to release offline update packages that add CIM support to the VMware release ESXi installation image. These packages use the vSphere Installation Bundle (VIB) format and can be installed on your host to augment the CIM data that will be provided to the CIM clients in your management infrastructure. Without the vendor-supplied CIM providers, you may not be able to obtain detailed health data for your servers and other hardware components.
The following process demonstrates the installation of the Dell OpenManage offline bundle for ESXi:
Download the most recent OpenManage offline bundle from Dell’s Web site.
Place the host in maintenance mode.
Execute the following command:
vihostupdate --server <IP address or hostname for your ESXi host> --install
 --bundle <path to OpenManage bundle>
Connect to the host with the vSphere client.
Select Software > Advanced Settings.
In the Advanced Setting dialog box, select UserVars on the left pane.
Find the value
CIMOEMProvidersEnabledand change the value to 1.Click OK to save your change.
Reboot your host.
When you have connected the vSphere client directly to an ESXi host, you can view the health status for the host on the Configuration tab. After you have selected Health Status, the vSphere client displays the status for all hardware components detected by CIM providers, as shown in Figure 6.23.
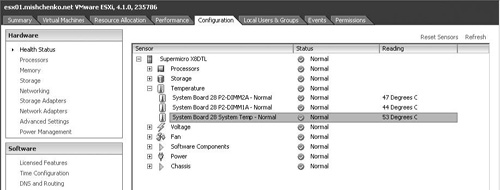
Components that are functioning normally display a status indicator of green. If a component is not functioning properly or is exceeding a performance threshold, the status indicator changes to yellow or red. A yellow indicator indicates degraded performance, whereas a red indicator means that a component has failed or has exceeded its highest threshold. If the status column for a component is blank, the CIM providers have not been able to determine the status.
The Reading column displays the current value for the sensors. In Figure 6.23, the Reading column displays the temperature of the motherboard in the ESXi host.
The data shown in the Health Status pages is refreshed automatically every few minutes. You can update the display manually by clicking the Refresh link. Some sensors display data that is cumulative over time. You can click the Reset link to clear the data for those sensors so that they begin to collect new data.
When you are connected to vCenter Server, the vSphere client no longer displays host health data on the Configuration tab. Rather, this data is now shown on the Health Status tab and the depth of information and functionality of the tab has expanded over what is available when directly connected to the host.
Figure 6.24 shows the hardware status for the same host as was shown in Figure 6.23. The Hardware Status tab includes a System Summary section showing the host’s BIOS version, model, serial number, asset tag, and quantity of warnings or alerts. The sensor data is more detailed as well. Figure 6.24 shows the actual temperature for the host’s motherboard along with defined threshold values. The Sensors view also provides access to the server’s IPMI event log and for this host information about the Baseboard Management Controller’s IP configuration and Media Access Control (MAC) address. You can expand or minimize the data shown in the Sensors view by clicking on the following links: Show All Sensors, Show All Details, and Hide All.
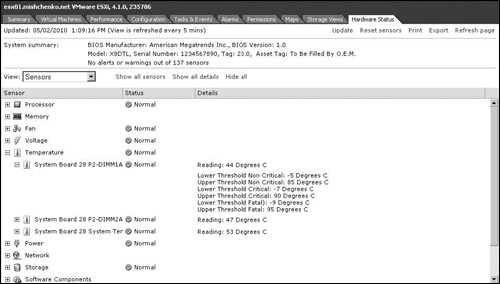
The Hardware Status tab also includes two views that are not available when directly connected to your ESXi host. These are the Alerts and Warnings view and the System Event Log view. The Alerts and Warnings view filters all sensor data to display only those sensors that are registering a warning or alert condition. The System Event Log view displays the data in the host’s IPMI system log. You can click the Reset Event Log link on that view to clear the IPMI log.
The data supplied in these views is updated every five minutes. You can click Update to update the data manually. Some host hardware sensors display data that is cumulative over time. Click the Reset Sensors link to clear the data for those sensors and begin collecting new data. Hardware Status tab views also include the option to print the data shown or to export the data to an XML file.
If you have a number of servers deployed, it is likely that you have also deployed a server management system. With Dell servers, you may be using Dell OpenManage Server Administrator and Dell Management Console, and with Hewlett-Packard (HP) servers, you may be using HP Systems Insight Manager (SIM) or Insight Control. These applications provide a central location to collect management data about your servers, including information about the base system, its processor, fan, power supply, memory, network, and storage subsystems. Information provided can include properties and health status for the individual devices in your infrastructure, as well as real-time event notifications.
If you’ve deployed VMware ESX in such a scenario, you have gone through the process of installing agent software in the Service Console, ensuring that dependent components were installed, and then configuring the Service Console firewall to allow agent network traffic to pass. This process can be complicated and lead to problems if you have a number of different agents to install.
With VMware ESXi, monitoring of the host is provided through the CIM interface as described in the previous section. CIM providers come embedded on the installation media. Hardware vendors can provide their own CIM providers to extend the hardware data that can be gathered. Those providers are distributed in easy-to-install VIB packages.
If you have used Dell OpenManage Server Administrator, you will be familiar with the Web-based interface that you access to obtain hardware information for your host and which can be used to manage your host. With ESXi, it is not possible to run the Web server at the console, so that component is moved to a management workstation. The process of providing an Open-Manage Server Adiminstrator interface to your ESXi hosts begins with installing the latest CIM provider from Dell as was described in the “Adding CIM Providers to Your ESXi Host” section earlier in this chapter.
Once you have completed those steps, you next install the Dell OpenManage Server Administrator Managed Node package onto a Linux or Windows management workstation. The Web server that is installed as part of this package communicates with ESXi through CIM to obtain hardware information, which is then passed onto the Web client as shown in Figure 6.25. When you log in to the Managed Node Web interface, you will be prompted for a host to connect to and login information. You specify the IP address or hostname for your ESXi server and a login that exists locally on your ESXi host.
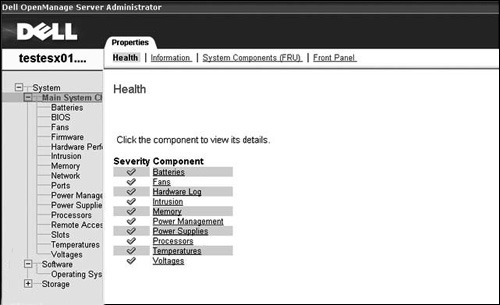
You may find that not all options are available when accessing your ESXi host with your systems management software. With Dell OpenManage Server Administrator and ESXi 4.0, the following features are not available:
Alert Management—Alert Actions
Network Interface—Administrative Status
Network Interface—DMA
Network Interface—Internet Protocol (IP) Address
Network Interface—Maximum Transmission Unit
Preferences—SNMP Configuration
Remote Shutdown—Power Cycle System with Shutdown OS First
About Details—server administrator component details are not listed under the Details tab
With some of these items, you may find alternative methods to obtain the data or functionality that is missing. SNMP alerts can be configured for ESXi and vCenter Server. Alerts can be configured within vCenter Server or with the host’s remote management card.
Regardless of the systems management software that you use, to monitor ESXi the application will have to obtain its data via CIM. Thus it is important to ensure that your host is maintained with the latest CIM providers from your hardware vendor to ensure the most complete set of information is available within the management application. Figure 6.26 shows a typical management view with HP Insight Control/Virtual Machine Manager. Within a single management console, you are provided with a unified view of your physical hosts and the virtual machines running on them. You can manage virtual machines with operations such as start, stop, copy, and clone. If a predictive hardware failure is detected on a host, virtual machines can be automatically moved to other hosts in your infrastructure.
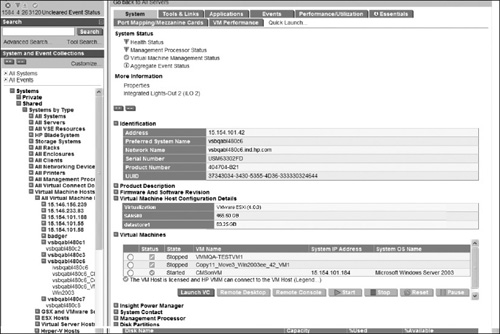
One of the critical elements of managing your ESXi hosts is backup and recovery. Although elements of vCenter Server such as vMotion, High Availability, and Alarms can help mitigate the downtime on your virtual machines due to a host failure, recovery of a failed host is an inevitable task that you will have to perform at some point. This section of the chapter deals with backup and recovery for both your ESXi host and the virtual machines hosted on them.
As discussed in Chapter 1, “Introduction to VMware ESXi 4.1,” ESXi was designed to be more like an appliance firmware than a general-purpose operating system. The thin design to ESXi also applies to the configuration state of the host. Changes made to the configuration of an ESXi host through the application programming interfaces (APIs) are bundled into a single archive file that allows the configuration of a host to persist through a reboot. The data contained in the configuration file state.tgz will be discussed further in Chapter 11, “Under the Hood with the ESXi Tech Support Mode.” For now, you only need to know that the single archive file contains the necessary configuration files for your host.
Although the improvements in scripted installs, host profiles, and vNetwork Distributed Switch may seem to negate the requirement to back up the configuration of your ESXi hosts, it is still a worthwhile endeavor to ensure that regular host backups are taken. Backup of an ESXi host is performed with the vCLI command vicfg-cfgbackup.
To back up the configuration of your ESXi host, run the vicfg-cfgbackup as shown in the following example:
vicfg-cfgbackup.pl --server esx05.mishchenko.net --save esx05.tgz

Saving firmware configuration to esx05.tgz . . .
You will be able to open the backup file with any archive utility that can handle a GZIP-compressed TAR file.
If at some point your ESXi host will not boot into ESXi, you may need to restore your backup configuration, but first you may need to run the recovery process to restore the system files for ESXi. The recovery process is run by booting the ESXi installation media in repair mode. When the installer is run in repair mode, all host configuration data is overwritten by system defaults. If your original install location contained a Virtual Machine File System (VMFS) datastore, it will be preserved.
To run the recovery process on your ESXi host, follow these steps:
Boot your host with the ESXi installation CD.
At the installer welcome screen, press R to begin the repair process.
Accept the VMware end-user license agreement by pressing F11.
From the Select a Disk screen, choose the disk that contained the original ESXi installation.
Press Enter on the Confirm Disk Selection screen to confirm your choice of the disk to be repaired.
On the Confirm Repair screen, press F11 to process with the repair.
Once the repair process has completed, a status of complete or incomplete will be displayed. In the case of an incomplete status, this may indicate that the repair process could not repair the partition table to recover any existing VMFS datastores. In such a case, you should contact VMware Support before proceeding if you need to recover virtual machine data on the installation target disk.
Reboot the host.
When the host has rebooted, it will have no prior configuration information so it will attempt to acquire an IP address from a Dynamic Host Configuration Protocol (DHCP) server. If you have no DHCP server available, you should use the Direct Console User Interface (DCUI) to set a static IP address for the host. The root password will be blank when you log in to the DCUI. If you had installed custom VIB packages, reinstall those before proceeding. You should also patch the host to the same version of ESXi you used for the last backup. If the same version of ESXi is not installed, you need to use the --force option when you run the restore command.
You can then use vicfg-cfgbackup to restore a prior configuration backup, as shown in the following example:
vicfg-cfgbackup.pl --server 192.168.1.55 --load esx05.tgz

The restore operation will reboot the host.
Type 'yes' to continue:
yes
Uploading config bundle to configBundle.tgz . . .
Performing restore . . .
When the restore process has completed, the host will automatically reboot. After the ESXi host has rebooted, start the vSphere client and connect to vCenter Server. The host will appear grayed out and have a status of Not Responding. Right-click on the host and select Connect. In the Recent Tasks pane, you should see a Reconnect Host task running. If the host is part of a cluster, additional tasks may be initiated to correct the HA or DRS configuration on the host.
If you experience problems starting your host after you have applied a patch or VIB to your ESXi host, it may not be necessary to complete the entire recovery process. As you’ll see in Chapter 11, it is possible to roll back to the previously installed version of ESXi.
Numerous options are available for backing up your virtual machines. You can use traditional backup agent, custom scripts, or third-party products that utilize the VMware vStorage API for Data Protection. The following section will examine VMware Data Recovery, which is included with various editions of vSphere. Data Recovery is built on the VMware vStorage API for Data Protection and integrates into vCenter Server as a plug-in.
Data Recovery uses a virtual machine appliance to run backup operations and stores backup data within a store that utilizes data deduplication. The store can be on a storage area network (SAN), network attached storage (NAS), or Common Internet File System (CIFS)–based storage. Data Recovery supports Volume Shadow Copy Service (VSS) for Windows servers, including Windows 2008 and 2008 R2, to ensure that applications are properly quiesced to ensure consistent backups.
Before you begin to install Data Recovery, you should estimate the amount of storage your deduplication stores will require. Each Data Recovery appliance can have two stores each up to 1TB. The total storage you allocate depends on the number of virtual machines you plan to back up, the frequency of backups, and the length of time backups are stored. You should allocate additional free space, which Data Recovery requires for overhead items such as indexing and restore point processing. For initial setup, you should provide a store that is equal to the amount of used disk space within your virtual machines. If you plan to backup 50 virtual machines that all have 40GB virtual disks that are approximately 50 percent full, you should allocate approximately 1TB of storage for your deduplication store.
You’ll begin the installation process with the VMware Data Recovery plug-in. On a workstation where you have the vSphere client installed, insert the Data Recovery installation CD and start the installer for the Data Recovery plug-in. Once the installation is complete, you can start the vSphere client and log in to vCenter Server. You should see the VMware Data Recovery icon under Solutions and Applications on the Home page if you have successfully installed the plug-in.
The next step for the installation process is to add the Data Recovery appliance. This is supplied on the installation CD within the VMwareDataRecovery-ovf folder. The image is supplied in the Open Virtualization Format (OVF) format so you can select File > Deploy OVF Template to import the appliance into your vCenter infrastructure. The Data Recovery appliance needs access to port 902 on your ESXi hosts, so plan the network configuration for the appliances to allow that connectivity.
The storage you use for your backup data can be on network storage or virtual disks attached to the Data Recovery appliance. If you plan to use virtual disks, edit the setting for the appliance and add the disk. You can add up to two virtual disks no larger than 1TB each.
Once you have completed the installation steps, you are ready to configure the Data Recovery appliance and connect it to vCenter Server. To configure the Data Recovery appliance, use the following process:
Power on the virtual appliance and open a console session to it.
Log in to the appliance at the console screen as shown in Figure 6.27. The default credentials are
rootfor the username andvmw@refor the password.Once you have logged in, change the password for the root account with
passwd.Optionally you can configure the network settings for the appliance and set the time zone. The console also displays a URL that you can use to manage your appliance. You can log in at the URL to manage the network settings, change the time zone for the appliance, and reboot and shut down the appliance.
Start the vSphere client and connect to vCenter Server.
Select Home > Solutions and Applications > VMware Data Recovery.
Select the Data Recovery appliance, or enter the IP address or hostname for it, and click Connect.
Enter a set of credentials that are to be used to connect to vCenter Server for backup and restore operations.
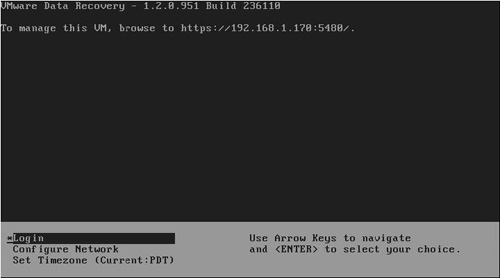
The Data Recovery appliance is now connected to vCenter Server and ready to perform backups.
Note
When you look in the vSphere client at the status of the Data Recovery appliance, it will indicate that it is not managed by vSphere. This does not indicate that you should install VMware Tools within the appliance. Rather, it indicates that the virtual machine is being managed by Data Recovery.
To set up a backup job, you can use the Getting Started Wizard link found on the Configuration tab, as shown in Figure 6.28. The wizard will guide you through the following steps:
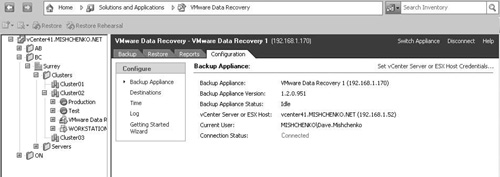
Enter the credentials that the appliance will use to connect to your vCenter Server host for backup operations.
Select a backup destination. If you configured a deduplication store virtual disk earlier, this storage is displayed. Click the Format link to prepare it for use with Data Recovery. You’ll also see links to Add Network Share and Mount. The Mount option is to attach a virtual disk that was previously used with Data Recovery but whose operation did not format the contents of the virtual disk. In place of virtual disk, you may also use Raw Device Mappings (RDMs).
The Configuration Complete screen shows a summary of your setup and gives you the option to create a new backup job. Check the Create a New Backup Job after Completion option and click Close.
The Backup Wizard starts. On the first screen, you can enter a job name and then click Next to continue.
On the Virtual Machines screen, you can select the virtual machines to include in the backup job. You can use the Virtual Machine Name Contains filter to search for specific virtual machines. Click Next to continue once you have selected the virtual machines that you want to back up as part of this job.
On the Destination screen, you can select a store to use for a backup file. You will have the same options on this screen as you did on the Backup Destination screen in step 2. Click Next to Continue.
On the Backup Window screen, edit the displayed schedule to set backup periods for your backup job. If a backup window is not sufficient to back up all virtual machines, those virtual machines will be given a higher priority in the next backup window. Once you have set your backup windows, click Next.
On the Retention Policy screen, specify the retention policy you want to employ. The retention policy determines how many backups to keep and how long to keep them. Older backups not protected by the retention policy are deleted to make room for new backups. You can select among the predefined policies of Few, More, or Many or create your own custom policy. For the predefined policies, the retention policy details are shown in the More Policy Details section of the screen. Click Next to proceed.
On the Ready to Complete screen, a summary of the backup job is shown. Click Finish to save the backup job.
Once you have created your backup job, you select the Backup tab to view the status of the job. On that tab, you can edit the job, create new backup jobs, and delete existing jobs. You can manually start a backup job by right-clicking on the job and selecting Backup Now. On the Configuration tab shown in Figure 6.28, you can review details for the Data Recovery appliance, manage backup stores, view the time configuration for the appliance, and review the backup log.
VMware Data Recovery supports restoring virtual machines and virtual disk files as well as individual files from Linux and Windows virtual machines. If you are restoring at the virtual machine level, you have the option to perform an actual restore of the virtual machine or you can run a rehearsal restore, which restores the backup data to another virtual machine to ensure that your backup data is consistent.
To perform a complete restore of a virtual machine, you begin by selecting the virtual machines to restore on the Restore tab of the Data Recovery screen. Then click the Restore link to begin the Virtual Machine Restore Wizard. The first screen of the wizard allows you to select the restore point to use. On the Destination Selection screen, you can change the virtual machine name; select the datastore to be used; and select a host, cluster, or resource pool in which the virtual machine will reside. You can also choose to power on the virtual machine after the restore is completed and whether the virtual network adapter for the virtual machine should be connected or disconnected. The Ready to Complete screen summarizes your restore options and displays how many virtual machines will either be created or overwritten. You can click Restore to begin the restore process. To monitor the progress of the restore job, select the Reports tab and view the Running Tasks report.
A rehearsal restore follows a process similar to the preceding one for restoring a virtual machine. To begin this process, you have to right-click on the virtual machine and select Restore to Most Recent Backup Rehearsal. The same Virtual Machine Restore Wizard runs, but in this case the virtual machine is automatically renamed, you have to select a datastore for the restore files, and the network adapter is set to be disconnected after the restore.
Restoring an entire virtual machine or disk file can be time consuming and cumbersome, and in some cases you may only need to recover a specific set of files. File Level Restore (FLR) provides a way to access individual files within a restore point for Linux and Windows virtual machines. With the FLR client, you can easily extract files from a backup and restore the files to the original or an alternative location.
The FLR client can be found on the Data Recovery installation CD. For the Linux client, you simply extract the TGZ file and execute the client. On Windows, you simply run the executable to start the client. Once the client has started, it can be run in one of two modes. In its regular mode, the FLR client connects to Data Recovery appliance and you can mount a restore point taken for the virtual machine on which you are running the client. If you check the Advanced option on the login screen, you can connect to vCenter Server to enumerate a list of virtual machines that have been backed up by the specific Data Recovery appliance.
After you have selected the mode to run the FLR client in, click Login to connect. You will then see a list of available restore points and virtual disks to use. If you have connected in Advanced mode, you can browse the navigation tree to find the virtual machine from which you want to restore files. Once you have selected the virtual disk to restore files from, click Mount. In Figure 6.29, the FLR client is running in regular mode on a Windows 7 virtual machine. A restore point has been selected and it is now mounted to the operating system at C:2010-05-03 02.00.01.
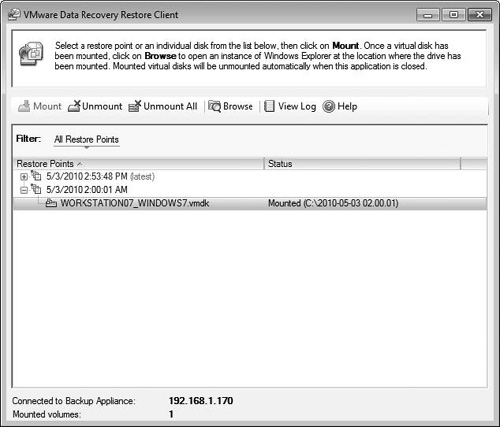
Once a restore point is mounted, you can use any operating system tool to access the files in the restore point. The tools that you use have only read-only access to the files in the mounted restore point. If you’re accessing restore points for another OS, your OS must be able to mount natively the file system that was used by that virtual machine.
Once you have completed restoring your files, you can click Unmount and then exit the FLR client. If necessary, you can mount multiple restore points and then click Unmount All to detach all the restore points that you have used.
VMware ESXi and vCenter Server provide a feature-rich and robust environment with which you can deploy your virtual infrastructure. ESXi and vCenter also provide a number of tools to help integrate your vSphere infrastructure into your management systems. ESXi can be easily configured to forward log data to a centralized syslog server, providing data for problem resolution and security analysis. Both products support SNMP traps and new to ESXi 4.1 is Active Directory Integration, which eliminates the need to use local accounts to manage your ESXi hosts directly.
vCenter Server provides powerful tools to manage your environment with alarms, performance charts, and storage views. Alarms can be configured to perform actions should certain events occur or be set to send alerts to other management systems. VMware Data Recovery is integrated into vCenter Server to provide a complete disk-based backup and recovery solution. The vCLI provides the ability to back up and restore the configuration of your ESXi hosts quickly. Leveraging the thin design of ESXi, hosts can be reinstalled and restored in a very short time.
VMware ESXi provides agentless monitoring via the implementation of CIM. Hardware vendors can augment the built-in hardware monitoring that ESXi includes by providing custom CIM providers for their specific hardware components. The health of your hardware can be monitored with vCenter Server and the vSphere client or any third-party management tool that supports CIM protocols.