
This chapter covers the next important administrative task—Monitoring. In this chapter, we will look at monitoring the complete technology stack of the Fusion Applications infrastructure and application components, including manual as well as automatic monitoring. You must first understand the relationship between the Fusion Applications monitoring and troubleshooting activities. It is important to note that Fusion Applications monitoring and troubleshooting activities are tightly coupled and you mainly need to use similar interfaces to perform both activities and most often troubleshooting is preceded and invoked by monitoring activities.
Although it is difficult to draw a clear line between monitoring and troubleshooting activities, we will see monitoring activities in this chapter followed by diagnosing and troubleshooting in the next chapter to explain each of them as an exclusive administrative task. The reason to explain them separately is that in large organizations there will be different teams dedicated to Enterprise monitoring. In general, monitoring is a proactive administrative task whereas diagnosing and troubleshooting are reactive.
Understanding the Role of Cloud Control
Enterprise Manager Cloud Control is not a new tool for Fusion Applications management but in earlier versions of Fusion Applications it was an optional tool. From the recent versions of Fusion Applications (11g, Release 9 onward) Oracle recommends you use Cloud Control as the primary management tool for complete Oracle Fusion Applications infrastructure. The other tools that come by default with Fusion Applications installation can still perform the same tasks similar to previous releases but you should focus more on using Cloud Control for the obvious benefits achieved through it. Most importantly, Cloud Control allows you to see more historical graphs as compared to the default Enterprise Manager tools like Fusion Application Control. For example, in Fusion Applications Control you can see the last 15 minutes of a job run in Enterprise scheduler service, but from Cloud Control you can see daily, weekly, monthly, or all the requests for which the monitoring information has not yet been purged from repository.
Before we discuss more about cloud control benefits or compare them with pre-installed tools like Fusion Applications Control, let’s look at the image shown in Figure 14-1.

Figure 14-1. Enterprise Manager Cloud Control versus default management tools
As you can see, the following three components are pre-installed and available by default in the Fusion Applications environment.
Enterprise Manager Database Control: This is the default Enterprise Manager that’s configured with Oracle database (unless explicitly unchecked during installation) and most DBAs have been using it quite extensively.
Enterprise Manager Fusion Middleware Control: This component is configured automatically with Identity Management and is accessible through the WebLogic domain administration server port. It is the default tool used by middleware administrators for Fusion middleware administration in Identity Management or any Fusion middleware environments.
Enterprise Manager Fusion Applications Control: The Fusion Applications Control is configured in the same way as the middleware control on the WebLogic domain of each product family and accessible through the administration port for the specific domain. It provides more capabilities as compared to the middleware control and we can monitor application deployments as well as WebLogic infrastructure components using the same interface. It includes individual homepages for the WebLogic domain, each WebLogic cluster, managed server, and the application deployments as well as the complete farm.
So if you look at Figure 14-1, before configuring EM Cloud Control, you need to use the EM Database control to manage the Identity Management and Fusion Applications transaction databases and the EM Fusion middleware control to monitor Identity Management Middleware components. At the same time for managing Fusion Applications Middleware and Application components, we have the EM Fusion Applications control as the default available tool. For each product family, a dedicated instance of Fusion Applications control is configured. As you can see, we need too many tools to manage this complex environment and we need to keep switching between tools in order to monitor or troubleshoot the issues.
This complexity can greatly be reduced by using Enterprise Manager Cloud Control to configure all of the components. This will allow you to monitor, manage, and troubleshoot each component involved in the Fusion Applications architecture from a single interface in a consolidated or component level drilled down view.
Installing and Configuring Cloud Control
Enterprise Manager Cloud Control is not installed or configured during Fusion Applications provisioning. In order to use it to manage the complete Fusion Applications environment, you need to install and configure EM Cloud Control separately on a different.
Note
You must license the Fusion Applications plugin separately since you need to configure this plugin in Cloud Control order to achieve Fusion Applications monitoring and management capabilities.
Figure 14-2 shows an overview of the steps required to install and configure Enterprise Manager Cloud Control with the Fusion Applications environment.

Figure 14-2. Deployment methodology for Cloud Control
This diagram assumes that you do not have EM Cloud Control already installed in your infrastructure. If you already have Cloud Control in your environment, then you can skip the Install step and its related tasks and proceed with the Deploy and Discover steps.
Installing Oracle Database for Cloud Control
In order to host an Enterprise Manager repository, we must install a blank database for EM. We are not going to discuss the database software installation steps here but we will see how we can efficiently create the database for using with Cloud Control. Oracle provides database templates for the latest version of Enterprise Manager Cloud Control so we can download them before creating the database and later use these templates to create the EM database with the repository related schemas preloaded. However, this is optional and you may want to create a regular database as well. In that case, the EM Cloud Control installer will create an EM repository on the blank database. In this example we will use the readily available EM database templates. You can download them from Oracle’s software delivery cloud from the same location where you download the Cloud Control installer.
Install the Oracle database software on the server first and make sure that the Create Database option is not selected since we will manually create the database next. Next, download the database template for the matching version of EM to be installed. Once the template ZIP file has been downloaded and extracted, the directory will look as follows.
[fusion@emhost ∼]$ ls -ltr ./EM12c/11.2.0.3_Database_Template_for_EM12_1_0_4_Linux_x64/
total 241053
-rwxrwxrwx 2 root root 237051904 May 24 2014 11.2.0.3_Database_Template_for_EM12_1_0_4.dfb
-rwxrwxrwx 2 root root9748480 May 24 2014 11.2.0.3_Database_Template_for_EM12_1_0_4.ctl
-rwxrwxrwx 2 root root46 May 24 2014 shpool_11.2.0.3_Database_SQL_for_EM12_1_0_4.sql
-rwxrwxrwx 2 root root 1878 May 24 2014 set_repo_param_11.2.0.3_Database_SQL_for_EM12_1_0_4_Small_deployment.sql
-rwxrwxrwx 2 root root 1989 May 24 2014 set_repo_param_11.2.0.3_Database_SQL_for_EM12_1_0_4_Medium_deployment.sql
-rwxrwxrwx 2 root root 1990 May 24 2014 set_repo_param_11.2.0.3_Database_SQL_for_EM12_1_0_4_Large_deployment.sql
-rwxrwxrwx 2 root root 5547 May 24 2014 11.2.0.3_Database_Template_for_EM12_1_0_4_Small_deployment.dbc
-rwxrwxrwx 2 root root 5548 May 24 2014 11.2.0.3_Database_Template_for_EM12_1_0_4_Medium_deployment.dbc
-rwxrwxrwx 2 root root 5551 May 24 2014 11.2.0.3_Database_Template_for_EM12_1_0_4_Large_deployment.dbc
Copy these files to the database home’s templates directory.
[fusion@emhost ∼]$ cp -pr ./EM12c/11.2.0.3_Database_Template_for_EM12_1_0_4_Linux_x64/* /app/database/product/11.2.0/dbhome_1/assistants/dbca/templates/
Now you can launch the database creation utility using the dbca command. Here we assume that the database software is already installed and environment variables including ORACLE_HOME and PATH are already set.
[fusion@emhost bin]$ dbca &
We will look at only the screens that are related to the database templates. As you can see in Figure 14-3, in the Database Templates selection screen, we will now see three additional options—Small, Medium, and Large for Enterprise Manager (12c, Release 4 in this case).

Figure 14-3. Selecting a database template with pre-configured EM respisotry
Small, Medium, and Large should be selected based on the size of the infrastructure to be monitored in your organization. Since EM Cloud Control can monitor non-Fusion or even non-Oracle systems as well, you may select from Small, Medium, or Large deployments that support up to 100, up to 1,000, or more than 1,000 agents, respectively.
Note
Be careful while selecting the deployment size here since during the Cloud Control installation you must specify the same deployment size.
The next important screen is the Enterprise Manager configuration shown in Figure 14-4. Since you are creating the database for Cloud Control, the native Enterprise Manager database control must be deselected.

Figure 14-4. Deselect the Configure Enterprise Manager option
The next and last important screen to notice is the custom scripts screen shown in Figure 14-5. The installer will automatically populate the post-database creation script details. It is crucial to leave this untouched since these scripts tune the database as per the required deployment size.

Figure 14-5. Run mandatory scripts
Installing Enterprise Manager Cloud Control
The next step is to install the Cloud Control 12c. Note that you can install the current latest release of EM Cloud Control. In this example, we will look at 12c, Release 4. We will look at only the important screens of the installation here.
Launch the installer by executing the runInstaller script. Proceed with the initial screens followed by the environment prerequisites checks. Once the prerequisites checks are successful, you will need to select the installation type, as shown in Figure 14-6.

Figure 14-6. Installation type selection screen
It is important to select the Advanced installation type here since we need to configure an additional plugin in the following screens. In the next screen, provide the location details for the installation and the hostname that will run the Cloud Control management services, as shown in Figure 14-7.

Figure 14-7. Cloud Control Installation Details screen
Note that Cloud Control installs its own middleware and WebLogic domains and you may see the Oracle Management Service (OMS) installed under the middleware home directory. The next screen shows the default mandatory plug-ins that are automatically selected for configuration with Cloud Control, as shown in Figure 14-8.

Figure 14-8. Select Oracle Fusion Applications Plug-Ins
We must select Oracle Fusion Applications in addition to the default selected ones shown in Figure 14-8. This is the reason we selected the Advanced installation in the beginning, since the Simple installation does not bring up this screen and goes with default plug-ins only. You need to make sure that you have appropriate licenses for Applications Management pack for Fusion Applications and the number of licenses must match the WebLogic Server domains in all Fusion Applications hosts being monitored.
Next you need to select the credentials for the WebLogic domain and Node Manager to be configured on EM host, as shown in Figure 14-9. You cannot change the default domain name (GCDomain) and the instance directory will be automatically populated in the same screen. Make a note of it for future administration purposes. In this example, it is /app/oracle/em/gc_inst based on earlier entered middleware and agent directory information. You will see that the paths still carry the old grid control (gc) prefix in the domain name and path values.
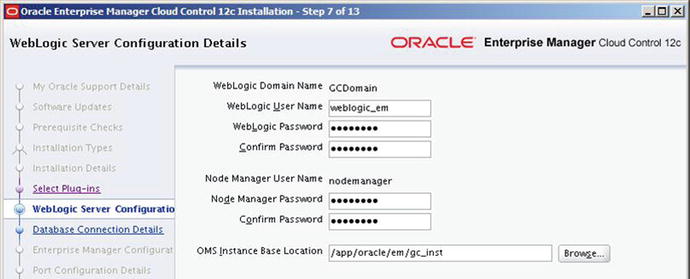
Figure 14-9. WebLogic Server Configuration Details screen
In the database connection details screen, you may enter the details of the database host where the EM repository database has been installed, as shown in Figure 14-10. Note that you need to select the same deployment size that you selected during the database template selection. If you have not installed the database using EM DÇATABASE templates, you may decide and choose the deployment size here.

Figure 14-10. Database Connection Details screen
We will now skip to the next important screen, which is the installation progress details screen, as shown in Figure 14-11. Although you need not make any changes in this screen, you may notice different steps and messages on this screen depending on whether you have installed a blank database or used the database templates with the EM repository included.

Figure 14-11. Installation Progress Details screen
If you look at the installation progress screen shown in Figure 14-11, you will notice that it is not creating the repository again since it has already detected that the database was created using the EM repository template. If you used a general-purpose database template then you may see a Repository Configuration message while in this case the task name changes to Repository Out of Box Configuration. You may also see a task called MDS Schema Configuration in the case of a blank database. Pre-configured databases skip this step. Once the installation is complete, proceed to the Installation Summary screen, as shown in Figure 14-12.

Figure 14-12. EM Cloud Control installation Summary
The post-installation summary screen shows the important URLs for accessing Cloud Control interface as well as the local WebLogic administration server URL for managing the services.
Starting Cloud Control Services
Once the installation is complete, Cloud Control services will be up and ready to be used. If you restart the server then use the following command to bring up the Oracle Management Service (OMS). Note that this also starts the WebLogic server and related managed servers. Make sure that the EM database is running before attempting to start OMS.
<MW_HOME>/oms/bin/emctl start oms
Where MW_HOME is the middleware home that you selected during the installation. For example:
/app/oracle/oem/middleware/oms/bin/emctl start oms
Configuring Fusion Applications with Cloud Control
Refer back to Figure 14-2. At this stage we have completed the first step of installing Cloud Control and in this section we will look at the next two steps—Deploy and Discover. Deploy involves installing or deploying Enterprise Manager agent in the hosts where the components to be monitored are running. The Discover step involves adding the Fusion Applications environment components to the list targets to be monitored.
Figure 14-13 shows a summary of tasks involved in the Deploy and Discover stages.

Figure 14-13. Configuring the Fusion Applications environment with Cloud Control
As you can see in Figure 14-3, we will begin by adding host targets (task 1) to the Cloud Control in order to deploy EM agent on these hosts. This will be followed by adding or discovering both the IDM and FA database instances (task 2). Later we will add the IDM middleware components (task 3) followed by Fusion Applications instance (task 4). Since BI-related components are not automatically detected as part of the Fusion Applications instance discovery, we will add those later (task 5). At the end, we will associate all these components with Fusion Applications instance in order to manage them as single group (task 6). Let’s look at these tasks in the mentioned order, starting with the agent deployment.
Deploying Agent on Hosts
Since this chapter is dedicated to Fusion Applications monitoring, we will only look at those functionalities of Cloud Control that are required to set up the monitoring consoles. In order to deploy the agents on the hosts to be monitored, we will add all the hosts in our Fusion Applications environment in Cloud Control.
Click on the Setup menu in the Global area and then choose the Add Target ➤ Add Targets Manually menu item. This will open the Add Host Targets screen, as shown in Figure 14-14.

Figure 14-14. Add Host Targets
Here we have three options to choose from. For adding the host we will select the first option called Add Host Targets. Once you click the Add Host button, it will launch the Host Details screen, as shown in Figure 14-15.

Figure 14-15. Adding host details
Add all the hosts to your selected topologies where Identity Management or Fusion Applications components are configured to run. Also specify the operating system for each host. We added two hosts in this example with the Linux x86-64 platform. You can choose Same for All Hosts from the combo box above this table in order to avoid specifying the same platform again for each host. Next it displays the agent installation details screen, as shown in Figure 14-16.

Figure 14-16. Agent installation details
It is recommended to keep local file system path for agent installation and instance directories. Enter the credentials to log in to the host in order to install the agent. Although it requires you to enter any user with root or sudo privileges, you may specify a regular user as well. in the next screens, we will see the impact of the same and a workaround as well. The default port for agent is 3872 and you can change this if required. Make sure that network firewall rule to allow this port from OMS server to this host is created. Once you click Next, the next screen will display the summary, as shown in Figure 14-17.

Figure 14-17. Add Hosts Targets Summary screen
Make sure that the OMS upload port (default value 4900) from the host where the agent is being installed to the OMS server is also allowed in the network firewall. Review the host details and click Deploy Agent to proceed.
The agent installation is completed in three steps for each host, namely initialization, remote prerequisite check, and agent deployment, as shown in Figure 14-18. Each phase must complete on each host before the next phase starts.

Figure 14-18. Post-deployment summary
If you have chosen to use a non-root privilege user for installation then you may see warning messages in between related to the user privileges. You may ignore them. But once the agent deployment is complete, it may prompt you to run the root.sh script from the following location.
<EMAgent_Home>/core/12.1.0.4.0/root.sh
This concludes the Deploy phase from the list of phases that we have seen in Figure 14-2. We will now move on to the Discover phase. Note that we can use Auto Discovery option to discover all the configured services on each host automatically but since Fusion Applications is a complex environment and quite less prone to frequent infrastructure changes, it is strongly recommended by Oracle that you use manual discovery for Fusion Applications components.
Adding Databases and Listeners
We must add Identity Management as well as the Fusion Applications transaction database in Cloud Control in order to monitor both using a single interface. Let’s add the Identity Management database and listener first. Navigate to Setup ➤ Add Target ➤ Add Targets Manually to launch the same screen that we used for adding hosts, as shown in Figure 14-19.

Figure 14-19. Adding the database and listener manaully
Select Add Targets Using Guided Process and then select Oracle database, listener, and automatic storage management from the list of target types in this screen, as shown in Figure 14-19. The next screen will require only a hostname, where the database and listener need to be discovered. Specify the IDM database hostname in the next screen and click Next. The wizard will initiate the target discovery process and eventually list the detected database (idmdb) and listener on the specified host, as shown in Figure 14-20.

Figure 14-20. IDM database discovery
Select listener as well as database in this screen, enter the password for the dbsnmp user, and then click Next. The last screen will display the summary of targets being added. Review the summary and click Save to add the IDM database and listener.
Perform the same steps for the Fusion Applications transaction database (fusiondb) as well. Figure 14-21 shows the similar screen for the Fusion Applications database. The steps remain the same.

Figure 14-21. Fusion Applications transaction database discovery
Adding Identity Management Fusion Middleware Components
The next discovery phase task is to add a complete IDM middleware stack. Note that Fusion Middleware/WebLogic domain and Fusion Applications instances are specialized components that can be discovered using dedicated discovery methods instead of going through the method that you followed for hosts or databases. However, both of these methods work just fine.
From any page of Cloud Control, choose Targets ➤ Middleware in the Global area menu. This will open the Fusion Middleware Summary page shown in Figure 14-22. We will look at this screen in detail once we have discovered all the required components.

Figure 14-22. Add an Oracle Fusion middleware target
Choose Add ➤ Oracle Fusion Middleware/WebLogic domain menu item from the top of the page to add a new middleware target using dedicated discovery process. This will bring up the Fusion middleware details input screen, as shown in Figure 14-23.

Figure 14-23. Oracle WebLogic domain and Agent Details screen
The Fusion middleware target addition screen requires the following inputs:
WebLogic Domain Details
Administration Server Host: Enter the hostname of the server that contains the IDM domain administration server.
Administration Server Port: Enter the Administration Server port. The default value is 7001.
WebLogic Administration Username and Password: Enter the credentials for the IDM domain administration user. The IDM provisioning process has a default username as weblogic_idm.
Unique Domain Identifier: Enter any unique name to identify this target in the list of middleware targets in the future. IDM_1 is an appropriate identifier.
Existing EM Agent Details
Agent: Enter the agent details in the <hostname>:<agent port> format. For example, idmhost.paramlabs.com:3872.
Once these details are entered, click Continue to discover the middleware targets associated with the IDM domain. This will detect all IDM components including HTTP server, directory services, and WebLogic server domain and related managed servers/clusters.
Once the targets discovery is complete, it will display the summary of all targets that are found for the Identity Management environment, as shown in Figure 14-24. Approximately 55 to 65 targets are discovered in this process.
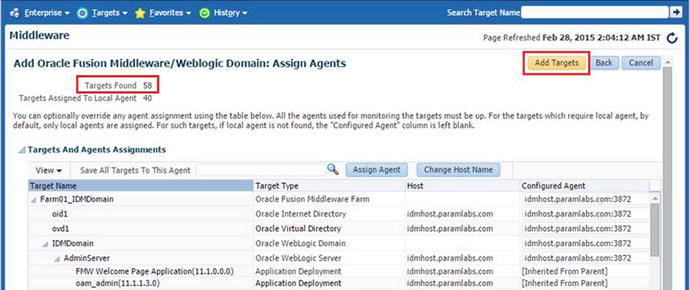
Figure 14-24. Middleware targets discovery summary
Review the summary, modify the agent or host details if required, and click Add Targets to save these targets in Cloud Control. This concludes the Identity Management middleware discovery step.
Run Diagnostic Pre-Checks for Fusion Applications
The last step in the discovery process is adding a Fusion Applications Instance. This includes all Fusion Applications product families, the corresponding WebLogic domains, and HTTP Server. Before we proceed with the Fusion Applications instance discovery, we must run diagnostic pre-checks to make sure that the targets discovery and addition will be smooth later. This is optional but highly recommended in order to prevent partial completion of the Fusion Applications instance discovery.
Launch the Fusion Applications Target Management Best Practices page by navigating to the Targets ➤ Fusion Applications ➤ Fusion Applications Features ➤ Target Management Best Practices menu link, as shown in Figure 14-25.

Figure 14-25. Invoking the Fusion Applications diagnostic pre-chceks
On the Target Management Best Practices page, click on the Run Diagnostic Pre-Checks button to launch the diagnostic tests. In the next screen, you will be prompted to enter the administration server details. Make sure to enter the Fusion setup WebLogic server domain CommonDomain details in the screen and it will automatically populate the complete infrastructure details through the same. Figure 14-26 shows an example result of the diagnostic pre-checks.
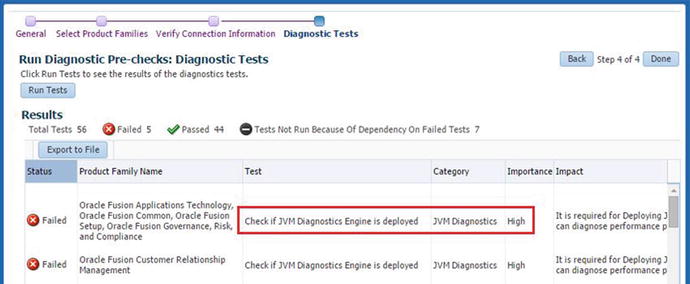
Figure 14-26. Running diagnostics pre-checks
As you can see, it suggests that you check if JVM diagnostics engine is deployed. Since the importance level for this test is high, we must fix this before proceeding with the Fusion Applications instance discovery. Since the JVM diagnostics engine is required to diagnose JVM related performance issues and as an Administrator you may use this functionality often, we will deploy it on the OMS server. As shown in Figure 14-27, navigate to Setup ➤ Middleware Management ➤ Application Performance Management first.

Figure 14-27. Launching JVM diagnistics engine deployment page
On the Application Performance Management page, choose the Add ➤ JVM Diagnostics Engine menu item to initiate the deployment process. As you can see in Figure 14-28, in the next screen you need to enter the host credential for the OMS Server as well as the WebLogic administration user credentials for the Cloud Control domain that you selected during installation in Figure 14-9.

Figure 14-28. Deploying the JVM diagnostics engine
The screen displays the managed server name that will be created (the default name is EMGC_JVMDMANAGER1) as well as the listen ports that will be configured for this managed server. Click the Deploy button to create the new managed server and start the deployment of the JVM diagnostics engine. Now the screen will now display a link pointing to the deployment job in Cloud Control and you can monitor the status of the deployment job until it completes successfully. Figure 14-29 shows the successful deployment of the JVM diagnostics engine on the OMS server.

Figure 14-29. JVM diagnostics engine deployment status
Now you need to run the diagnostics pre-checks once again to make sure there are no errors with high importance. Figure 14-30 shows the result of the tests upon rerun.
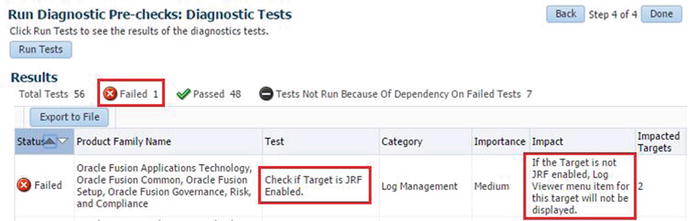
Figure 14-30. Diagnostics pre-check results
As you can see now we have only one failed test which is of medium importance. This particular error is related to enabling the JRF on targets to allow the log viewer functionality. You might not want to fix it at this moment. Click Done to finish the diagnostics tests and proceed to the Fusion applications instance discovery using Cloud Control.
Adding Fusion Applications Instance
You should now be able to add the Fusion Applications instance and all related components in Enterprise Manager Cloud Control. As mentioned earlier, you must have the Fusion Applications Application management pack (plugin) installed in order to manage Fusion Applications components using Cloud Control. If you have Fusion Applications plugin deployed in Cloud Control then you will see additional link called Fusion Applications under the Targets menu in the Global area, as shown in Figure 14-31.

Figure 14-31. Navigating to the Add Fusion Applications instance screen
Tip
If you missed adding this plug-in earlier, you can install it using the Setup ➤ Extensibility ➤ Plugins page. Choose Deploy On ➤ Management Servers and then select Add ➤ Fusion Applications on the next page to deploy the applications management pack for Fusion Applications.
Choose Targets ➤ Fusion Applications to navigate to the Fusion Applications instance summary screen. Now choose Add ➤ Fusion instance, as shown in Figure 14-31, to start the instance discovery process. The first screen for adding a Fusion Applications instance requires you to enter the details of Administration Server of CommonDomain, as shown in Figure 14-32. This is because it can detect the complete topology of your Fusion Applications instance by connecting to the CommonDomain and then discover each product family and its corresponding WebLogic domains.

Figure 14-32. Specify Common Domain Admin Server details
Assign a unique identifier for the Fusion Applications instance to be added. If you are planning to monitor multiple Fusion Applications instances later, make sure to use an appropriate naming convention. Once you click Next it will discover all the product families in your Fusion Applications environment and show the list for your review. At the same time it also detects the already configured Fusion Applications transaction database and associates it with the instance being added. Click Next again to confirm or modify the details of each product domain as well as the assigned EM agents on the respective hosts, as shown in Figure 14-33.

Figure 14-33. Newly discovered Fusion Applications product families
Ideally you will not need to make any changes in this screen unless the port details of the product family domain administration servers are not correct or the agent port information has changed. Review the details and click Next to start the target discovery process. It will display a pop-up screen with the target discovery status. Once the targets for each product family domain are discovered, review the generated list and click Next to save the details in Cloud Control. The final screen will show you a summary of all added targets for each product family, as shown in Figure 14-34.

Figure 14-34. Add Fusion instance completion summary
Add Business Intelligence Components
Note that adding Fusion Applications instance discovers all product family domains except the Oracle Business Intelligence domain. Hence we must manually discover and add the BI domain in Cloud Control. The procedure to add the BI domain is similar to what we followed for the IDM domain. Choose Targets ➤ Middleware ➤ Add ➤ Oracle Fusion Middleware/WebLogic Domain to start the BI domain discovery. Make sure to provide the BI domain administration server host and port details, as shown in Figure 14-35, to start the BI domain discovery. Assign a unique identifier to easily locate this domain for future management.

Figure 14-35. Discover BI WebLogic domain
Associate All Fusion Applications and Identity Management Targets
At this stage all the required components in the Fusion Applications environment are discovered and registered with EM Cloud Control. In order to manage all Identity Management, BI components, and Fusion Applications product domains as a single group, we should associate the BI WebLogic domain as well as the IDM domain with the Fusion instance.
In order to create associations, open the Fusion instance homepage by choosing Targets ➤ Fusion Applications ➤ <Fusion instance name>. Now choose the menu Fusion Instance ➤ Additional Associations to open list of existing associations, as shown in Figure 14-36. Initially this list will be empty so click on Create ➤ Oracle WebLogic Domain for Oracle Business Intelligences to integrate the BI domain. The next screen will show the existing BI domain target. Select it to complete the association.

Figure 14-36. Associate the BI WebLogic domain with the Fusion instance
Repeat this same process for Associating Identity Management middleware with the Fusion instance. In this case you need to choose Create ➤ Oracle WebLogic Domain for Oracle Identity Manager instead, as shown in Figure 14-37. The next screen will display the IDM domain target. Select it to associate the Identity Management domain with the Fusion instance.

Figure 14-37. Associate the IDM WebLogic domain with the Fusion instance
This concludes the configuration of Fusion Applications with Cloud Control and we will move on to monitoring activities.
Monitoring the Fusion Applications Environment
In this section, we will look at monitoring of the complete technology stack and application components of Fusion Applications environment. We will look at the Cloud Control interface only for monitoring activities, which is the recommended method by Oracle. However, most of the monitoring activities can be done through the default management interfaces like Fusion Applications control or Fusion middleware control but it becomes cumbersome to monitor the environment by keeping a number of consoles open at the same time. We will also see how we can navigate to homepages that are very similar to the Fusion Applications Control as well as Fusion middleware control for each product family from Cloud Control.
Oracle’s new generation of applications as well as Enterprise Manager work on the principles of management by exception, which means while monitoring you are more interested in knowing the exception conditions instead of those components that are working as expected. So the focus is always on the exception conditions, including unavailability, performance issues, and so on. This also instantaneously allows you to initiate troubleshooting and diagnosing activities right from the monitoring dashboards.
Understanding the Fusion Applications Product Family Homepage
Before we navigate to the monitoring dashboards, let’s understand the various homepages in Cloud Control. Each of these represent one aspect of Fusion Applications monitoring. These homepages are enormously useful, especially for troubleshooting application performance issues. Since most of the time troubleshooting is invoked or preceded by monitoring, it remains equally useful while proactively identifying any underlying issues with the environment. The following are the main dimensions of monitoring Fusion Applications environment. The first three homepages are related to Fusion Applications while the remaining ones are related to Fusion middleware.
Product Family
Product
Application Deployment
Fusion Middleware for the Product Family
WebLogic Server Cluster or Managed Server
The Fusion Applications Summary screen has two major sections. The top section shows the summary inventory of each component being monitored along with the version-based grouping of the components. The second main section of the screen displays the Fusion Applications product families in a tree structure with the Fusion instance as the root node. If you have more than one instance being monitored then you will see a similar collapsible tree for each instance. As you can see in Figure 14-38, the three highlighted product families belong to the same domain (CommonDomain), so the number of product families may not necessarily match the number of WebLogic servers for the applications instance. Clicking on any product family name will bring up the specific product family’s Cloud Control homepage.

Figure 14-38. Fusion Applications Summary screen
Since the product family homepage contains various sections and the layout is customizable as well, let’s see a simplified generic view of a product family homepage, which is shown in Figure 14-39.

Figure 14-39. Generic view of Fusion Applications product family homepage
The product family homepage looks very similar to the Fusion Applications control homepage, as it is intended to perform the identical function of a product family’s EM Fusion Applications control. As you can see in Figure 14-39, this homepage contains a multi-column view that can be personalized to two columns, three columns, or any other layout based on your requirements. We will discuss personalization in the next section. Figure 14-39 shows some of the default regions in this homepage but depending on your personalization you may have more or fewer sections. Let’s explore the default sections in this page.
Fusion Applications and Middleware Availability Pie Charts
This is the first region that you will notice in this page. It provides a quick summary of the number of components that are down or having issues at the moment. As you know, Fusion Applications monitoring works on principles of management by exception, so that you always know which components are down or unavailable at any point in time. This region contains two pie charts—Fusion Applications and Fusion middleware charts. The Fusion Applications chart displays the availability of application deployments and the second chart shows the availability of underlying WebLogic servers. Both of these pie charts should show up green, which means all components are up and running. In case you see any red areas in the chart, you may immediately want to navigate to the related homepage and bring those components up or troubleshoot the issues.
Monitoring and Diagnosing
While these pie charts display the availability of components at any given time, the Monitoring and Diagnosing section contains the number of recent critical errors or warnings that are marked as incidents. This gives you an indication that an issue requires your attention. You can drill down to the incidents and troubleshoot if the issue still persists or if it was historical one.
Products and Topology
This region lists all the products in this particular product family on the left while mapping them with applications deployments on the right side. This shows a many-to-many relationship. This helps you in locating and navigating to the related clusters for a particular product functionality and troubleshoot issues with the underlying technology stack.
Recently Completed Jobs
By default, the product family homepage contains a list of recently completed jobs for that particular product family, which are generally executed through the corresponding Enterprise Scheduler of this product family. You can personalize the homepage to add more detailed sections like top running or waiting jobs for a further level of monitoring. These sections are by default available for individual product homepages, which is discussed in next section.
Key Performance Indicators
This is one of the most important sections of the product family homepage. This section contains a number of graphs related to predefined metrics. You can also switch between graph or table format. It allows you to add, delete, or move the graphs based on your monitoring priorities. In order to change the metrics being displayed, you can click on the Actions icon at the corner of the KPI region and select Show Metric Palette. The Metric Palette will allow you to choose which Fusion products you want to monitor and which metric for that product should be shown as a graph.
You can see detailed and historic KPI graphs by choosing Product Family menu ➤. Monitoring ➤ Key Performance Indicators. Here you can also select the time period for which you need the data to be displayed. We can initiate troubleshooting from this graph by clicking certain KPIs followed by Problem Analysis link. We will look at troubleshooting in detail in the next chapter.
Related Targets
This area lists the summary of related targets like the Fusion Applications transaction database along with the database JDBC URL. It also allows you to navigate directly to the database monitoring home.
Recently Completed SOA Instances
This section lists all the related SOA composites along with the number of completed executions of each SOA composite in the last 24 hours along with the response time in milliseconds.
Target Navigation
The Regional area of the Fusion Applications related pages in Cloud Control contains the list of all available targets of the selected Fusion Applications product family. The Target navigation region allows you to navigate between various homepages, including Fusion Applications and middleware components. Figure 14-40 shows the breakup of the target navigation region in Cloud Control.

Figure 14-40. Target navigation region
As you can see in Figure 14-40, the Target Navigation panel contains two major sections. Note that these targets correspond to the selected product family only, not to the entire Fusion instance.
Fusion Applications Targets
Products
Applications Deployments
Fusion Middleware Targets
Clicking on a target from any of these sections will lead to the corresponding homepage. For example, clicking on Absence Management Product in the HCM product family will open the homepage for Absence Management Product. Similarly, clicking on the HCM domain middleware target name will launch Fusion Middleware Homepage for HCM. You will notice that the middleware homepage contains the same hierarchy as the classic Fusion middleware control homepage.
Fusion Applications Product Homepage
Now let’s look at the Fusion Applications product homepage. This page is launched by clicking on the name of product from target navigation in the Regional area. This page contains more specific panels for monitoring a particular product availability and performance. Similar to the product family homepage, this also can be personalized to add or remove the panels based on your monitoring priorities.
Let’s look at some of the key distinctions in this screen as compared to the product family homepage. Figure 14-41 shows the various regions in a generic Fusion Applications product homepage.

Figure 14-41. Fusion Applications individual product home in EM
You will notice that the topology section now contains a one-to-many relationship since on left side you see only the selected product. On the right side is the list of deployed applications that implement functionalities of the selected product along with the managed server name where the application has been deployed.
The default layout also includes availability and incidents details for each application included in the topology region as well as for each WebLogic cluster that hosts these applications. The benefit of these regions is that if you have issues with a specific functionality of the product, you can easily drill down to the managed server level and reduce the time required to troubleshoot.
Similar to the product family home, you can personalize the page layout for the product home as well. Once you click on the Personalize icon at the top, the page will offer various customization options, including changing the layout to one, two, or three columns. You can add or remove regions by clicking on the Add Content button, which will bring up the screen shown in Figure 14-42. You can select from the list of predefined regions based on your monitoring priority. For example, the default page offers a list of recently completed jobs but you may also want to see the top long running jobs as well.

Figure 14-42. Change product family EM home Layout
Monitoring Fusion Middleware
In the previous section we looked at product family monitoring as well as product monitoring homepages, both of which are related to Applications monitoring. If you look at the Targets Navigation panel, you will notice the corresponding middleware target name in the lower section of the panel. If you look the targets tree closely from this node onward, then you will notice that this section matches the Fusion middleware control. So we can manage the Fusion middleware components related to this product family domain by navigating through these targets.
We can navigate to the Fusion middleware monitoring home either via any of the Fusion Applications homepages or directly using Cloud Control’s middleware dashboard. The benefit of the middleware dashboard in Cloud Control is that you will get a consolidated summary of inventory and availability of all Fusion middleware domains in the environment. Click on Targets ➤ Middleware in any screen to launch the middleware summary page in Cloud Control, as shown in Figure 14-43.

Figure 14-43. Fusion middleware summary screen
The Middleware summary page has two major sections—Summary and Middleware Targets Details.
Summary
Target Type: This section shows a summary inventory of different Fusion middleware components registered with Cloud Control in the form of a pie chart. Clicking on any component name will filter the results in a details section to list only components with the selected type. This allows you to quickly check the status of a particular middleware component in all domains.
Status: This is very important summary pie chart that provides a quick summary of all middleware components grouped by their availability status. For example, you can click on the Down link to list only those components that are currently down or unavailable in the details section.
Middleware Details: By default this section lists all the Fusion middleware farms, If you click on one, it will open the respective middleware homepage identical to Fusion middleware control. The data in the details section is populated based on the selection in the summary section and mainly used for navigating to other homepages.
Figure 14-44 shows an example of the IDM domain middleware farm homepage. We chose IDM middleware specifically so that you can visually compare the same screen of Identity Management Domain’s EM Fusion middleware control homepage. The homepage shows the availability charts of the WebLogic clusters and managed servers along with the availability of application deployments on each of these clusters.
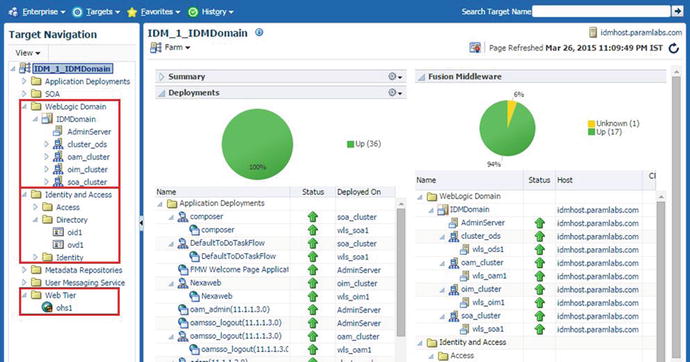
Figure 14-44. Identity Management middleware farm home screen
As you can see, you can monitor directory servers and web servers using this interface as they are already registered under the middleware farm. The same applies to Fusion Applications as well where you can monitor the HTTP server using the CommonDomain middleware homepage. You may navigate to any sub-sections of IDM middleware targets tree including WebLogic domain, Identity and Access, and Web Tier to monitor and troubleshoot issues specific to those components. As you saw in Chapter 12, you can start or stop individual managed servers or complete WebLogic domains using the actions menu on the top of each component’s homepage.
If you are accessing the Fusion Applications middleware homepage then you may see additional Target group called Scheduling services which will open Oracle Enterprise Scheduler homepage for the product family from where it was invoked. We will look at this in next section. Note that web tier for Fusion Applications is only available through the CommonDomain homepage and not from any other product family homepage.
Monitoring Enterprise Scheduler
Monitoring Enterprise Scheduler is one of the most common tasks for every Fusion Applications Administrator as we constantly need to monitor the performance, pending jobs, and errors related to Scheduler services, which run most of the day-to-day critical reports. As we have seen earlier, Enterprise Scheduler replaces the Concurrent Manager of the Oracle E-Business Suite. If you were managing an EBS instance earlier, all those activities you performed on the Concurrent Manager apply to the Enterprise Scheduler. Each product family domain has a dedicated ESS (Enterprise Scheduler Service) managed server where the ESS application runs. You can launch the Scheduler Service homepage from the respective product family middleware Cloud Control home by expanding Scheduler Services under the middleware farm followed by the ESS cluster name. Figure 14-45 shows an example of Scheduler Service homepage.
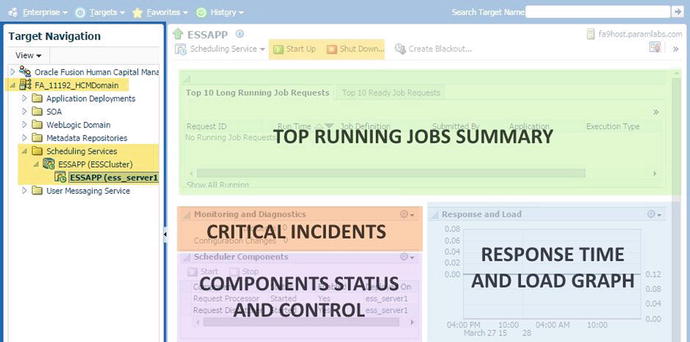
Figure 14-45. Enterprise Scheduler Service homepage
As you can see, this page displays regions that are specific for the ESS components and jobs related to the selected product family. The main regions of importance are top running jobs, response time and load graph, availability status of ESS components, and details of recent critical incidents related to this instance of Enterprise Scheduler. You may also start up or shut down this specific ESS service using this screen.
By looking at the response time and load graph you may easily infer if there are any performance issues with ESS. In that case you can launch the more detailed Performance Summary by choosing Scheduling Service ➤ Performance ➤ Service Summary. Figure 14-46 shows example of the Performance Summary page for ESS. Note that this screen is available for each application and middleware component by navigating to Component Menu ➤ Monitoring ➤ Performance Summary so this example applies to all other components as well.

Figure 14-46. Enterprise Scheduler Performance Summary
The Performance Summary page for ESS displays default important metrics like the number of running requests, completed requests in the last hour, processing time, and so on. You can choose the time window for which you need the graph to be scaled. You can also choose different metrics by clicking on the Metric Palette.
Since troubleshooting is pretty much dependent on monitoring, we will continue to look at different aspects of Fusion Applications and Fusion Middleware monitoring in the next chapter as well. Let’s move on to database monitoring through Cloud Control.
Monitoring a Database
Cloud Control provides all the functionalities provided by the EM database control in addition to a number of personalization options. The Database Administrators or Enterprise Monitoring team can keep the database consoles open to continuously monitor the database as well as database host performance, including currently running SQLs, jobs, and so on, in single dashboard. Since the Enterprise Manager Cloud Control manages all layers of Fusion Applications environment, you can easily navigate between database, application, directory, or web tiers to monitor and troubleshoot any spikes identified during day-to-day monitoring.
In order to view the Databases homepage in Cloud Control, navigate to Targets ➤ Databases. This page will display summary of all databases configured with Cloud Control, including IDM and FA transaction databases. It lists a summary of recent incidents, a database load map based on active sessions, top ADDM findings, recent jobs run status, and availability information of each database. This dashboards list both IDM and FA database status and availability details. You can click on any of these database names in order to manage or monitor them. Clicking on the database will open the Database homepage shown in Figure 14-47. You can relate this page to the EM database control home with enhanced navigation to most important functionalities directly from the menu in the top region.

Figure 14-47. Single Database home screen
As shown in Figure 14-47, the Database homepage shows all the important regions that an administrator may be interested in, including a performance graph, host resources, active sessions, SQL monitoring, currently running jobs, and more. In addition to this it shows the summary of database including uptime, average number of active sessions, available free space, and so on, which may help you to take proactive steps. If you are keeping this console open for monitoring then it is recommended to turn on Auto Refresh in order to view the latest performance data. Use the Personalize Page icon to add or remove regions, change layout, and so on. This will bring up a similar screen in Figure 14-42 that you saw earlier.
Configuring Common Monitoring Features
In this section we will look at how to use some common features like e-mail notifications and blackouts for monitoring the Fusion Applications environment using Cloud Control. These features apply to Cloud Control in general and are not specifically related to Fusion Applications, so if you have an existing Cloud Control set up then you may already have these properties set.
Setting Up Notifications
In order to receive e-mail alerts you must configure the outgoing mail server for Cloud Control as a primary prerequisite. Make sure that access to the SMTP port of your mail server from Cloud Control Server is allowed through the firewall. In addition to this the mail server itself, allow your Cloud Control server to relay e-mails internally. To set the SMTP server, choose Setup ➤ Notifications ➤ Notification Methods, as shown in Figure 14-48, to open Notification Mail Server Setup screen.

Figure 14-48. Setting up notifications: mail server setup
Provide the details of the outgoing mail server, sender e-mail, SMTP server credentials, and so on and then click Test Mail Servers to make sure that the Details are correct and there is no blocking from the firewall or the mail server side.
Setting Up Administrator E-Mail Preferences
In the previous section, you saw how to set up outgoing e-mails and the sender details. Now you must configure the receiver e-mail address in order to make sure that the administrators can receive e-mail alerts. You can either configure the default administrator’s e-mail address or create additional administrators for each target group and assign e-mail addresses to them. Figure 14-49 shows an example of setting up the default administrator’s e-mail address for complete Cloud Control. This e-mail could be a generic e-mail account, individual e-mail account, or a group e-mail address (distribution list) for sending notifications to the monitoring team.
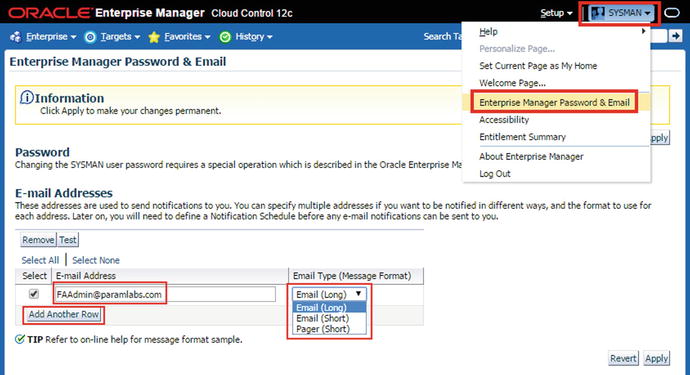
Figure 14-49. Setting up administrator e-mail preferences
In addition to an e-mail address, you can also select the default E-mail message type from the predefined types—long/short e-mail or pager message. Cloud Control has specific guidelines for these e-mail types and depending on the preference, for example, long e-mail format contains detailed HTML message with URLs, while the short e-mail and pager options limit the e-mail content to short limited characters with short text summary only.
Note
Enterprise Manager 12c Cloud Control has multiple tiers of configurations in order to receive granular notifications and avoid duplicate alerts. You must set up metric thresholds appropriately as well as create incident rules and rule sets to define when a notification should be sent.
Using EM Blackouts
Enterprise Manager receives target status updates from the EM agent installed on the hosts. So whenever you shut down or bounce any components, the agent will update the Cloud Control about temporary unavailability of targets. This creates inaccuracy in Cloud Control statistics since the scheduled maintenance is actually not an incident and this duration should be excluded from Cloud Control statistics. In order to achieve this you must create a blackout before any scheduled downtime of components. You can create a blackout at any level, including complete Fusion Instance, specific product family, product, or even a specific managed server. You can also schedule agent blackouts in advance for planned maintenance in the future to save time during actual downtime.
Cloud Control provides a large number of predefined blackout reasons for reporting purposes, but you can also create your own custom reasons based on organizational requirements. In order to create a custom reason, choose Monitoring ➤ Blackouts from any target’s action menu. Click on the Manage Reasons link at the bottom of the Blackouts homepage. This will bring up Manage Reasons screen, as shown in Figure 14-50. Click Add Another Row followed by New Reason Title and click OK to save the new reason. In the example shown here, we have selected disaster recovery test as a reason since it is not in the predefined list of blackout reasons.

Figure 14-50. Managing blackout reasons
At times you may need to take an urgent downtime and may not have time to create an EM blackout or you may have forgotten to create one and then the retroactive blackout feature comes to the rescue. This feature allows you to create a blackout using a past date and duration to ignore the EM statistics for the selected target for the selected duration. By default, this feature is not enabled and we must enable it using the Retroactive Blackout Configuration link on the Blackouts homepage, as shown in Figure 14-51.

Figure 14-51. Enabling the Retroactive Blackout feature
Finally let’s see how to create a blackout for a target or set of targets. You need to create a blackout before shutting down a target and end the same blackout after starting up the targets. Depending on the target that you are shutting down, choose Target Menu ➤ Control ➤ Create Blackout to start a new Blackout wizard, as shown in Figure 14-52.
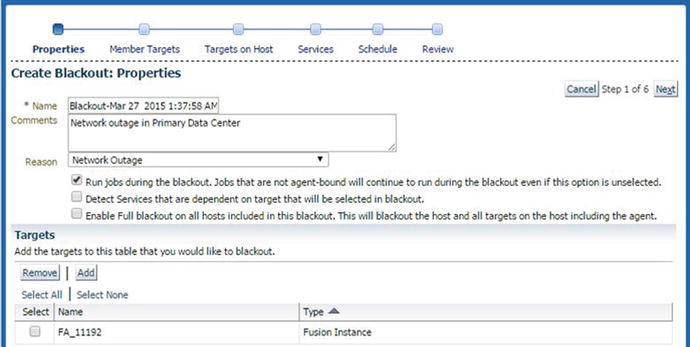
Figure 14-52. Creating an EM blackout
If you select the Reasons Are Required for a Blackout option then you must select Reason in this screen. Otherwise, it is recommended that you select an appropriate reason for reporting purposes. Make sure to end this blackout using the Control ➤ End Blackout link to make sure the EM data collection resumes for the selected target.
Summary
In this chapter you saw how to set up Oracle Enterprise Manager Cloud Control in order to effectively monitor and manage the Fusion Applications environment using a single unified interface. Later you saw how to monitor various components of Fusion Applications including Identity Management infrastructure, application components, web tiers, and databases. You also saw how Cloud Control compares to the traditional Enterprise Manager tools available with Fusion Applications and how you can leverage additional features of Cloud Control to replace the default tools with a single monitoring window. It is recommended you learn more about Cloud Control features in order to best utilize its advanced capabilities.
This chapter provided a platform for the upcoming troubleshooting and diagnosing administration activities. In the upcoming chapters, you will learn how to utilize the monitoring outcomes and alerts to troubleshoot issues with every layer of the Fusion Applications environment.