Beginners to machine learning are often confused with the plethora of algorithms and techniques being taught in subjects like statistical learning, data mining, artificial intelligence, soft computing, and data science. Naturally they end up asking, how these subjects are different and which is best for solving real-world problems? There is substantial overlap in these subjects and it's hard to draw a clear Venn diagram explaining the differences. Primarily, the foundation for these subjects is derived from probability and statistics. Machine learning played a pivotal role in transforming statistics into a more accessible subject by showing the applications to the real-world problems. However, many statisticians probably won't agree with machine learning giving life to statistics, giving rise to the never-ending chicken and egg conundrum kind of discussions. Fundamentally, without spending much effort in understanding the pros and cons of this discussion, it’s wise to believe that the power of statistics needed a pipeline to flow across different industries with some challenging problems to be solved and machine learning simply established that high-speed and friction-less pipeline . The other subjects that evolved from statistics and machine learning are simply trying to broaden the scope of these two subjects and putting it into a bigger banner.
Except for statistical learning , which is generally offered by mathematics or statistics departments in the majority of the universities across the globe, the rest are taught by computer science department. In the recent years, this separation is disappearing but the collaboration between the two departments is still not complete. Programmers are intimidated by the complex theorems and proofs and statisticians hate talking (read as coding) to machines all the time. But as more industries are becoming data and product driven, the need for getting the two departments to speak a common language is strongly emphasized. Roles in industry are suitably revamped to create openings like machine learning engineers, data engineers, and data scientists into a broad group being called the data science team.
The purpose of this chapter is to take one step back and demystify the terminologies as we travel through the history of machine learning and emphasize that putting the ideas from statistics and machine learning into practice by broadening the scope is critical. At the same time, we elaborate on the importance of learning the fundamentals of machine learning with an approach inspired by the contemporary techniques from data science. We have simplified all the mathematics to as much extent as possible without compromising the fundamentals and core part of the subject. The right balance of statistics and computer science is always required for understanding machine learning, and we have made every effort for our readers to appreciate the elegance of mathematics, which at times is perceived by many to be hard and full of convoluted definitions, theories, and formulas.
1.1 Understanding the Evolution
The first challenge anybody finds when starting to understand how to build intelligent machines is how to mimic human behavior in many ways or, to put it even more appropriately, how to do things even better and more efficiently than humans. Some examples of these things performed by machines are identifying spam e-mails, predicting customer churn, classifying documents into respective categories, playing chess, participating in jeopardy, cleaning house, playing football, and much more. Carefully looking at these examples will reveal that we humans haven't perfected these tasks to date and rely heavily on machines to help us. So, now the question remains, where do you start learning to build such intelligent machines? Often, depending on which task you want to take up, experts will point you to machine learning, artificial intelligence (AI), or many such subjects, that sound different by name but are intrinsically connected.
In this chapter, we have taken up the task to knit together this evolution and finally put forth the point that machine learning, which is the first block in this evolution, is where you should fundamentally start to later delve deeper into other subjects.
1.1.1 Statistical Learning
The whitepaper, Discovery with Data: Leveraging Statistics with Computer Science to Transform Science and Society by American Statistical Association (ASA) [1], published in July 2014, pointed out rightly, “Statistics as the science of learning from data, and of measuring, controlling, and communicating uncertainty is the most mature of the data sciences.” They also added, over the last two centuries, and particularly the last 30 years with the ability to do large-scale computing, this discipline has been an essential part of the social, natural, bio-medical, and physical sciences, engineering, and business analytics, among others. Statistical thinking not only helps make scientific discoveries, but it quantifies the reliability, reproducibility, and general uncertainty associated with these discoveries. This excerpt from the whitepaper is very precise and powerful in describing the importance of statistics in data analysis.
Tom Mitchell, in his article, “The Discipline of Machine Learning [2],” appropriately points out, “Over the past 50 years, the study of machine learning has grown from the efforts of a handful of computer engineers exploring whether computers could learn to play games, and a field of statistics that largely ignored computational considerations, to a broad discipline that has produced fundamental statistical-computational theories of learning processes.”
This learning process has found its application in a variety of tasks for commercial and profitable systems like computer vision , robotics, speech recognition, and many more. At large, it’s when statistics and computational theories are fused together that machine learning emerges as a new discipline.
1.1.2 Machine Learning (ML)
The Samuel Checkers-Playing Program, which is known to be the first computer program that could learn, was developed in 1959 by Arthur Lee Samuel, one of the fathers of machine learning. Followed by Samuel, Ryszard S. Michalski, also deemed as a father of machine learning, came out with a system for recognizing handwritten alphanumeric characters, working along with Jacek Karpinski in 1962-1970. The subject from then has evolved with many facets and led the way for various applications impacting businesses and society for the good.
Tom Mitchell defined the fundamental question machine learning seeks to answer as, “How can we build computer systems that automatically improve with experience, and what are the fundamental laws that govern all learning processes?” He further explains, the defining question of computer science is, “How can we build machines that solve problems, and which problems are inherently tractable/intractable?” whereas statistics focus on answering “What can be inferred from data plus a set of modeling assumptions, with what reliability?”
This set of questions clearly show the difference between statistics and machine learning. As mentioned earlier in the chapter, it might not even be necessary to deal with the chicken and egg conundrum as we clearly see one simply complements the other and is paving the path for future. As we dive deep into the concepts of statistics and machine learning, you will see the differences clearly emerging out or at times completely disappearing. Another line of thought, in the paper “Statistical Modeling: The Two Cultures” by Leo Breiman in 2001 [3], argued that statisticians rely too heavily on data modeling, and that machine learning techniques are instead focusing on the predictive accuracy of models.
1.1.3 Artificial Intelligence (AI)
The AI world from very beginning was intrigued by games. Whether it be checkers, chess, Jeopardy, or the recently very popular Go, the AI world strives to build machines that can play against humans to beat them in these games and it has received much accolades for the same. IBM’s Watson beat the two best players of Jeopardy, a quiz game show, wherein participants compete to come out with their responses as a phrase in the form of questions to some general knowledge clues in the form of answers. Considering the complexity in analyzing natural language phrases in these answers, it was considered to be very hard for machines to compete with humans. A high-level architecture of IBM's DeepQA used in Watson looks something like in Figure 1-1.

Figure 1-1. Architecture of IBM's DeepQA
AI also sits at the core of robotics. The 1971 Turing Award winner, John McCarthy, a well known American computer scientist , was believed to have coined this term and in his article titled, “What Is Artificial Intelligence?” he defined it as “the science and engineering of making intelligent machines [4]”. So, if you relate back to what we said about machine learning, we instantly sense a connection between the two, but AI goes the extra mile to congregate a number of sciences and professions, including linguistics, philosophy, psychology, neuroscience, mathematics, and computer science, as well as other specialized fields such as artificial psychology. It should also be pointed out that machine learning is often considered to be a subset of AI.
1.1.4 Data Mining
Knowledge Discovery and Data Mining (KDD) , a premier forum for data mining, states its goal to be advancement, education, and adoption of the “science” for knowledge discovery and data mining. Data mining, like ML and AI, has emerged as interdisciplinary subfield of computer science and for this reason, KDD commonly projects data mining methods, as the intersection of AI, ML, statistics, and database systems. Data mining techniques were integrated into many database systems and business intelligence tools, when adoption of analytic services were starting to explode in many industries.
The research paper, “WEKA Experiences with a Java open-source project”[5] (WEKA is one of the widely adapted tools for doing research and projects using data mining), published in the Journal of Machine Learning Research talked about how the classic book Data Mining: Practical machine learning tools and techniques with Java,[6] being originally named just Practical Machine Learning, and the term data mining was only added for marketing reasons. Eibe Frank and Mark A. Hall who wrote this research paper are the two co-authors of the book, so we have a strong rationale to believe this reason for the name change. Once again, we see fundamentally, ML being in the core of data mining.
1.1.5 Data Science
It’s not wrong to call data science a big umbrella that brought everything with a potential to show insight from data and build intelligent systems inside it. In the book, Data Science for Business [7], Foster Provost and Tom Fawcett introduced the notion of viewing data and data science capability as a strategic asset, which will help businesses think explicitly about the extent to which one should invest in them. In a way, data science has emphasized the importance of data more than the algorithms of learning.
It has established a well defined process flow that says, first think about doing descriptive data analysis and then later start to think about modeling. As a result of this, businesses have started to adopt this new methodology because they were able to relate to it. Another incredible change data science has brought is around creating the synergies between various departments within a company. Every department has their own subject matter experts and data science teams have started to build their expertise in using data as a common language to communicate. This paradigm shift has witnessed the emergence of data driven growth and many data products. Data science has given us a framework, which aims to create a conglomerate of skill sets, tools and technologies. Drew Conway, the famous American data scientist who is known for his Venn diagram definition of data science as shown in Figure 1-2, has very rightly placed machine learning in the intersection of Hacking Skills and Math & Statistics Knowledge.

Figure 1-2. Venn diagram definition of data science
We strongly believe the fundamentals of these different field of study are all derived from statistics and machine learning but different flavors, for reasons justifiable in its own context, were given to it, which helped the subject to get molded into various systems and areas of research. This book will help trim down the number of different terminologies being used to describe the same set of algorithms and tools. It will present a simple-to-understand and coherent approach, the algorithms in machine learning and its practical use with R. Wherever it’s appropriate, we will emphasize the need to go outside the scope of this book and guide our readers with the relevant materials. By doing so, we are re-emphasizing the need for mastering traditional approaches in machine learning and, at the same time, staying abreast with the latest development in tools and technologies in this space.
Our design of topics in this book are strongly influenced by data science framework but instead of wandering through the vast pool of tools and techniques you would find in the world of data science, we have kept our focus strictly on teaching practical ways of applying machine learning algorithms with R.
The rest of this chapter is organized to help readers understand the elements of probability and statistics and programming skills in R. Both of these will form the foundations for understanding and putting machine learning into practical use. The chapter ends with discussion of technologies that apply ML to a real-world problem. Also, a generic machine learning process flow will be presented showing how to connect the dots, starting from a given problem statement to deploying ML models to working with real-world systems.
1.2 Probability and Statistics
Common sense and gut-instincts play a key role for policy makers, leaders, and entrepreneurs in building nations and large enterprises. The big question is, how do we convert these immeasurable human decision-making traits into more objective measurable quantity to be able to take better decisions? That's where probability and statistics come in. Much of statistics is focused on analyzing existing data and drawing suitable conclusions using probability models. Though it's very common to use probabilities in many statistical modeling, we feel it’s important to identify the different questions probability and statistics help us answer. An example from the book, Learning Statistics with R: A Tutorial for Psychology Students and Other Beginnersby Daniel Navarro [8], University of Adelaide, helps us understand it much better. Consider these two pairs of questions:
What are the chances of a fair coin coming up heads 10 times in a row?
If my friend flips a coin 10 times and gets 10 heads. Is she playing a trick on me?
and
How likely it is that five cards drawn from a perfectly shuffled deck will all be hearts?
If five cards off the top of the deck are all hearts, how likely is it that the deck was shuffled?
In case of a coin toss, the first question could be answered if we know the coin is fair, there's a 50% chance that any individual coin flip will come up heads, in probability notation
, ![]() . So, our probability P(heads 10 times in a row) =.0009765625 (since all the 10 coin tosses are independent of each other, we can simply compute (0.5)10 to arrive at this value). The probability value .0009765625 quantifies the chances of a fair coin coming up heads 10 times in a row.
. So, our probability P(heads 10 times in a row) =.0009765625 (since all the 10 coin tosses are independent of each other, we can simply compute (0.5)10 to arrive at this value). The probability value .0009765625 quantifies the chances of a fair coin coming up heads 10 times in a row.
On the other side, such a small probability would mean the occurrence of the event (heads 10 times in a row) is very rare, which helps to infer that my friend is playing some trick on me when she got all heads. Think about this—does tossing a coin 10 times give you strong evidence for doubting your friend? Maybe no; you may ask her to repeat the process several times. More the data we generate, the better will be the inference. The second set of question has the same thought process but is applied to a different problem.
So, fundamentally, probability could be used as a tool in statistics to help us answer many such real-world questions using a model. We will explore some basics of both these worlds, and it will become evident that both converge at a point where it’s hard to observe many differences between the two.
1.2.1 Counting and Probability Definition
If we perform a random experiment like tossing three coins, there could be number of possible outcomes. Figure 1-3 shows a basic illustration of this experiment, with three coins, a total of eight possible outcomes (HHH, HHT, HTH, HTT, THH, THT, TTH, and TTT) are present. This set is called the sample space.

Figure 1-3. Sample space of three-coin tossing experiment
Though it’s easy to count, the total number of possible outcomes in such a simple example with three coins, but as the size and complexity of problem increases, manually counting is not an option. A more formal approach is to use combinations and permutations. If the order is of significance, we call it a permutation; otherwise, generally the term combination is used. For instance, if we say, it doesn't matter which coin gets heads or tails out of the three coins, we are only interested in number of heads, which is like saying there is no significance for the order, then our total number of possible combination will be {HHH, HHT, HTT, TTT}
. This means HHT and HTH are both same, since there are two heads on these outcomes. A more formal way to obtain the number of possible outcome is shown in Table 1-1. It’s easy to see for the value ![]() (heads and tails) and
(heads and tails) and ![]() (three coins), we get eight possible permutations and four combinations.
(three coins), we get eight possible permutations and four combinations.

Table 1-1. Permutation and Combinations
Once the sample space is known, it’s easy to define any events for which we would like to calculate probability. Suppose, we are interested in the event, E = tossing two heads:

This way of calculating the probability using the counts or frequency of occurrence is also know as the frequentist probability. There is another class called the Bayesian probability or conditional probability, which we will explore later in the chapter.
1.2.2 Events and Relationships
In the previous section, we saw an example of an event. Let’s go a step further and set a formal notion around various events and its relationship with each other.
1.2.2.1 Independent Events
A and B are independent if occurrence of A gives no additional information about whether B occurred. Imagine that Facebook enhances their Nearby Friends feature, and tells you the probability of your friend visiting the same cineplex for a movie in the weekends where you frequent. In the absence of such a feature in Facebook, the information that you are a very frequent visitor to this cineplex doesn't really increase or decrease the probability of you meeting your friend at the cineplex. This is because the events, A, you visiting the cineplex for a movie and B, your friend visiting the cineplex for a movie, are independent.
On the other hand, if such a feature exists, we can't deny you would try your best to increase or decrease your probability of meeting your friend depending upon if he or she is close to you or not. And this is only possible because the two events are now linked by a feature in Facebook.
In the commonly used set theory notations, A and B (both have a non-zero probability) are independent iff (read as if and only if) one of the following equivalent statements holds:
Probability of event A and B occurring at the same time is equal to the product of probability of event A and probability of event B

where, represent intersection of the two events and probability of A given B.
Probability of event Agiven B has already occurred, is equal to probability of A

Similarly, probability of event B given A has already occurred, is equal to probability of B
For the event A = Tossing two heads, and event B = Tossing head on first coin, so, ![]() whereas
whereas ![]() which is not equal to
which is not equal to ![]() . Similarly, the other two conditions can also be validated.
. Similarly, the other two conditions can also be validated.
1.2.2.2 Conditional Independence
In the Facebook Nearby Friends example, we were able to ascertain that the probability of you and your friend both visiting the cineplex at the same time has to do something with your location and intentions. Though intentions are very hard to quantify, it’s not the case with location. So, if we define the event C to be, being in a location near to cineplex, then it's not difficult to calculate the probability. But even when you both are nearby, it’s not necessary that you and your friend would visit the cineplex. More formally, this is where we define conditionally, A and B are independent given C if ![]() .
.
Note here that independence does not imply conditional independence, and conditional independence does not imply independence . It’s in a way saying, A and B together are independent of another event, C.
1.2.2.3 Bayes Theorem
On the contrary, if A and B are not independent but rather information about A reveals some detail about B or vice versa, we would be be interested in calculating ![]() , read as probability of A given B. This has a profound application in modelling many real-world problems. The widely used form of such conditional probability is called Bayes Theorem (or Bayes Rule). Formally, for events A and B, the Bayes Theorem is represented as:
, read as probability of A given B. This has a profound application in modelling many real-world problems. The widely used form of such conditional probability is called Bayes Theorem (or Bayes Rule). Formally, for events A and B, the Bayes Theorem is represented as:

where, ![]() P(A) is then called a prior probability and
P(A) is then called a prior probability and ![]() is called posterior probability, which is the measure we get after an additional information B is known. Let's look at the Table 1-2, a two-way contingency table for our Facebook Nearby example to explain this better.
is called posterior probability, which is the measure we get after an additional information B is known. Let's look at the Table 1-2, a two-way contingency table for our Facebook Nearby example to explain this better.

Table 1-2. Facebook Nearby Example—Two-Way Contingency Table
So, if we would like to know ![]() in other words, the probability of your friend visiting the cineplex given he or she is nearby (within one mile) the cineplex. A word of caution, we are saying the probability of your friend visiting the cineplex not the probability of you meeting the friend. The latter would be little more complex to model, which we would skip here to keep our focus intact on Bayes Theorem. Now, assuming we know the historical data (let’s say, the previous month) about your friend as shown in the Table 1-2, we know:
in other words, the probability of your friend visiting the cineplex given he or she is nearby (within one mile) the cineplex. A word of caution, we are saying the probability of your friend visiting the cineplex not the probability of you meeting the friend. The latter would be little more complex to model, which we would skip here to keep our focus intact on Bayes Theorem. Now, assuming we know the historical data (let’s say, the previous month) about your friend as shown in the Table 1-2, we know:

This means, in the previous month, your friend was ten times within one mile (nearby) of the cineplex and visited it. Also, there have been two instances when he was nearby but didn’t visit the cineplex. Alternatively, we could have calculated the probability as:

This example is based on the two-way contingency table and provides a good intuition around conditional probability. We will deep dive into the machine learning algorithm called Naive Bayes as applied to a real-world problem, which is based on Bayes Theorem, later in Chapter 6.
1.2.3 Randomness , Probability , and Distributions
David S. Moore et. al.’s book, Introduction to the Practice of Statistics [9], is an easy-to-comprehend book with simple mathematics, but conceptually rich ideas from statistics. It very aptly points out, “Random” in statistics is not a synonym for “haphazard” but a description of a kind of order that emerges in the long run.” They further explain, we often deal with unpredictable events in our life on daily basis that we generally term as random, like the example of Facebook's Nearby Friends, but we rarely see enough repetition of the same random phenomenon to observe the long-term regularity that probability describes.
In this excerpt from the book, they capture the essence of randomness, probability, and distributions very concisely.
We call a phenomenon random if individual outcomes are uncertain but there is nonetheless a regular distribution of outcomes in a large number of repetitions. The probability of any outcome of a random phenomenon is the proportion of times the outcome would occur in a very long series of repetitions.
This leads us to define a random variable that stores such random phenomenon numerically. In any experiment involving random events, a random variable, say X, based on the outcomes of the events will be assigned a numerical value. And the probability distribution of X helps in finding the probability for a value being assigned to X.
For example, if we define, X = {number of head in three coin tosses}, then X can take values 0, 1, 2, and 3. Here we call X a discrete random variable. However, if we define X = {all values between 0 and 2}, there can be infinitely many possible values, so X is called a continuous random variable .
par(mfrow=c(1,2))X_Values <-c(0,1,2,3)X_Props <-c(1/8,3/8,3/8,1/8)barplot(X_Props, names.arg=X_Values, ylim=c(0,1), xlab =" Discrete RV X Values", ylab ="Probabilities")x <-seq(0,2,length=1000)y <-dnorm(x,mean=1, sd=0.5)plot(x,y, type="l", lwd=1, ylim=c(0,1),xlab ="Continuous RV X Values", ylab ="Probabilities")
The above code will plot the distribution of X, a typical probability distribution function will look like in Figure 1-4. The second plot showing continuous distribution is a normal distribution with mean = 1 and standard deviation = 0.5. It’s also called the probability density function. Don't worry if you are not familiar with these statistical terms; we will explore on these in much detail later in the book. For now, it is enough to understand the random variable and what we mean by its distribution.

Figure 1-4. Probability distribution with discrete and continuous random variable
1.2.4 Confidence Interval and Hypothesis Testing
Suppose you were running a socioeconomic survey for your state among a chosen sample from the entire population (assuming it’s chosen totally at random). As the data starts to pour in, you feel excited and at the same time, a little confused on how you should analyze the data. There could be many insights that can come from data and it’s possible that every insight may not be completely valid, as the survey is only based on a small randomly chosen sample.
Law of Large Numbers (more detailed discussion on this topic in Chapter 3) in statistics tells us that the sample mean must approach population mean as the sample size increases. In other words, we are saying it’s not required that you survey each and every individual in your state but rather choose a sample large enough to be a close representative of the entire population. Even though measuring uncertainty gives us power to make better decisions, in order to make our insights statistically significant, we need to create a hypothesis and perform certain tests.
1.2.4.1 Confidence Interval
Let’s start by understanding the confidence interval. Suppose that a 10-yearly census survey questionnaire contains information on income levels. And say, in the year 2005, we find that for the sample size of 1000, repeatedly chosen from the population, the sample mean ![]() follows the normal distribution with population mean μ and standard
follows the normal distribution with population mean μ and standard ![]() . If we know the standard deviation, σ, to be $1500, then
. If we know the standard deviation, σ, to be $1500, then
![]() .
.
Now, in order to define confidence interval, which generally takes a form like
estimate ± margin of errorA 95% confidence interval (CI) is twice the standard error (also called margin of error) plus or minus the mean. In our example, suppose the ![]() dollars and standard deviation as computed is $47.4, then we would have a confidence interval (895.2,1084.8) i.e.
dollars and standard deviation as computed is $47.4, then we would have a confidence interval (895.2,1084.8) i.e. ![]() If we repeatedly choose many samples, each would have a different confidence interval but statistics tells us 95% of the time, CI will contain the true population mean μ. There are other stringent CIs like 99.7% but 95% is a golden standard for all practical purposes. Figure 1-5 shows 25 samples and the CIs. The normal distribution of the population helps to visualize the number of CIs where the estimate μ wasn't contained in the CI; in this figure, there is only one such CI.
If we repeatedly choose many samples, each would have a different confidence interval but statistics tells us 95% of the time, CI will contain the true population mean μ. There are other stringent CIs like 99.7% but 95% is a golden standard for all practical purposes. Figure 1-5 shows 25 samples and the CIs. The normal distribution of the population helps to visualize the number of CIs where the estimate μ wasn't contained in the CI; in this figure, there is only one such CI.

Figure 1-5. Confidence interval
1.2.4.2 Hypothesis Testing
Hypothesis testingis sometimes also known as a test of significance. Although CI is a strong representative of the population estimate, we need a more robust and formal procedure for testing and comparing an assumption about population parameters of the observed data. The application of hypothesis is wide spread, starting from assessing what’s the reliability of a sample used in a survey for an opinion poll to finding out the efficacy of a new drug over an existing drug for curing a disease. In general, hypothesis tests are tools for checking the validity of a statement around certain statistics relating to an experiment design. If you recall, the high-level architecture of IBM's DeepQA has an important step called hypothesis generation in coming out with the most relevant answer for a given question.
The hypothesis testing consists of two statements that are framed on the population parameter, one of which we want to reject. As we saw while discussing CI, the sampling distribution of the sample mean ![]() follows a normal distribution
follows a normal distribution ![]() . One of most important concepts is the Central Limit Theorem (a more detailed discussion on this topic is in Chapter 3), which tells us that for large samples, the sampling distribution is approximately normal. Since normal distribution is one of the most explored distributions with all of its properties well known, this approximation is vital for every hypothesis test we would like to perform.
. One of most important concepts is the Central Limit Theorem (a more detailed discussion on this topic is in Chapter 3), which tells us that for large samples, the sampling distribution is approximately normal. Since normal distribution is one of the most explored distributions with all of its properties well known, this approximation is vital for every hypothesis test we would like to perform.
Before we perform the hypothesis test, we need to construct a confidence level of 90%, 95%, or 99%, depending on the design of the study or experiment. For doing this, we need a number z*, also referred to as the critical value, so that normal distribution has a defined probability of 0.90, 0.95, or 0.99 within +-z* standard deviation of its mean. Table 1.x below shows the value of z* for different confidence interval. Note that in our example in the section 1.2.4.1, we approximated z* = 1.960 for 95% confidence interval to 2.

Figure 1-6. The z* score and confidence level
In general, we could choose any value of z* to pick the appropriate confidence level. With this explanation, let’s take our income example from the census data for the year 2015. We need to find out how the income has changed over the last 10 years, i.e., from 2005 to 2015. In the year 2015, we find the estimate of our mean value for income as $2300. The question to ask here would be, since both the values $900 (in the year 2005) and $2300 are estimates of the true population mean (in other words, we have taken a representative sample but not the entire population to calculate this mean) but not the actual mean, do these observed means from sample provide the evidence to conclude the income has increased? We might be interested in calculating some probability to answer this question. Let’s see how we can formulate this in a hypothesis testing framework. A hypothesis test starts with designing two statements like so:
![]()
![]()
Abstracting the details at this point, the consequence of the two statements would simply lead toward accepting Ho or rejecting it. In general, the null hypothesis is always a statement of “no difference” and the alternative statement challenges this null. A more numerically concise way of writing these two statements
would be:
![]()
![]()
In case we reject Ho, we have two choices to make, whether we want to test ![]() ,
, ![]() or simply
or simply ![]() , without bothering much about direction, which is called two-side test. If you are clear about the direction, a one-side test is preferred.
, without bothering much about direction, which is called two-side test. If you are clear about the direction, a one-side test is preferred.
Now, in order to perform the significance test, we would understand the standardized test statistics z, which is defined as follows:

Alternatively:

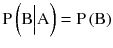
Substituting the value 1400 for the estimate of the difference of income between the year 2005 and 2015, and 1500 for standard deviation of the estimate (this SD is computed with the mean of all the samples drawn from the population), we obtain
The difference in income between 2005 and 2015 based on our sample is $1400, which corresponds to 0.93 standard deviations away from zero (z = 0.93). Because we are using a two-sided test for this problem, the evidence against null hypothesis, Ho, is measured by the probability that we observe a value of Z as extreme or more extreme than 0.93. More formally, this probability is
![]()
where Z has the standard normal distribution N(0, 1). This probability is called p-value. We will use this value quite often in regression models.
From standard z-score table, the standard normal probabilities
, we find:
![]()
Also, the probability for being extreme in the negative direction is the same:
![]()
Then, the p-value becomes:
![]()
Since the probability is large enough, we have no other choice but to stick with our null hypothesis. In other words, we don't have enough evidence to reject the null hypothesis. It could also be stated as, there is 35% chance of observing a difference as extreme as the $1400 in our sample if the true population difference is zero. A note here, though; there could be numerous other ways to state our result, all of it means the same thing.
Finally, in many practical situations, it’s not enough to say that the probability is large or small, but instead it’s compared to a significance or confidence level. So, if we are given a 95% confidence interval (in other words, the interval that includes the true value of μ with 0.95 probability), values of μ that are not included in this interval would be incompatible with the data. Now, using this threshold ![]() , we observe the P-value is greater than 0.05 (or 5%), which mean, we still do not have enough evidence to reject Ho. Hence, we conclude that there is no difference in the mean income between the year 2005 and 2015.
, we observe the P-value is greater than 0.05 (or 5%), which mean, we still do not have enough evidence to reject Ho. Hence, we conclude that there is no difference in the mean income between the year 2005 and 2015.
There are many other ways to perform hypothesis testing, which we leave for the interested readers to refer to detailed text on the subject. Our major focus in the coming chapters is to do hypothesis testing using R for various applications in sampling and regression.
We introduce the field of probability and statistics, both of which form the foundation of data exploration and our broader goal of understanding the predictive modeling using machine learning.
1.3 Getting Started with R
R is GNU S, a freely available language and environment for statistical computing and graphics that provides a wide variety of statistical and graphical techniques: linear and nonlinear modeling, statistical tests, time series analysis, classification, clustering, and lot more than what you could imagine.
Although covering the complete topics of R is beyond the scope of this book, we will keep our focus intact by looking at the end goal of this book. The getting started material here is just to provide the familiarity to readers who don't have any previous exposure to programming or scripting languages. We strongly advise that the readers follow R's official web site for instructions on installing and some standard textbook for more technical discussion on topics.
1.3.1 Basic Building Blocks
This section provides a quick overview of the building blocks of R, which uniquely makes R the most sought out programming language among statisticians, analysts, and scientists. R is an easy-to-learn and an excellent tool for developing prototype models very quickly.
1.3.1.1 Calculations
As you would expect, R provides all arithmetic operations you would find in a scientific calculator and much more. All kind of comparisons like >, >=, <, and <=, and functions such as acos, asin, atan, ceiling, floor, min, max, cumsum, mean, and median are readily available for all possible computations.
1.3.1.2 Statistics with R
R is one such language that’s very friendly to academicians and people with less programming background. The ease of computing statistical properties of data has also given it a widespread popularity among data analyst and statisticians. Functions are provided for computing quantile, rank, sorting data, and matrix manipulation like crossprod, eigen, and svd. There are also some really easy-to-use functions for building linear models quite quickly. A detailed discussion on such models will follow in later chapters.
1.3.1.3 Packages
The strength of R lies with its community of contributors from various domains. The developers bind everything in one single piece called a package, in R. A simple package can contain few functions for implementing an algorithm or it can be as big as the base package itself, which comes with the R installers. We will use many packages throughout the book as we cover new topics.
1.3.2 Data Structures in R
Fundamentally, there are only five types of data structures in R, and they are most often used. Almost all other data structures are built upon these five. Hadley Wickham, in his book Advanced R [10], provided an easy-to-comprehend segregation of these five data structures, as shown in Table 1-3.

Table 1-3. Data Structures in R
Some other data structures derived from these five and most commonly used are listed here:
Factors: This one is derived from a vector
Data tables: This one is derived from a data frame
The homogeneous type allows for only a single data type to be stored in vector, matrix, or array, whereas the Heterogeneous type allows for mixed types as well.
1.3.2.1 Vectors
Vectors are the simplest form of data structure in R and yet very useful. Each vector stores all elements of same type. This could be thought as a one-dimensional array, similar to those found in programming languages like C/C++
car_name <-c("Honda","BMW","Ferrari")car_color =c("Black","Blue","Red")car_cc =c(2000,3400,4000)
1.3.2.2 List
Lists internally in R are collection of generic vectors. For instance, a list of automobiles with name, color, and cc could be defined as a list named cars, with a collection of vectors named name, color, and cc inside it.
cars <-list(name =c("Honda","BMW","Ferrari"),color =c("Black","Blue","Red"),cc =c(2000,3400,4000))cars$name[1] "Honda" "BMW" "Ferrari"$color[1] "Black" "Blue" "Red"$cc[1] 2000 3400 4000
1.3.2.3 Matrix
Matrixes are the data structures that store multi-dimensional arrays with many rows and columns. For all practical purposes, its data structure helps store data in a format where every row represents a certain collection of columns. The columns hold the information that defines the observation (row).
mdat <-matrix(c(1,2,3, 11,12,13), nrow =2, ncol =3, byrow =TRUE,dimnames =list(c("row1", "row2"),c("C.1", "C.2", "C.3")))mdatC.1 C.2 C.3row1 1 2 3row2 11 12 13
1.3.2.4 Data Frame
Data frames extend matrixes with the added capability of holding heterogeneous types of data. In a data frame, you can store character, numeric, and factor variables in different columns of the same data frame. In almost every data analysis task, with rows and columns of data, data frame comes as a natural choice for storing the data. The following example shows how numeric and factor columns are stored within the same data frame.
L3 <-LETTERS[1:3]fac <-sample(L3, 10, replace =TRUE)df <-data.frame(x =1, y =1:10, fac = fac)class(df$x)[1] "numeric"class(df$y)[1] "integer"class(df$fac)[1] "factor"
1.3.3 Subsetting
R has one of the most advanced, powerful, and fast subsetting operators compared to any other programming language. It’s powerful to an extent that, except for few cases which we will discuss in the next section, there is no looping construct like for or while required, even though R explicitly provides one if needed. Though its very powerful, syntactically it could sometime turn out to be an nightmare or gross error could pop up if careful attention is not paid in placing the required number of parentheses, brackets, and commas. The operators [, [[, and $ are used for subsetting, depending on which data structure is holding the data. It’s also possible to combine subsetting with assignment to perform some really complicated function with very few lines of code.
1.3.3.1 Vectors
For vectors , the subsetting could be done by referring to the respective index of the elements stored in a vector. For example, car_name[c(1,2)] will return elements stored in index 1 and 2, and car_name[-2] returns all the elements except for second. It’s also possible to use binary operators to instruct the vector to retrieve or not retrieve an element.
car_name <-c("Honda","BMW","Ferrari")#Select 1st and 2nd index from the vectorcar_name[c(1,2)][1] "Honda" "BMW"#Select all except 2nd indexcar_name[-2][1] "Honda" "Ferrari"#Select 2nd indexcar_name[c(FALSE,TRUE,FALSE)][1] "BMW"
1.3.3.2 Lists
Subsetting in lists is similar to subsetting in a vector; however, since a list is a collection of many vectors, you must use double square brackets to retrieve a element from the list. For example, cars[2] retrieves the entire second vector of the list and cars[[c(2,1)]] retrieves the first element of the second vector.
cars <-list(name =c("Honda","BMW","Ferrari"),color =c("Black","Blue","Red"),cc =c(2000,3400,4000))#Select the second list with carscars[2]$color[1] "Black" "Blue" "Red"#select the first element of second list in carscars[[c(2,1)]][1] "Black"
1.3.3.3 Matrixes
Matrixes have a similar subsetting as vectors. However, instead of specifying one index to retrieve the data, we need two index here—one that signifies the row and the other for the column. For example, mdat[1:2,] retrieves all the columns of the first two rows, whereas mdat[1:2,”C.1”] retrieves the first two rows and the C.1 column.
mdat <-matrix(c(1,2,3, 11,12,13), nrow =2, ncol =3, byrow =TRUE,dimnames =list(c("row1", "row2"),c("C.1", "C.2", "C.3")))#Select first two rows and all columnsmdat[1:2,]C.1 C.2 C.3row1 1 2 3row2 11 12 13#Select first columns and all rowsmdat[,1:2]C.1 C.2row1 1 2row2 11 12#Select first two rows and first columnmdat[1:2,"C.1"]row1 row21 11#Select first row and first two columnsmdat[1,1:2]C.1 C.21 2
1.3.3.4 Data Frames
Data frames work similarly to matrixes, but they have far more advanced subsetting operations. For example, it’s possible to provide conditional statements like df$fac == “A”, which will retrieve only rows where the column fac has a value A. The operator $ is used to refer to a column.
L3 <-LETTERS[1:3]fac <-sample(L3, 10, replace =TRUE)df <-data.frame(x =1, y =1:10, fac = fac)#Select all the rows where fac column has a value "A"df[df$fac=="A",]x y fac2 1 2 A5 1 5 A6 1 6 A7 1 7 A8 1 8 A10 1 10 A#Select first two rows and all columnsdf[c(1,2),]x y fac1 1 1 B2 1 2 A#Select first column as a vectordf$x[1] 1 1 1 1 1 1 1 1 1 1
1.3.4 Functions and Apply Family
As the standard definition goes, functions are the fundamental building blocks of any programming language and R is no different. Every single library in R has a rich set of functions used to achieve a particular task without writing same piece of code repeatedly. Rather, all that is required is a function call. The following simple example is a function that returns the nth root of a number with two arguments, num and nroot, and contains a function body for calculating the nth root of a real positive number.
nthroot <-function(num, nroot) {return (num ^(1/nroot))}nthroot(8,3)[1] 2
This example is a user-defined function, but there are so many such functions across the vast collection of packages contributed by R community worldwide. We will next discuss a very useful function family from the base package of R, which has found its application in numerous scenarios.
The following description and examples are borrowed from The New S Language by Becker, R. A. et al. [11]
lapply returns a list of the same length as of input X, each element of which is the result of applying a function to the corresponding element of X.
sapply is a user-friendly version and wrapper of lapply by default returning a vector, matrix or, if you use simplify = "array", an array if appropriate. Applying simplify2array(). sapply(x, f, simplify = FALSE, USE.NAMES = FALSE) is the same as lapply(x, f).
vapply is similar to sapply, but has a prespecified type of return value, so it can be safer (and sometimes faster) to use.
tapply applies a function to each cell of a ragged array, that is to each (non-empty) group of values given by a unique combination of the levels of certain factors.
#Generate some data into a variable xx <-list(a =1:10, beta =exp(-3:3), logic =c(TRUE,FALSE,FALSE,TRUE))#Compute the list mean for each list element using lapplylapply(x, mean)$a[1] 5.5$beta[1] 4.535125$logic[1] 0.5#Compute the quantile(0%, 25%, 50%, 75% and 100%) for the three elements of xsapply(x, quantile)a beta logic0% 1.00 0.04978707 0.025% 3.25 0.25160736 0.050% 5.50 1.00000000 0.575% 7.75 5.05366896 1.0100% 10.00 20.08553692 1.0#Generate some list of elements using sapply on sequence of integersi39 <-sapply(3:9, seq) # list of vectors#Compute the five number summary statistic using sapply and vapply with the function fivenumsapply(i39, fivenum)[,1] [,2] [,3] [,4] [,5] [,6] [,7][1,] 1.0 1.0 1 1.0 1.0 1.0 1[2,] 1.5 1.5 2 2.0 2.5 2.5 3[3,] 2.0 2.5 3 3.5 4.0 4.5 5[4,] 2.5 3.5 4 5.0 5.5 6.5 7[5,] 3.0 4.0 5 6.0 7.0 8.0 9vapply(i39, fivenum,c(Min. =0, "1st Qu." =0, Median =0, "3rd Qu." =0, Max. =0))[,1] [,2] [,3] [,4] [,5] [,6] [,7]Min. 1.0 1.0 1 1.0 1.0 1.0 11st Qu. 1.5 1.5 2 2.0 2.5 2.5 3Median 2.0 2.5 3 3.5 4.0 4.5 53rd Qu. 2.5 3.5 4 5.0 5.5 6.5 7Max. 3.0 4.0 5 6.0 7.0 8.0 9#Generate some 5 random number from binomial distribution with repetitions allowedgroups <-as.factor(rbinom(32, n =5, prob =0.4))#Calculate the number of times each number repeatstapply(groups, groups, length) #- is almost the same as7 11 12 131 1 1 2#The output is similar to the function tabletable(groups)groups7 11 12 131 1 1 2
As you can see, every operation in the list involves a certain logic which needs a loop (for or while loop) like traversal on the data. However, by using the apply family of functions, we can reduce writing programming codes to a minimum and instead call a single-line function with the appropriate arguments. It’s functions like these that make R the most preferred programming language for even less experienced programmers .
1.4 Machine Learning Process Flow
In the real world, every use case has a different modeling need, so it’s hard to present a very generic process flow that explains how you should build machine learning model or data product. However, it’s possible to suggest best practice guidelines around the key milestones for any modeling projects in industry. Figure 1-7 depicts one such best practice guideline we have built after many years of research and suits the contemporary world of data science, where ideas are translated into data products. Throughout this book, we will refer to this machine learning process flow, as the topics in this book are coherently arranged based on this process flow.

Figure 1-7. Machine leaning process flow
The process flow has four main phases, which we will from here on refer to as PEBE, Plan, Explore, Build and Evaluate, as shown in the Figure 1-7. Let’s get into the details of each of these.
1.4.1 Plan
This phase forms the key component of the entire process flow. A lot of energy and effort needs to be spent on understanding the requirements, identifying every data source available at our disposal and framing an approach for solving the problems being identified from the requirements. While gathering data is at core of the entire process flow, considerable effort has to be spent in cleaning the data for maintaining the integrity and veracity of the final outputs of the analysis and model building. We will discuss many approaches for gathering various types of data and cleaning them up in Chapter 2.
1.4.2 Explore
Exploration sets the ground for analytic projects to take flight. A detailed analysis of possibilities, insights, scope, hidden patterns, challenges, and errors in the data are first discovered at this phase. A lot of statistical and visualization tools are employed to carry out this phase. In order to allow for greater flexibility for modification if required in later parts of the project, this phase is divided into two parts. The first is a quick initial analysis that’s carried out to assess the data structure, including checking naming conventions, identifying duplicates, merging data, and further cleaning the data if required. Initial data analysis will help identify any additional data requirement, which is why you see a small leap of feedback loop built in to the process flow.
In the second part, a more rigorous analysis is done by creating hypotheses, sampling data using various techniques, checking the statistical properties of the sample, and performing statistical tests to reject or accept the hypotheses . Chapters 2, 3, and 4 discuss these topics in detail.
1.4.3 Build
Most of the analytic projects either die out in the first or second phase; however, the one that reaches this phase, has a great potential to be converted into a data product. This phase requires a careful study of whether a machine learning kind of model is required or a simple descriptive analysis done in the first two phases is more than sufficient. In the industry, unless you don't show a ROI on effort, time, and money required in building a ML model, the approval from the management is hard to come by. And since, many ML algorithms are kind of a blackbox where at times, the output is difficult to interpret, the business rejects them outright in the very beginning.
So, if you pass all these criteria and still decide to build the ML model, then comes time to understand the technicalities of each algorithm and how it works on a particular set of data, which we will take up in Chapter 6. Once the model is build, it’s always good to ask if the model satisfies your findings in the initial data analysis. If not, then it’s advisable to take a small leap of feedback loop.
One reason you see Build Data Product in the process flow before the evaluation phase is to have a minimal viable output directed toward building a data product (not a full fledged product, but it could even be a small Excel sheet presenting all the analysis done until this point). We are essentially not suggesting that you always build a ML model, but it could even be a descriptive model that articulates the way you approached the problem and present the analysis. This approach helps with the evaluation phase, whether the model is good enough to be considered for building a more futuristic predictive model (or a data product) using ML or whether there still is a scope for refinement or whether this should be dropped completely.
1.4.4 Evaluate
This phase determines either the rise of another revolutionary disruption in the traditional scheme of things or the disappointment of starting from scratch once again. The big leap of feedback loop is sometimes unavoidable in many real-world projects because of the complexity it carries or the inability of data to answer certain questions. If you have diligently followed all the steps in the process flow, it’s likely that you may just want to further spend some effort in tuning the model rather than taking the big leap to start all from the scratch.
It’s highly unlikely that you can build a powerful ML model in just one iteration. We will explore in detail all the criteria for evaluating the model’s goodness in Chapter 7 and further fine-tune the model in Chapter 8.
1.5 Other Technologies
While we place a lot of emphasis on the key role played by programming languages and technologies like R in simplifying many ML process flow tasks which otherwise are complex and time consuming, it would not be wise to ignore the other competing technologies in the same space. Python is another preferred programming language that has found quite a good traction in the industry for building production-ready ML process flows. There is an increased demand for algorithms and technologies with capabilities of scaling ML models or analytical tasks to a much larger dataset and executing them at real-time speed. The later part needs a much more detailed discussion on big data and related technologies, which is beyond the scope of this book.
Chapter 9, in a nutshell, will talk about such scalable approaches and other technologies that can helps you build the same ML process flows with robustness and using industry standards. However, do remember that every approach/technology has its own pros and cons, so wisely deciding the right choice before the start of any analytic project is vital for the successful completion.
1.6 Summary
In this chapter, you learned about the evolution of machine learning from statistics to contemporary data science. We also looked at the fundamental subjects like probability and statistics, which form the foundations of ML. You had an introduction to the R programming language, with some basic demonstrations in R. We concluded the chapter with the machine learning process flow the PEBE framework.
In the coming chapters, we will go into the details of data exploration for a better understanding and take a deep dive into some real-world datasets.
1.7 References
Discovery with Data: Leveraging Statistics with Computer Science to Transform Science and Society by American Statistical Association (ASA).
Tom Mitchell, The Discipline of Machine Learning.
Leo Breiman, Statistical Modeling: The Two Cultures, 2001.
John McCarthy, What Is Artificial Intelligence.
WEKA Experiences with a Java open-source project.
Data Mining: Practical Machine Learning Tools and Techniques with Java. Eibe Frank and Mark A. Hall.
Data Science for Business. Foster Provost and Tom Fawcett.
Learning Statistics with R: A Tutorial for Psychology Students and Other Beginners. Daniel Navarro.
Introduction to the Practice of Statistics. David S. Moore et. al.
Hadley Wickham, Advanced R.
Becker, R. A. et al., The New S Language.