
Knowing how much load to apply in a load test has long been a question without a well-defined answer. The Scalability Yardstick (Chapter 6) finally answers that question with an easy-to-follow test formula, which also provides an uncommonly convenient way to assess scalability. The test itself is just a small, evolutionary improvement to the very commonly used incremental load test.
So, the Scalability Yardstick claims to make small improvements on existing techniques. That’s nice. This chapter intends to go way beyond that, with the claim that radically more performance visibility is possible with extremely low overhead using simple tools that have long been a trusted, but severely underused part of the JDK.
The objectives for this chapter are:
- Understand that thread dumps are currently used in a very limited role; they solve a very small set of problems.
- Learn novel techniques that greatly expand the role of thread dumps into a general-purpose, low-overhead, plug-it-in-now diagnostic tool.
- Learn how to use thread dumps to identify the class and method name(s) causing performance problems in any environment.
To be clear, my purpose in writing this chapter is not to share and review a commonly used performance technique. Instead, I am trying to take a powerful technique used by a pitifully small fraction of performance-minded engineers
and document it clearly so that it can be widely adopted to address longstanding gaps in visibility—the gaps I’ve referred to as Dark Environments.
I am ready to sit down and visit with those who are skeptical about this. Anything that gets wide adoption needs a good vetting. I understand that. I just want to make sure the reader gives a little more than a passing, ho-hum look at this proposal.
Current use of Thread Dumps
Today, thread dumps are mostly used for investigating BLOCKED
threads and related multi-threaded problems. A quick Internet search for “thread dump Java” will confirm that. Because the topic has such great coverage on the Internet, I chose not to waste the space on it in this book. A lot of smart people have shown how to use thread dumps to diagnose and fix these problems.
But before moving on to using thread dumps in other areas besides multi-threaded problem detection, I do have a few quick comments about multithread coding. Firstly, any time the
synchronized keyword
is used in Java, a simple load test with three threads of load should applied with zero think time, and four or more thread dumps should be taken.
In the thread dumps from the previous test, you should verify that BLOCKED threads show up infrequently, perhaps in 1 out of 20 stack traces you see. BLOCKED threads show up when synchronization methods or blocks wrap slow code, and every kind of I/O—disk, network and display—must be considered slow. I will grant exemptions to the expert writers of specialized libraries (like logging or caching frameworks
) who regularly load test their code. My comments are for us application developers. Remember, don’t put any I/O in a sync block—and that means no JDBC or other database calls inside a sync block.
There is nothing wrong with having the synchronization in your code. The problem is when multiple threads try to access the block at the same time, and the JVM has to make other threads wait while the owner of the lock executes. This is when the BLOCKED thread shows up, and when it happens it is called a
contended sync block.
Also, I have yet to mention there are a number of GUI tools designed to visualize and highlight multi-threading problems. Jack Shirazi wrote the first great Java performance book, Java Performance Tuning (O’Reilly,), and this link to his website contains a list to a number of programs the help you visualize thread dumps. Personally, I like the IBM Thread Dump Analyzer and ThreadLogic, which lets you configure the tool with patterns of text that should raise red flags or concern. You’ll find it at
To repeat myself a little bit, this little section has some helpful but still garden-variety thoughts on synchronization. The next section starts with some basics—it shows how threads created in some simple code actually look inside a thread dump. Then, I talk about navigating thread dumps. This doesn’t sound earth-shattering, but it is really key to understanding what code is running and who called it and why.
After that, we will get into the more controversial part, where we use thread dumps very much like we use a Java profiler
. To fully understand what’s going on here, you really need to run the examples on your own machine; just reading this chapter is not enough. Be sure to start up the littleMock application for the section “Interactive Thread Dump Reading Exercise.” The littleMock sample application will be used, and it just takes a few minutes to download, install and launch.
Threads and Thread Dumps
Listing 11-1 is a very simple program
that launches three threads that each sleep for 1 minute, before quitting. Let’s run it and capture a thread dump so we can see one stack trace for each thread.
Note that at start-up time, this program calls java.lang.Thead#setName(), thereby giving each thread a name used to identify each thread in the actual thread dump. The names here start with the prefix jpt-. We will talk about why this name is so important in a little bit.
package com.jpt;
public class MyThreadStarter {
public static void main( String[] args ) {
new MyThread("jpt-first" ).start();
new MyThread("jpt-second" ).start();
new MyThread("jpt-third" ).start();
}
}
class MyThread extends Thread {
public MyThread(String name) {
setName(name);
}
private void mySleep() {
try { Thread.sleep(60000); } catch(Exception e) {}
}
public void run() {
mySleep();
}
}
Listing 11-1.
A Java Program That
Starts Three Named Threads, Which We Will Look for in a Thread Dump
Place this text into MyThreadStarter.java located in one folder. From a prompt in that same folder, run the commands in Listing 11-2 to compile and run the program.
# mkdir classes
# javac -d classes
MyThreadStarter.java
# java -cp classes com.jpt.MyThreadStarter
Listing 11-2.
Compiling an running MyThreadStarter.java, a little program that ties stack trace activity in a thread dump (from jstack) back to line numbers in source code
Now that the program is running, the terminal window will appear to be hung.
Navigatin g Thread Dumps
After the 60 second Thread.sleep() calls, the “hung” program will return control back to the prompt, so you have 60 seconds to open another prompt, find the process id (PID) using the JDK’s jcmd utility, and capture a thread dump using the JDK’s jstack.
In the new prompt that you open, get the PID using the JDK’s jcmd program (8341 in Listing 11-3), which is passed to jstack, and then the jstack output (the text of the thread dump) is redirected into the file myThreadDump.txt. Note that the JDK’s jps command could also be used, but it requires a few extra command-line parameters (which I’m too lazy to type) to display the name of the Java class running. The 60 second sleep time in the program means the program will finish after 60 seconds, so don’t waste any time. The last line shows that the PID we care about is 8341.
#∼/jpt_threads: jcmd
6817 org.h2.tools.Server -tcp -web -baseDir ./data
8342 sun.tools.jcmd.JCmd
6839 warProject/target/performanceGolf.war
8341 com.jpt.MyThreadStarter <<<< 8341 is the PID we just started
Listing 11-3.
Using the JDK’s jcmd to find the PID of the program launched in Listing 11-2
Now that we know the PID of the process that of the program launched in Listing 11-2, the JDK comes with a number of plug-it-in-now tools we could use to learn more about the process: jstat, jmap, jinfo, and jdb. Listing 11-4 shows how we’ll pass the PID to jstack to capture a thread dump. The syntax > myThreadDump.txt is used to redirect the thread dump text to the .txt file instead of displaying it in the command-line window.
#∼/jpt_threads: jstack 8341 > myThreadDump
.txt
Listing 11-4.
Using the JDK’s jstack to Take a Thread Dump of the PID We Found in Listing 11-3
Key Landmarks in a Stack Trace
For each java.lang.Thread#start() in myThreadDump.txt captured in Listing 11-4, you can see one thread with the jpt- prefix (lines 01, 07 and 13) that I set in the code. Listing 11-5 shows three stack traces from the thread dump.
01 "jpt-third" #12 prio=5 os_prio=31 tid=0x00007fd8b605b800 nid=0x5803 waiting on condition [0x0000700005031000]
02 java.lang.Thread.State: TIMED_WAITING (sleeping)
03 at java.lang.Thread.sleep(Native Method)
04 at com.jpt.MyThread.mySleep(MyThreadStarter.java:18)
05 at com.jpt.MyThread.run(MyThreadStarter.java:21)
06
07 "jpt-second" #11 prio=5 os_prio=31 tid=0x00007fd8b5840800 nid=0x5603 waiting on condition [0x0000700004f2e000]
08 java.lang.Thread.State: TIMED_WAITING (sleeping)
09 at java.lang.Thread.sleep(Native Method)
10 at com.jpt.MyThread.mySleep(MyThreadStarter.java:18)
11 at com.jpt.MyThread.run(MyThreadStarter.java:21)
12
13 "jpt-first" #10 prio=5 os_prio=31 tid=0x00007fd8b6853000 nid=0x5403 waiting on condition [0x0000700004e2b000]
14 java.lang.Thread.State: TIMED_WAITING (sleeping)
15 at java.lang.Thread.sleep(Native Method)
16 at com.jpt.MyThread.mySleep(MyThreadStarter.java:18)
17 at com.jpt.MyThread.run(MyThreadStarter
.java:21)
Listing 11-5.
Displaying Selected Lines from
myThreadDump.txt
in an Editor
When looking at a map of say, a large city, finding the “you are here” landmark to get your bearings is critical. Working with stack traces is no different. To find my bearings in a single thread’s stack trace, Table 11-1 defines a few “landmarks” used to answer certain key performance questions.
Table 11-1.
Landmarks of a Stack Trace
, Using Listing 11-5 as an Example
Landmark Name | Question | Code from Listing 11-5
| Lines of Code from Listing 11-5
|
|---|---|---|---|
Current | What line of code in this thread was executing when jstack was invoked? This is the “You are here” mark. |
Thread.sleep()
| 3,9,15 |
Trigger | What code of mine triggered the Current line to execute? |
MyThread.mySleep()
| 4,10,16 |
Entry | What started this thread? |
MyThread.run()
| 5,11,17 |
So when you take a thread dump of a busy HTTP web container (like Tomcat) under load, each thread of traffic from the web looks like this:
- 1.The Entry mark is where Tomcat got an HTTP request and gave it to one of its threads to process. This is the first line at the bottom of each thread (aka stack trace).
- 2.Tomcat code calls your servlet code in your Java package. The “trigger” is one specific line of code in your package space—the last call your code makes that leads up to the currently executing code is the trigger. For example, if the current mark was in the JDBC driver package space waiting for a JDBC response, then the trigger would be the line of application code that executed the query. That line triggered the code to execute a query and wait for a response.
- 3.The Current mark is the topmost line of the stack trace—it’s the line that was executing when jstack captured the dump.
This “entry-trigger-current”, in that order, is the time sequence, kind of like an assembly line. The rest of this chapter relies on understanding “entry-trigger-current”, so be sure to know which name points to which part of a stack trace. Each web container thread in a thread dump might be at any point in the assembly line at a given moment. In a way, it seems there might be equal probability that any single line of code executed in the system was positioned at the Current mark. That’s pretty much what I thought before I ever did any performance tuning.
Thread Names are Helpful
Did you notice that in the MyThreadStarter example, we added a prefix (jpt) to the name of each thread? That is my naming scheme for my test program. Web/app servers have their own naming schemes for naming the threads that process incoming HTTP traffic and other traffic as well. Table 11-2 shows some examples for HTTP/S. Understanding how these containers name their threads helps understand which threads are under load.
Table 11-2.
Examples of How Popular Containers
Name Their Threads
Container | Example of thread name |
|---|---|
WebSphere |
WebContainer : 5
|
Spring Boot / Tomcat |
http-nio-8080-exec-7
|
Spring Boot / Jetty |
qtp266500815-40
|
Wildfly Servlet 11.0 |
default task-127
|
Focus on the Threads under Load
Java developers sometimes shy away from thread dumps because of the dizzying amount of thread activity. It is dizzying for me, too, and I saved you from all that detail. Specifically, I saved you by keeping my program very short, and in the thread dump, I showed you just the three threads started by my program, not all the other threads (beyond the scope of this book) started by the JVM.
So to make sense of thread dumps, you need strategies to weed out all threads that don’t matter, so you can focus on the ones most likely to be causing the problem. Here is your first tip:
- The threads under load are the ones causing the performance problem.
This sounds a bit evasive, unhelpful
, and questionable at best. So it is not an absolute rule, but it should at least be one of your first lines of performance inquiry. You should ask whether there are there any obvious problems in the threads that are under load. Determining which threads are the ones under load is actually pretty straightforward.
First ask yourself what load is being applied. Are there production users coming over HTTP/S, or did you just kick off a test load script (like JMeter) that is also using HTTP/S? Is a batch job reading “work” from a file or database and then processing (that is, applying load)? Or perhaps this is a back-end JMS (Java Messaging Server) taking traffic from some unknown message producer?
Then, you find the threads in the thread dump that:
- Have an Entry mark roughly looks like it’s coming from the load that is being applied.
- Have a thread name that also matches the load being applied.
- Show Java method calls/activity from your package space.
- Have a Thread status that is neither WAITING nor TIME_WAITING.
Let’s look at these four, one at a time.
Listing 11-6 is a snippet from a thread dump from a Tomcat HTTP SOA app running under Spring Boot. Let’s see if the thread in Listing 11-7, shortly, is consistent with all of that. Probably all Entry marks start with Thread.run()—or the run() method of some subclass of Thread; the examples in Listing 11-5 earlier and Listing 11-6 are no exception. Thread.run() on line 87 is essentially the emblem of the Entry mark. Three of the lines above that include classes in the tomcat package, so it sounds like we’re still in the right place. Lastly, on Line 78, the text “http11.Http11Processor” shows that this is HTTP activity. So the first bullet point suggests we are on the right track. The rightmost portion of Listing 11-6 is truncated for readability.
78 at org.apache.coyote.http11.Http11Processor.service
79 at org.apache.coyote.AbstractProcessorLight.process
80 at org.apache.coyote.AbstractProtocol$ConnectionHan
81 at org.apache.tomcat.util.net.NioEndpoint$SocketPro
82 at org.apache.tomcat.util.net.SocketProcessorBase.r
83 - locked <0x0000000747d9f320> (a org.apache.tomcat.
84 at java.util.concurrent.ThreadPoolExecutor.runWorke
85 at java.util.concurrent.ThreadPoolExecutor$Worker.r
86 at org.apache.tomcat.util.threads.TaskThread$Wrappi
87 at java.lang.Thread.run
(Thread.java:745)
Listing 11-6.
A Stack Trace That Shows (Line 78) That It Was Launched by Tomcat’s HTTP Engine
The second bullet point says that the thread name has to match the load being applied. My Tomcat thread name is http-nio-8080-exec-9 and that is consistent with Table 11-2. The thread name is in the first line of 11-7, below.
The third bullet point is just a reminder that normally you are looking for code from your own package space. In this book, that will mostly be com.github.eostermueller—and we’ll have plenty examples of this later.
The fourth bullet point says that threads under load are in a thread state other than WAITING and other than TIMED_WAITING. Well, that is normally the case, but in a few of my examples, my use of java.lang.Thread.sleep() in sample code to simulate a slow piece of code are an exception to the rule—they’ll show up as TIME_WAITING, even though load is applied.
The second line in Listing 11-7 shows a thread under load, with thread state of RUNNABLE.
"http-nio-8080-exec-9" #56 daemon prio=5 os_prio=31
java.lang.Thread.State: RUNNABLE
at java.io.FileInputStream.readBytes(Native
at java.io.FileInputStream.read(FileInputStr
at sun.security.provider.NativePRNG$RandomIO
at sun.security.provider.NativePRNG$RandomIO
Listing 11-7.
Thread Under Load with thread state RUNNABLE
So once you have verified these four things, you will be able to wade through all the threads in a thread dump and figure out which ones are currently under load. As one last sanity check, you could also check the CPU consumption on the machine. For sure, zero CPU consumption with occasional spikes will not suffice for load (even by
this chapter’s loose definition).
Manual Thread Dump Profiling (MTDP)
Now that you can identify threads under load in a thread dump, you are finally ready to use MTDP to find performance issues in any environment.
Here are the instructions:
- 1.Take four or so thread dumps as load is applied with a few seconds between each dump.
- 2.If something that you could fix shows up in the dumps for two or more threads that are under load, it is worth fixing.
Although these instructions are adjusted to work with Java, Mike Dunlavey was the first to document this technique (for C programs) in his book Building Better Applications (Van Nostrand Reinhold, 1994).
Example 1
This example shows how thread dumps point you to a performance defect, even one without Java synchronization issues. Start by following the instructions at
https://github.com/eostermueller/littleMock
to download and start a Spring Boot server, and then apply three threads of load. If Maven and Java 8 (or greater) are already installed, this should take five minutes or so. The general idea is to download the zip file or do a git clone. In one terminal window, launch ./startWar.sh. In a separate window, launch ./load.sh. Then do the following:
- 1.Open http://localhost:8080/ui in a browser.
- 2.We want the Sleep Time parameter to 50ms. In the browser at the above URL, clear out all the text in the Performance Key text box. Then enter L50 and click Update. If you open Glowroot at http://localhost:4000, the added sleep time will show up as shown in Figure 11-1.
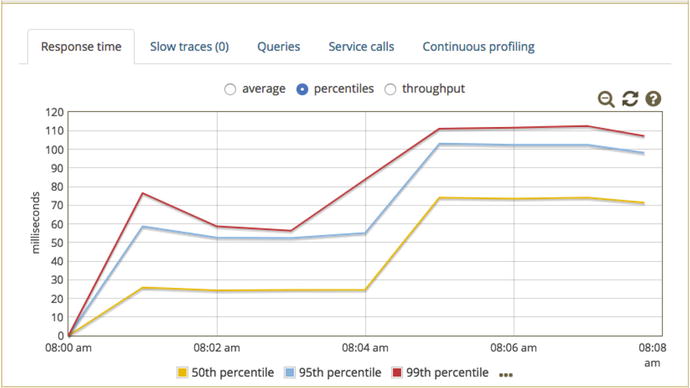 Figure 11-1.Response time metrics from Glowroot (glowroot.org) show sleep time of 50ms was introduced halfway through the littleMock Spring Boot test
The red line shows that 99% of all requests finished in about 58 ms or faster, until we added 50 additional ms at 8:04am, where response time jumped to about 110ms for the same 99% metric. This is a nice result—we added 50ms of sleep, and response time increased by just about the same amount (110–50 = ∼58ms). But the question is this: If your client complains that response time more than doubled (like this), how would you find the root cause? If you explore the Glowroot interface, there is a good chance it will point to the Thread.sleep(), which is great. But finding the bug in any environment is the goal here, so we will use jstack, which comes with
every JDK.
I invoked jstack four times (Figure 11-2) to get four text files, each with a thread dump. Then, I used the techniques in the previous section to find which threads in the dump were under load: each thread dump text file had exactly three threads with code in the com.github.eostermueller package space, and each of those had a Tomcat HTTP-looking entry mark, along with an HTTP-like thread name, such as http-nio-8080-exec-10.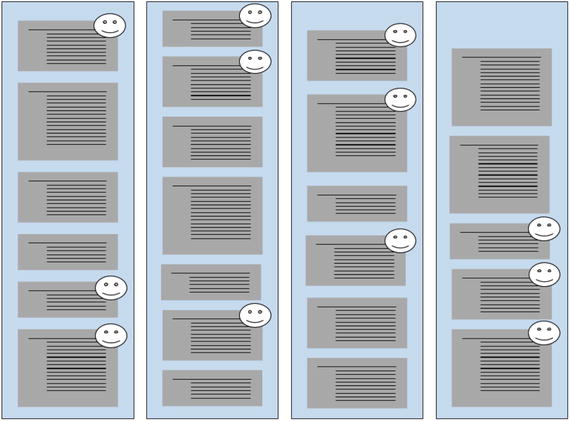
Figure 11-2.
Depiction
of the four thread dumps taken earlier, one tall blue rectangle per thread dump. Each gray box is a single stack trace, aka thread. The smiley faces point to the only stack traces executing code in the com.github.eostermueller package space.
This finding is critical, so I will repeat it: Three threads of load are being applied, and there are exactly that number of threads (three) from my com.github.eostermueller package space in each one of the four thread dumps captured. This is what happens when there is zero load gen think time and load is generated locally, not from across a network.
I mentioned earlier that to be considered “under load,” a thread state much be running. Well, this is one exception, because my scenario uses Thread.sleep() to slow down the code, and that means the RUNNING state changes to TIMED_WAITING while inside Thread.sleep().
It is no coincidence that each thread dump had three threads under load, because the JMeter load script in use (load.sh invokes src/test/jmeter/littleMock.jmx) has three threads of load configured in it. If you launch the JMeter GUI with loadGui.sh (it is in same folder as load.sh) and point to the aforementioned .jmx file, you can confirm this number three in the JMeter Thread Group.
Had I added think time to the .jmx
or ran JMeter from a slow network (over the Internet, or from a different data center) instead of running it locally on the same box, the number of threads under load in each dump (aka “JVM concurrency”) would vary between zero and three.
So we have four threads dumps, each with three threads under load, for a total of 3x4=12 “sample” threads. Thus, we have 12 smiley faces in Figure 11-2. Let’s get back to finding the code that caused this slowdown. The instructions for Manual Thread Dump Profiling (MTDP) say this:
- “If something that you could fix shows up in the dumps for two or more threads that are under load, it is worth fixing.”
Of the twelve threads in the sample (the ones under load), eight of them were sitting on the Thread.sleep() that we introduced using the Sleep Time parameter on http://localhost:8080/ui. Listing 11-8 shows one of them.
29 "http-nio-8080-exec-10" #54 daemon prio=5 os_prio=31 tid=0x00007f90611d3800 nid=0x8603 waiting
30 java.lang.Thread.State: TIMED_WAITING (sleeping)
31 at java.lang.Thread.sleep(Native Method)
32 at com.github.eostermueller.littlemock.Controller.simulateSlowCode(Controller.java:73)
33 at com.github.eostermueller.littlemock.Controller.home(Controller.java:60)
34 at sun.reflect.GeneratedMethodAccessor58.invoke(Unknown Source)
Listing 11-8.
Stacktrace of Thread.sleep()
Furthermore, the instructions earlier tell us that seeing the same code show up just twice in 12 thread dumps is enough to cause concern. My test yielded four times that many—eight.
Sample Size and Healthy Skepticism
In the preceding example, we found that 8 out of 12 threads sampled were in Thread.sleep(), and we felt confident enough to claim we had found the culprit. Is 12 really a large enough sample to base real development/tuning changes on? What if I captured a new set four additional thread dumps and Thread.sleep() only showed in one or none of them? This is a fair point, one that I asked myself for many months when I first started using this technique.
The short answer is that it is extremely rare for relatively fast methods to show up as the Current mark in a thread dump. For instance, trivial getters and setters never show up. If one ever did, it would be years before you saw it again. The slower the execution time, the more a method will show up in the stack trace. Think of MTDP as an exclusive club for the slow, which is completely different than having equal probability that any single line of code executed will be positioned at the Current mark. This equal probability situation never happens.
For a slightly longer answer, I ran one test for almost 20 minutes and took one thread dump every second (1151 thread dumps to be precise). The average number of times that my Controller.simulateSlowCode() showed up in a single thread dump file? 1.94787 times out of three possible threads. So my measurement of 8/12 (2/3) only fractionally overstated the average captured from a more robust sample size.
If you are looking for a more complete justification for why it is safe to make development changes based on such small sample sizes, here are two math-based opinions on that matter. For full disclosure, one of the justifications is written by Mike Dunlavey, the guy who first published this technique:
Personally, I use this technique not because the math is convincing, but because it works. The next section shows the results from one such tuning success story, and you can have a close look at all the optimizations discovered by this technique, a technique
you can finally take into any environment in the enterprise.
The example above showed how MTDP can detect a 50ms response time increase, where the response time was doubled. Regardless of whether you think that is a large or a small slowdown, the next section shows how MTDP is capable of detecting response time problems much smaller than 50ms.
MTDP Demonstration
I am expecting, almost hoping, that you will be skeptical that performance defects can accurately be identified with the small number of samples discussed in the preceding section. I’m not really seeking out disagreement; instead I just want to say “welcome.” The world of performance assessment needs the skeptics.
This section provides an overview of a small tuning effort, with basic before-and-after performance results. To give you a rough idea of how littleMock works, there is no detailed review of thread dumps in this first example—just an overview. All the defects on this adventure were discovered using the Manual Thread Dump Profiling (MTDP) technique described earlier. But instead of just replacing slow code with the fast as in a normal tuning effort, we will use the littleMock web page that allows us to live-toggle between the slow and the fast code. You just click a button to toggle between slow and fast, and the Glowroot (point your browser to http://localhost:4000) throughput measurement leaps, like resuscitating a dead patient. You should try it.
Since this is a run-on-your-own-machine demo, when a “slow” option is enabled, you get to see each defect rear its ugly little head in the thread dumps (the exclusive club for the slow). When you click to toggle on the “fast” option, you can take more thread dumps to insure that same defect vanishes and that there is a corresponding boost in performance.
The application is the same one used earlier, but the Sleep Time option is not used. Here is the link again for the install:
I ran the littleMock UI with the some slower options for almost 10 minutes. Then, just before 5pm in Figure 11-3, I used the GUI to apply some more efficient settings, where you can see a dramatic spike.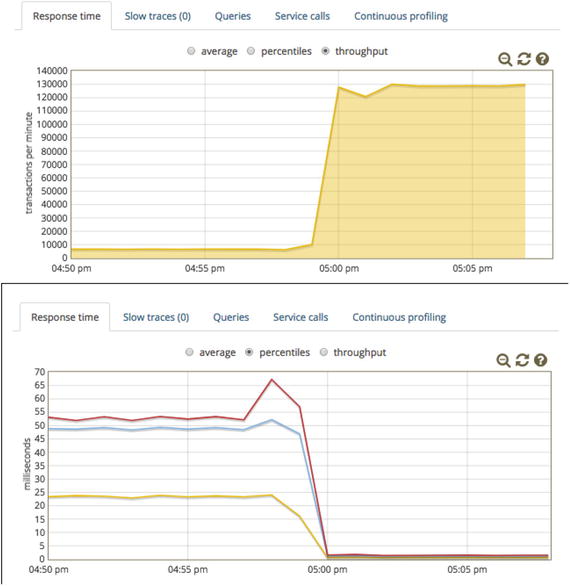
Figure 11-3.
The big boost in performance right around 5pm happened when I applied a different performance key. The load.sh script was running for the duration of the test.
As you can read from Figure 11-3
, the tuning fixes boosted throughput by a factor of 13; throughput started out at fewer than 10K requests per minute and ended up at more than 130K per minute. For response time, 99% of all responses started out around about 53ms or faster, and ended up faster than 2ms.
Here are the performance keys to the slow and fast tests shown above in Figure 11-3.
Slow: X0,J100,K100,Q0,R0,S0
Fast: X2,J25,K25,Q1,R1,S1
But what code is making such dratic changes between these two different performance keys? The littleMock web page, below the performance key, details all the options. It even provides web links to github source code that shows what changes are made when you choose a slightly different option.
For example, to understand the difference between the X0 and the X2 settings, look for the [X0] text as you scroll down the littleMock web page. If you click on the ‘Source Link’ to the right of [X0], it will take you to the github.com code.
Navigating Unfamiliar Code
Finding the entry, trigger, and current marks is the first step to getting your bearings when looking at a stack trace. Unfamiliar code is everywhere, because our applications now rely on so many different libraries. It took a while, as a performance engineer, to get comfortable making assessments of code I’d never seen before. It is just part of the job I had to get used to.
My first reaction to looking at a stack trace from unfamiliar code
used to be one of these:
- 1.Fear.
- 2.I can only tune something I’ve got the source code to, and if it’s not in one of our company’s package spaces, forget it.
I still feel like this on a bad day, but there is one simple question that disarms all of this fear for me: When in the logical timeline of the request was this stack trace taken?
- 1.Was it in the beginning, when the code is reading the input from the caller and figuring out what processing to tackle?
- 2.Or was it in the middle, when the beef of the main process is well underway, like an INSERT into a massive database table of orders?
- 3.Or was the code toward the end of the request, closing resources and preparing the result (like marshaling a result to json or HTML rendering) for the caller?
The easiest way for me pinpoint the location on the timeline is this: the stack trace includes the line number of the trigger mark—this is the last method called in your package space before the current mark executes. Open the source code to the line number specified in the trigger mark. If you don’t have the source code, consider getting the .class file and using an open-source Java decompiler to get the source. I have had good luck with JD-GUI (
http://jd.benow.ca/
) and jad.exe (
https://sourceforge.net/projects/originaljavadecompiler/
).
Once you have the source code in front of you, assess whether the trigger code executes before, during, or after the “main” processing for this request—you’ll have to be the judge of this “main” event. Is it a request to a back-end system? Calculation of some result? You make the call. I’ll refer to this timeline exercise as “plotting the request
’s timeline.”
When I look at unfamiliar class names on the current landmark in a stack trace that repeatedly shows up in MTDP analysis, I’m inclined to say “not my problem.” But if I instead ask “Where in the stack trace do I have any control?” or “At what point in the stack trace could I have done anything different?” there is hope, because normally a trigger landmark exists, one that my code executed, and that is where I need to reevaluate.
Leveraging the Four Anti-Patterns
The performance anti-patterns discussed in Chapter 1, admittedly, are a bit over-generalized. But that all changes, now that we have the Entry, Trigger, and Current vocabulary in hand; we can get a little more specific.
The answer to the question about where in the timeline of a request was a particular stack trace captured, makes all the difference in painting a story around how this defect came to be. Let’s do a quick review:
- 1.Unnecessary Initialization
- 2.Strategy/Algorithm Inefficiency
- 3.Overprocessing
- 4.Large Processing Challenge
If the trigger mark comes before the “main” processing, check to see whether this is an Unnecessary Initialization problem—number 1. An unsettling number of performance defects happen here. If there is a lot of data to initialize (like 500MB of product descriptions loading from a database), then consider processing the data once at start-up (or when the first request comes thru) and then cache the result for quick access later.
If the process doesn’t have 500MB of product description loading or other similar large data tasks, then you should ask yourself why it’s taking so long (remember, the MTDP is the exclusive club for the slow) to process just a small amount of data. If the amount of data is small, then perhaps the path the trigger code takes to get to the current mark needs to be rethought. Most APIs have multiple usage idioms, and perhaps the one your code took is not optimal. When the trigger code makes its first call that leads to the current mark, it is broadcasting to you which idiom (or at least part of the idiom) was selected by the trigger.
If the stack trace is part of the main process, then check to see whether you’re looking at number 2—Strategy/Algorithm inefficiency. A slow individual database query falls into this category, as well as a chatty database strategy caused by a SELECT N+1 issue, or perhaps just too many database calls in general. That said, these culprits can be more easily recognized using the toolset and approach in the P for Persistent part of the P.A.t.h. checklist.
The third anti-pattern is pretty easy to check for. Judging by the class and method names and even the entry mark, determine whether this is a business process that belongs in the load test. For example, perhaps sample data in the JMeter load test use that one special test customer from QA with a hundred times as many accounts as a regular customer (it was QA’s fault!). If so, fix the load script to call less off this business process.
For anti-pattern 4, the Large Processing Challenge, just as with anti-pattern 3, check the calls leading up to the trigger to assess which business process is executing. Large Processing Challenges are so large that you should know about them and start planning for them (installing extra disk space, scripting a large data load and backup, and
so on) during development.
Interactive Thread Dump Reading Exercise
This is where the examples get detailed and you will really want to run this on your own desktop.
One of the first hurdles to get over when you start tuning is to decide on one particular stack trace to target for improvement. This example provides a walkthrough of one such example.
Use the following performance key as the starting point for this example.
X0,J25,K25,Q1,R1,S1
Once the load.sh/cmd was up and running, I ran jcmd to find the PID of littleMock and captured four thread dumps using jstack. I used the criteria discussed earlier to find which threads were under load. As we saw before, there were three threads under load in each thread dump, times four dumps, or 12 stack traces total.
Listing 11-9 shows key parts from the 12 threads under load. The first two threads showed up in five threads each, and the last two threads show up one time each. 5+5+1+1 = 12. I encourage you to try this example yourself on your own machine to see whether you get stack traces in similar proportions; I think you will.
at com.sun.org.apache.xpath.internal.jaxp.XpathImpl.getResultAsType(XPathImpl.java:317)
at com.sun.org.apache.xpath.internal.jaxp.XpathImpl.evaluate(XPathImpl.java:274)
at com.github.eostermueller.littlemock.XPathWrapper.matches(XPathWrapper.java:25)
at com.github.eostermueller.littlemock.PlaybackRepository.getConfigByXPath(PlaybackRepository.java:144)
at com.github.eostermueller.littlemock.PlaybackRepository.locateConfig_noCaching(PlaybackRepository.java:96)
at com.sun.org.apache.xerces.internal.parsers.XMLParser.parse(XMLParser.java:141)
at com.sun.org.apache.xerces.internal.parsers.DOMParser.parse(DOMParser.java:243)
at com.sun.org.apache.xerces.internal.jaxp.DocumentBuilderImpl.parse(DocumentBuilderImpl.java:339)
at com.github.eostermueller.littlemock.PlaybackRepository.getConfigByXPath(PlaybackRepository.java:143)
at com.github.eostermueller.littlemock.PlaybackRepository.locateConfig_noCaching(PlaybackRepository.java:96)
at javax.xml.xpath.XPathFactoryFinder.newFactory(XPathFactoryFinder.java:138)
at javax.xml.xpath.XPathFactory.newInstance(XPathFactory.java:190)
at javax.xml.xpath.XPathFactory.newInstance(XPathFactory.java:96)
at com.github.eostermueller.littlemock.XPathWrapper.matches(XPathWrapper.java:22)
at com.github.eostermueller.littlemock.PlaybackRepository.getConfigByXPath(PlaybackRepository.java:144)
at java.security.AccessController.doPrivileged(Native Method)
at javax.xml.parsers.FactoryFinder.findServiceProvider(FactoryFinder.java:289)
at javax.xml.parsers.FactoryFinder.find(FactoryFinder.java:267)
at javax.xml.parsers.DocumentBuilderFactory.newInstance(DocumentBuilderFactory.java:120)
at com.github.eostermueller.littlemock.PlaybackRepository.getDocBuilder(PlaybackRepository.java:167)
Listing 11-9.
The four unique stack traces under load in the four thread dumps
The application under load that we’ve been using since the beginning of this chapter is littleMock. It is a tiny little HTTP stub server that I modeled after wiremock.org. A stub server is basically a test double, used in a test environment as a stand-in for some other system that was too expensive or too troublesome to install. If the XML-over-HTTP input
(from load.sh/JMeter) matches one of five XPath expressions configured in littleMock’s application.properties, it returns a preconfigured response XML that mimics a response from the stubbed-out system.
As such, XPath evaluation and XML parsing (of the HTTP input requests) are the main processing of this application, and this is our first task—to assess whether these four stack traces occurred before, during, or after the main processing.
The trigger in the first stack trace calls XpathImpl.evaluate(); the second calls DocumentBuilderImpl.parse(). Obviously, the bulk of the processing is happening in these 5+5 threads doing XPath evaluation and XML parsing, but there are no obvious optimizations, here—no low-hanging fruit.
But the third stack trace, which showed up just once out of 12 threads, is certainly suspect, and I will show you exactly why.
Listing 11-10 shows that the trigger is on line 22 of XPathWrapper.java. The stack trace shows that line 22 should be a call to XPathFactory.newInstance().
at javax.xml.xpath.XPathFactory.newInstance(XPathFactory.java:96)
at com.github.eostermueller.littlemock.XPathWrapper.matches(XPathWrapper.java:22)
Listing 11-10.
A small excerpt from the third stack trace in Listing 11-9
…and sure enough, when we look at the source code, line 22 contains exactly what we expected, a call to newInstance():
19 boolean matches(Document document) throws XPathExpressionException {
20
21 XPath xpath = null;
22 XPathFactory factory = XPathFactory.newInstance();
23 xpath = factory.newXPath();
24
25 Object xpathResult = xpath.evaluate(this.getXPath(),
document, XPathConstants.BOOLEAN);
26
28 Boolean b = (Boolean)xpathResult;
28 return b.booleanValue();
29 }
This code was taken from the following link:
Furthermore, the third stack trace’s trigger (line 22) clearly comes before the main processing of this request, right there in the same method in Listing 11-10, line 25.
The very important point is this:
- Slow initialization code begs for optimization.
We know this code is slow because it shows up in the “exclusive club for the slow”—MTDP.
We know that the slow code, the call to XPathFactory.newInstance() on line 22, is initialization code because it comes before the main processing—the XpathImpl.evaluate() on line 25.
Why does slow code beg for optimization? I went over this in the “Leveraging the Four Anti-Patterns” section earlier, but the general idea is this: it takes a lot of work to get large processing challenges to perform well, but initialization tasks often have static data that can be processed and cached one time at start-up, or there isn’t that much data to process at all—processing small amounts of data is generally fast.
How to Make Code Faster
Once you have found some slow code to focus on, unless you have some bright ideas on how to optimize, it’s time put this in the good hands of the Internet. If you factor out environment-specific factors like “processing too much data,” “misconfigured virtual machine,” or “faulty network cable,” your answer lies on the Internet. I’m telling you, you are not the first one to run into a performance problem with a commonly used API. My search for “XPathFactory.newInstance() performance,” for example, yielded a handful of discussions that led me to the fix in Listing 11-11. Actually, both the third thread and the fourth thread (the two that showed up in a single stack trace each) have similar problems, and both of them are addressed with the change shown here.
<argument>-Dcom.sun.org.apache.xml.internal.dtm.DTMManager=
com.sun.org.apache.xml.internal.dtm.ref.DTMManagerDefault</argument>
<argument>-Djavax.xml.parsers.DocumentBuilderFactory=
com.sun.org.apache.xerces.internal.jaxp.DocumentBuilderFactoryImpl</argument>
<argument>-Djavax.xml.xpath.XPathFactory:http://java.sun.com/jaxp/xpath/dom=
com.sun.org.apache.xpath.internal.jaxp.XPathFactoryImpl</argument>
Listing 11-11.
In pom.xml
(same folder as startWar.sh/cmd), Make Sure This Text Is Commented In, for a Performance Improvement.
You should probably beat me up a bit because I broke my own rule. Earlier, I said this about MTDP:
- If you see a particular something that you could fix that shows up in the dumps on two or more threads that are under load, it is worth fixing.
and the thread dumps didn’t meet this criteria, yet I plodded ahead with the optimization and got roughly a 20% throughput boost. Early in this chapter, we added the Thread.sleep() to littleMock UI and easily found the Thread.sleep() in the thread dumps. That was an obvious problem, but this one, not so much. The thread dumps showed the problem in both cases (Figure 11-4).
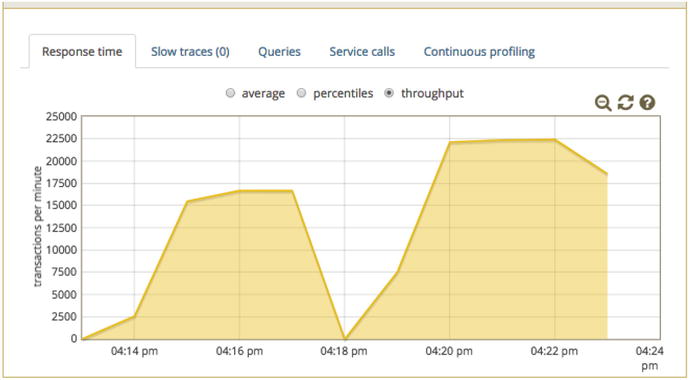
Figure 11-4.
Roughly 20% throughput boost (right test) from adding optimizations.
Limitations
There is a reason why MTDP isn’t in a book by itself—because there are a number of blind spots, when you use it alone; other tools are required to fill in the gaps. For example, the garbage collector only runs while jstack is not running. That means jstack can’t see or diagnose GC performance problems.
Likewise, the Chatty SELECT N+1 issues are part of a strategy unto themselves, and it really helps to visualize them in a SQL Sequence Diagram to fully understand the problem.
There are other blind spots, as well. Consider a container’s Web Container Max setting—the setting the limits the number of threads processing HTTP requests. If that number gets maxed out, then thread dumps will do very little to show the problem. To get around this, it might just be helpful to follow the “Raise caps before production and lower them before production” idea.
How Much Load?
I mentioned elsewhere that the P and the A in P.A.t.h. are spelled out with capital letters because they are special: most of the time, you have the luxury of being able to detect problems in those areas with just a single user’s traffic, and thus avoid the hassle of creating a load script and finding a performance environment. Well, here we are in the “t” part of the checklist and load is required here. The sampling techniques only make sense when constant load is applied, and understanding cumulative impact of all the processing is key.
But how much load should be applied? Frankly, I am undecided on which of these to recommend to you:
- The Scalability Yardstick: “Run an incremental load test with four equal steps of load, the first of which pushes the app server CPU to about 25%.”
- 3t0tt, which means “Run three threads of load with zero think time.”
…but since the second idea is easier, perhaps that is the best place to start.
In fact, I think all components as big as an SOA service should undergo the torment of three threads of load with zero think time, and thread dumps should be captured during this test.
Distinguishing High Throughput and Slow Stack Traces
Much of the time when I use MTDP, I am looking for the cause of some really slow processing. In the thread dumps I would expect to see the same stack trace show up in perhaps more than 50% of the stack traces. Let’s say 6 out of 12 traces from 4 thread dumps have the exact same method.
An alternate reading of this same data is that instead of slow response time, this particular business process shows up more frequently simply because has higher throughput—it’s executed more frequently so it shows up more frequently. That sounds like a possibility, but there is an easy way to check it.
Earlier, we said that thread dumps are taken at a point at time, and any give one was captured either before, during, or after the main processing event. Have a closer look at the method that showed up in 6 of the 12 thread dumps. If the “current” mark fluctuates in these 6 stack traces is sometimes before, sometimes in the middle, or sometimes after the main processing event, I concede that high throughput is the cause of frequent occurrences.
On the other hand, if the stack trace in question has the exact same current, trigger, and entry, then this is a slow request.
MTDP and Other Examples
Dial this performance key into littleMock:
X2,J25,K25,L0,Q1,R1,S1,T1
If you take some thread dumps, you will find both of these methods showing up:
javax.xml.transform.TransformerFactory.newInstance ()
com.sun.org.apache.xalan.internal.xsltc.trax.TransformerFactoryImpl.newTransformer()
Now, take the above key and change T1 to T2 and apply the new key. Performance improves dramatically. How does T2 process so much more throughput? Search the litteMock web page for T2 and click the ‘source link.’ to find the answer.
Let’s shift gears back to the other set of examples—jpt. MTDP can diagnose a number of problems with the jpt tests. Here is the URL again for your convenience:
Consider these examples:
- jpt test 01a has really slow requests to a back-end. Run jpt test 01a, capture some thread dumps, and look for SocketInputStream.socketread0().
- jpt test 02a has many reads to a 1MB data file. The thread dumps will show a number of thread that include this method:
- com.github.eostermueller.perfSandbox.filesystem.FileSystemReader.readFile()
- jpt test 04a. This test uses a questionable table join and ends up with slow result set iteration. I had to take 5 or 6 thread dumps, but the result set iteration really shows up here:org.h2.result.ResultRemote.next(ResultRemote.java:133)org.h2.jdbc.JdbcResultSet.nextRow(JdbcResultSet.java:3240)org.h2.jdbc.JdbcResultSet.next(JdbcResultSet.java:123)com.zaxxer.hikari.pool.HikariProxyResultSet.next(HikariProxyResultSet.java)com.github.eostermueller.perfSandbox.dataaccess_1.AccountMgr1.getAccounts(AccountMgr1.java:76)
- jpt test 05b. Thread dumps show two interesting things here:
- As stated earlier, network activity will show up in a thread dump under this method: java.net.SocketInputStream.socketRead0()In this example, it’s here because of a very slow query that is missing a database index.
- See the executeQuery() call below? If you find the method that calls executeQuery(), you can find the SQL statement. I’ve highlighted the method that calls executeQuery(), and that’s where you’ll find the text of the SQL statement:com.zaxxer.hikari.pool.HikariProxyPreparedStatement.executeQuery()com.github.eostermueller.perfSandbox.dataaccess_1.AccountMgr1.getAccounts(AccountMgr1.java:73)com.github.eostermueller.perfSandbox.Controller.internalInquiry2(Controller.java:353)
So you can see from these examples the thread dumps are very powerful, shedding light on all of these problems, none of which have anything to do with BLOCKED threads.
Java Profilers can obviously find all these same problems that MTDP can find, and then some. So when should each tool be used and when? In short, use MTDP when you don’t have access to a Java profiler or APM tool. In summary, use either, use both, just use them, whatever works best/fastest for you.
Don’t Forget
We have covered a lot of ground in this chapter. We saw how to take thread dumps and identify the Entry, Trigger, and Current landmarks, and we also learned how to detect whether load is being applied to a particular thread or not. We also went over instructions for Manual Thread Dump Profiling (MTDP), and mentioned that the threads under load in thread dumps are rarely ever class/methods that are fast—instead, MTDP is an basically the exclusive club for the slow.
Then, we discussed how to plot the timeline of user activity, and determine whether the stack trace was captured before, during or after the main processing. Knowing this is essential, because if a stack trace appears slow and showed up prior to the main processing, then congratulations, you have found Main Anti-Pattern 1—Unnecessary Initialization.
Also, for one example, we inserted a 50ms Thread.sleep() and were easily able to detect that in thread dumps. MTDP is pretty impressive that it’s capable of finding an issue so small. But the example with the XML optimizations was even more impressive. I didn’t show the response time metrics, but the response time improvement for that example was less than 5ms. This shows that MTDP is not only effective, but it is very sensitive and can find issues both large and small.
So you see, there is much, much more to thread dumps than looking at blocked threads. You can actually use MTDP like it was a mini Java profiler. With such a powerful, low-overhead tool, there are all kinds of problems that you can discover in the Dark environments of this world.
Like any measurements, there will be variability, especially if you are operating in a medium to low throughput environment. Any tool you stick into an environment with low throughput will end up with variable results. That is a concern with any measurement. But just like most other profilers, MTDP does not show whether there are Garbage Collection slowdowns in your environment.
What’s Next
Since MTDP and Java profilers in general don’t have metrics for Garbage Collection, the next chapter provides a very quick way to assess GC health. There is also a great section on detecting the cause of memory leaks, so stay tuned for that.