
QuickBooks comes with loads of built-in reports that show what’s going on with your company’s finances. But having a dozen report categories with several reports tucked into each one presents a few challenges, particularly if you’re new to both business and QuickBooks.
The first challenge is knowing what type of report tells you what you need to know. For example, a profit and loss (P&L) report shows how much income and expense you had over a given time period, but a balance sheet tells you how much your company is worth.
The second challenge is finding the report you want within the different report categories. After deciding you want to compare the profit of the items you sell, for example, do you look for the corresponding QuickBooks report in the Customers & Receivables category; Sales category; Inventory category; or Jobs, Time & Mileage category? (If you guessed Jobs, Time & Mileage, you’re right.)
The Report Center is a handy way to find the reports you want. But flipping through this book can be even faster, which is why each chapter describes the built-in reports that correspond to the bookkeeping tasks the chapter covers, what they’re good for, and where you can find them.
A third challenge—for even the most knowledgeable QuickBooks aficionado—is that the built-in reports might not do exactly what you want. A date range could be off, information that you don’t want might be included, or the data could be grouped in ways that don’t make sense for your business. After using QuickBooks for a while, most businesses tweak the program’s built-in reports. This chapter explains how to customize reports to get what you want. And there’s no point in letting that customization go to waste, so you’ll also learn how to memorize your customized reports, add them to QuickBooks’ menus for fast access, and even exchange particularly handy customized reports between company files.
You’ll also learn about new report features in QuickBooks 2015. First, reports have gotten a new look that makes them much easier to read. In addition, you can now add comments to your reports. The following pages have the details.
If you know what kind of report answers your burning business question, finding that report can be as simple as dragging your mouse through the Reports menu to a likely category, and then, on the category’s submenu, clicking the name of the report you want. But if you need help figuring out what a report does and what it looks like, the Report Center could be your new best friend.
To open the Report Center, choose Reports→Report Center or, in the icon bar, click Reports. (Adding and Removing Icons explains how to add this icon to the icon bar if it isn’t visible.) The window that appears includes a clickable list of the same categories and reports as in the Reports menu. But unlike the menu, the Report Center gives you all sorts of hints for finding the right report. It also offers several shortcuts for getting to the right report fast, as you can see in Figure 23-1.
On the left side of the Report Center, you’ll initially see built-in report categories. (The categories you see change depending on whether you select the Memorized, Favorites, Recent, or Contributed tab at the top of the window; the categories that these tabs represent are described on Working with Reports in the Report Center.) To see the reports in a category, click the category’s name, like Company & Financial, Sales, or Banking.
The Report Center gives you three ways to view the reports in a category:
Grid View, shown in Figure 23-1, is ideal when you need a little help finding the right report. It displays previews of each type of report in the category selected on the left side of the window. To see more reports in that category, scroll down. Date-range info and report-related icons appear below each thumbnail. To display this view, in the Report Center’s upper right, click the Grid View icon.
List View is your best bet when you want brief hints about the right reports and want to get to those reports quickly. In this view, you can select a category on the Report Center’s left, and the titles of that category’s reports and the questions they answer appear in a space-saving list. To use this view, click the List View icon labeled in Figure 23-1.
Figure 23-1. Each report’s thumbnail shows an example of the report’s contents and its saved date range (that is, the date range the report uses if you run it without changing any settings). Below the thumbnail are several icons. The tabs at the top of the window make it easy to get to the reports you use most often: memorized reports (page 601), reports you designate as favorites (page 579), reports you’ve run recently, and reports you’ve obtained online (see the box on page 579).
Carousel View displays a sample report (one that doesn’t use your company’s accounts or data) in the center of the window. In addition to the report’s title, the question that it answers appears above the sample, such as “What are my company’s total purchases from each vendor?” for the “Purchases by Vendor Summary” report. Below the report, you can change the date range by clicking the down arrow to the right of the current range and choosing a new one. To run the report, double-click its preview or click the Run icon (the white arrow inside a green circle).
Other reports in the current category wait in the wings to the left and right of the selected report. To access these reports, either click their preview images or use the slider bar at the bottom of the Report Center window to scroll through them until the one you’re looking for appears front and center. To use this view, in the upper-right corner of the window, click the Carousel View icon (see Figure 23-1).
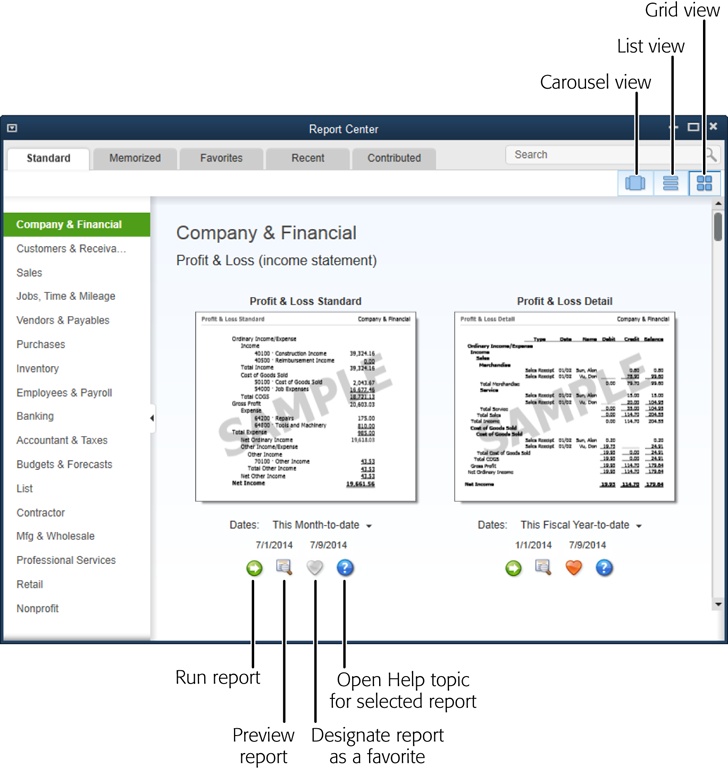
For each report in the Report Center, its saved date range setting and icons for performing report-related tasks appear below the report preview. Here’s what you can do with each one:
Date range. QuickBooks displays the name of the report’s saved date range and the dates the range represents; for example, This Fiscal Year and “1/1/2015 – 12/31/2015.” To change the range before you run the report, click the range’s name (This Fiscal Year, for example), and then choose a new range from the drop-down list, such as Last Fiscal Year. (See Choosing Date Ranges to learn about the date ranges you can choose from.)
Preview a report. For built-in reports, click the icon that looks like a magnifying glass in front of a piece of paper to see a sample of the report you’ve selected. (This icon isn’t included in Carousel View because the thumbnails act as report previews.) If you click the Report Center’s Memorized tab and then click a Preview icon, the samples just say “Memorized Report” and “Sample”; you have to run the report to see what it looks like.
Run a report. The Run icon is a white arrow in a green circle (the tooltip that appears when you point your cursor at it reads “Display Report.”) When you click this icon, QuickBooks runs the report and displays it in a report window. You can then click Customize Report in the report window’s toolbar to make changes (Customizing Reports).
Learn more. If you want to know more about a report and how you can customize it, click the “Learn more about this report” icon (the blue circle with a white question mark). QuickBooks opens the Help topic for that report, which gives hints about how to use and customize it. If you click this icon for a memorized report, QuickBooks opens the “Work with memorized reports” Help topic instead.
The Report Center initially displays QuickBooks’ built-in reports and the categories to which they belong. However, the center also offers quick access to reports that you run often:
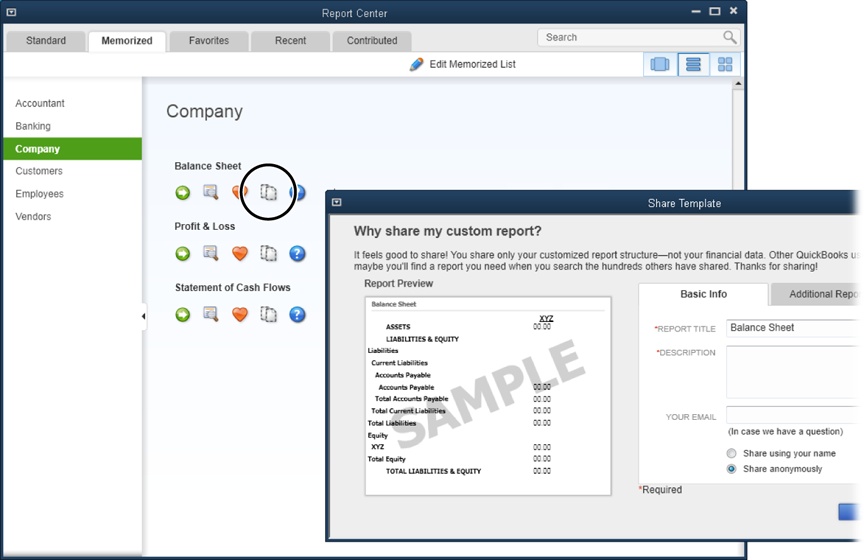
Memorized reports. If you modify reports to suit your needs, you can memorize them (Memorizing Reports) and run them again and again with all your customized settings in place. In the Report Center, click the Memorized tab to see your memorized report groups (Memorizing Reports). Select one to display the reports within it.
Figure 23-2. To share a report, click the icon circled here. In the Share Template dialog box (foreground), the “Share anonymously” option is selected automatically, but you can select the “Share using your name” option if you want some publicity for your creations. On the dialog box’s Additional Report Info tab, you can designate a category and choose the industries the report applies to.
Favorite reports. QuickBooks lets you indicate your favorite reports so you can get to them in a jiffy. The Report Center’s Favorites tab displays all the reports that you designate as favorites. Whenever you select a report in the Report Center, a Fave icon (an orange heart) appears (its tooltip says, “Mark as Favorite”). If the report is one that you run more often than you check email, simply click this icon; QuickBooks adds the report to the Favorites tab and turns the report’s heart icon gray to indicate that this is one of your favorites.
Recent reports. You can quickly rerun a report you’ve used lately by clicking the Recent tab, and then choosing the report you want. For example, if you produced a Sales by Customer report a few days ago and need to run it again, on the left side of the Recent tab, click the “Last 1-7 days” heading, click the report’s name, and then click the Display Report icon.
Search. If you don’t know which built-in report you want, you can use keywords to narrow down your choices. For example, if you want to see how much equity you have in your company, in the Search box at the Report Center’s upper right, type equity and then press Enter. A Search Results tab appears with a list of reports that include equity, such as Balance Sheet Standard, Net Worth Graph, and Balance Sheet Prev Year Comparison.
While you’re learning about QuickBooks’ reports, stick with the Report Center (described in the previous section). Once you’re more familiar with what the program’s reports do, the Reports menu is the quickest route to running them, as shown in Figure 23-3. Or you can click one of the report links scattered throughout QuickBooks’ windows, menus, and centers. (The box on Running Multiple Reports explains a shortcut you can use when you want to run several reports at the same time.)
Tip
Out of the box, when you run a report, QuickBooks automatically opens it in a report window. However, if you find yourself customizing almost every report you run, you can tell QuickBooks to open the Modify Report dialog box first (see Reminders). That way, you can make the changes you want before you see the report.
You can run reports from many locations in QuickBooks. Here’s how to run reports depending on which route you choose:
Reports menu. This menu sits in the QuickBooks main menu bar. To run a report, choose Reports, and then select the category you’re interested in (such as Memorized Reports, Company & Financial, or Vendors & Payables). On the submenu that appears (Figure 23-3), choose the report you want to run. (If another submenu appears, drag until you can pick the report you want.)
Figure 23-3. The Reports menu not only includes built-in QuickBooks reports and reports you memorize; it can also launch the Report Center and the Company Snapshot, and it contains the Process Multiple Reports feature, described in the box on page 582. In QuickBooks 2015, you can also choose Commented Reports to access reports that you or others have added comments to.
The Report Center. Select the report you want to run. If you want to change the date range before you run the report, click the current date range’s name and then choose the new one from the drop-down list. To run the report, click the green Run icon.
Favorite Reports menu. This menu is a submenu of the Reports menu. If you add a report to this menu (Finding Frequently Used Reports), you can run it by choosing Reports→Favorite Reports→[report name]. If you use the left icon bar, you can click Run Favorite Reports (in the icon bar’s middle section) to list the reports you’ve designated as your favorites. Then, in the Run Favorite Reports section that appears, click the report you want to run.
Icon bar. You can customize QuickBooks’ icon bar (Fast Access to Favorite Features) to include your all-time favorite reports or a category of reports. To run a report from the icon bar, simply click the report’s icon.
List windows. In a list window, such as the Chart of Accounts window or Item List window, click the Reports button at the bottom of the window, and then choose the report you want to run on the drop-down list that appears.
Customer, Vendor, Employee, and Inventory centers. To run reports about a specific customer, vendor, employee, or inventory item, open the corresponding center. Select a customer, job, vendor, employee, or inventory item to display info about it on the right side of the center’s window. Then click one of the report links, like QuickReport or Open Balance. In a center’s toolbar, choose Print or Excel to create a hard copy (as explained in the next section) or export an Excel file (Saving Reports as Files) of a Vendor List, Customer:Job List, Employee List, or Item List report.
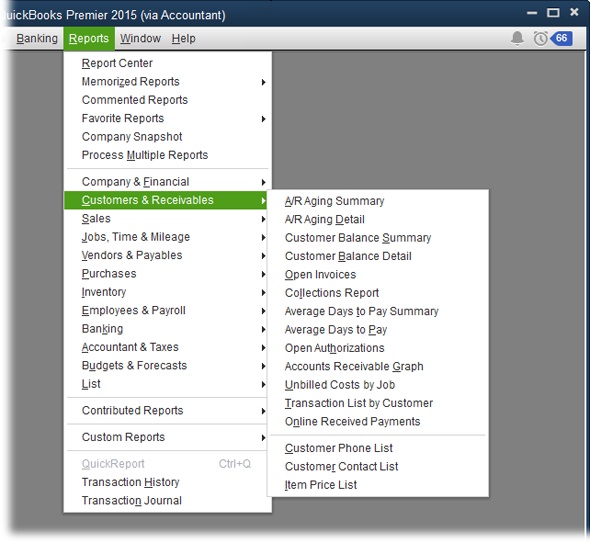
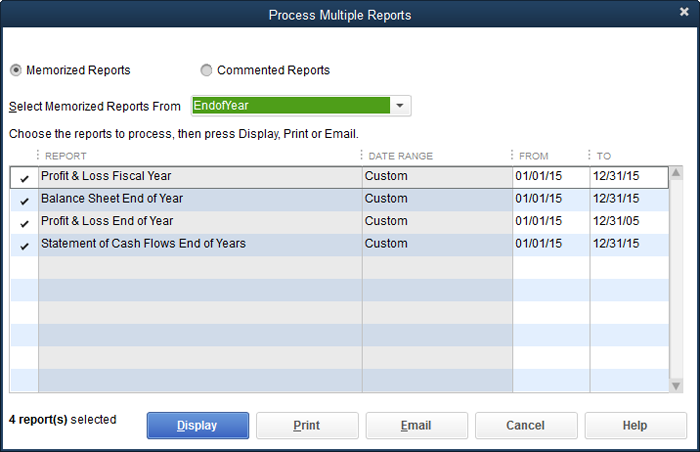
Figure 23-4. The Date Range column is grayed out because you can’t choose a different date range there. However, the From and To columns’ backgrounds are white, which means you can change the starting and ending dates for reports. (If you adjust any dates, the report’s Date Range cell changes to read “Custom.”) Simply turn on the appropriate checkmarks, and then click Display or Print to run your reports.
Note
Some features on reports should remain consistent across every report your company generates, such as whether you use cash or accrual accounting (Table 1 describes the difference between the two methods). A QuickBooks administrator can set company-wide report preferences to ensure that summary reports show financial information correctly and consistently. But even without administrator powers, you can still specify a few settings for the reports and graphs you run. See Reminders to learn how.
It takes QuickBooks time to generate some reports because they pull data from every corner of your company file. If you’re hunkering down to a report-running session of epic proportions, here are some tips for speeding things up:
Wait until everyone else has logged out of the company file.
If possible, log into QuickBooks from the computer that contains the company file. Otherwise, log into the fastest computer on your network that runs QuickBooks.
Before running reports, switch the file to single-user mode by choosing File→“Switch to Single-user Mode” (Switching Between Multi- and Single-User Mode).
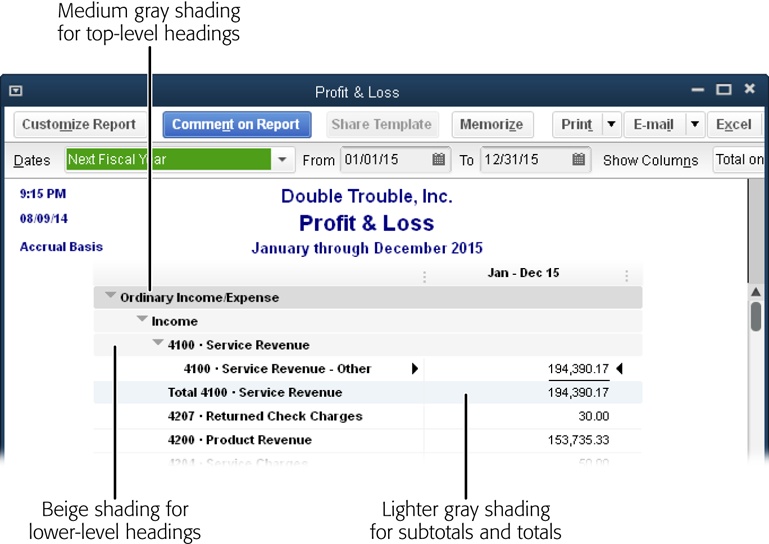
In QuickBooks 2015, report formatting received a makeover, as shown in Figure 23-5. Top-level categories are now shaded with a medium gray, lower-level categories are shaded beige, and totals are shaded a lighter gray.
Sometimes, you have information or feedback on reports that you want to share with others. For example, say you’re sending your Balance Sheet report to your accountant and you want to tell him that you haven’t recorded the fixed assets you purchased this year. Or perhaps you want to know whether the increase in product revenue is likely to continue. New in QuickBooks 2015, you can add comments to any line of a report. Here’s how:
Run the report you want, such as Profit & Loss Standard (choose Reports→Company & Financial→Profit & Loss Standard).
In the report window’s Dates box, choose the date range you want, such as This Fiscal Year.
In the report window’s button bar, click “Comment on Report.”
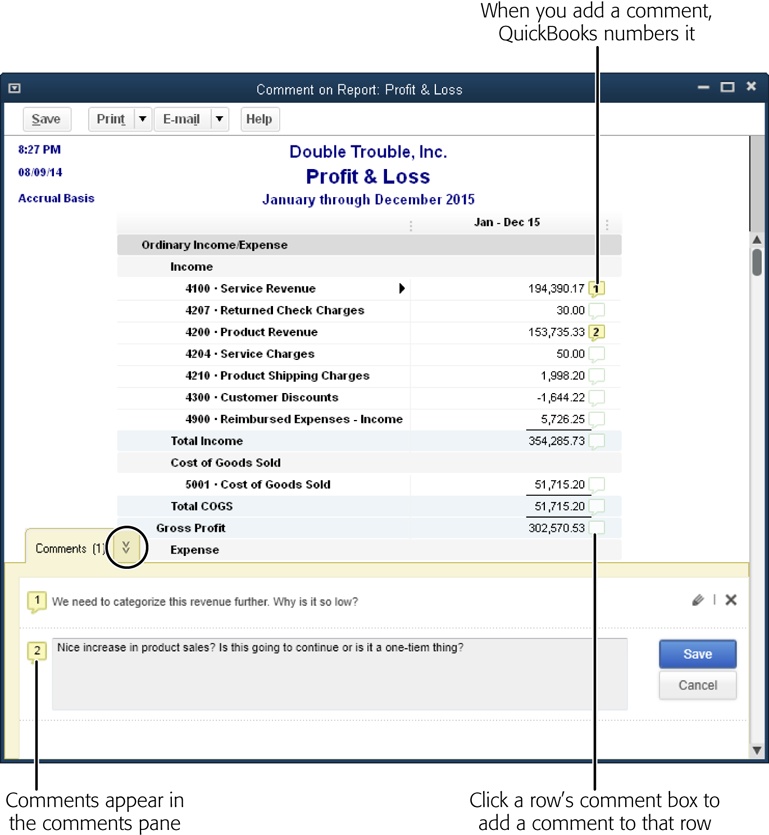
The “Comment on Report: [report name]” window opens. You’ll see small comment boxes to the right of the values in the rightmost column, as shown in Figure 23-6.
Figure 23-6. When you click a comment box, QuickBooks numbers the comment and opens a text box in the Comments pane at the bottom of the window. After you add your comment, click Save. The Comments tab displays the number of comments added to the report. To collapse the Comments pane, click the down-pointing chevron (circled). To expand the collapsed Comments pane, click the up-pointing chevron on the Comments tab (not shown here).
To add a comment to a line of the report, click that line’s comment box.
QuickBooks adds a number to the comment box to identify the comment and opens the Comments pane at the bottom of the window, as shown in Figure 23-6.
In the Comment pane’s text box, type your comment, and then click the pane’s Save button.
The comment you just added appears in the Comments pane, and the total number of comments in the report appears on the Comments tab.
Repeat steps 3 and 4 to add additional comments to the report.
QuickBooks numbers comments in the order that you add them, not in sequence from the top of the report to the bottom.
When you’ve added all your comments, click the Save button at the window’s top left.
The Save Your Commented Report dialog box opens.
In the Name box, type the name of your report, such as “P&L 2015 Questions from Blake,” and then click OK.
In the message box that tells you that the report was saved, click OK.
To close the “Comment on Report” window, click the X at its top right.
That’s it! To view commented reports, choose Reports→Commented Reports. In the Commented Reports window, double-click the report you want to open.
You can turn any QuickBooks report into either a hard copy or an electronic file. Printing a report is easy: In the toolbar at the top of the report’s window, click Print→Report. In the Print Reports dialog box that opens, QuickBooks offers most of the same printing options you find in other programs, as shown in Figure 23-7.
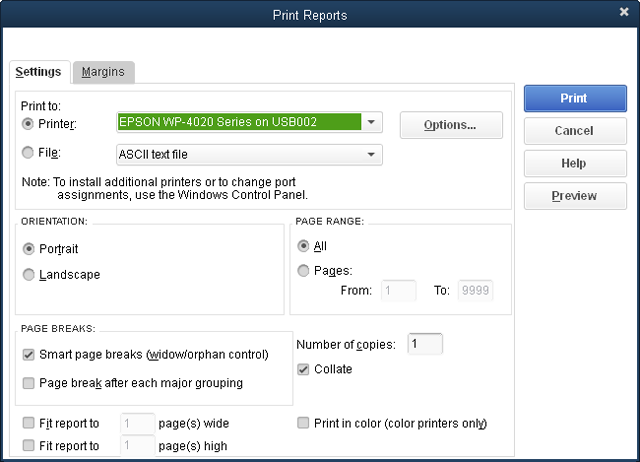
Figure 23-7. Select the Printer option here and then, in the Printer drop-down list, choose where you want to send the report. You can print reports in portrait or landscape orientation, and specify the pages you want to print, how many copies, where you want page breaks, and whether to use color. If a report is a bit too wide or too tall to fit on one page, turn on the appropriate “Fit report to” checkboxes, which force the report onto the number of pages you specify.
In the Print Reports dialog box, the Page Breaks section has two checkboxes that control where QuickBooks places page breaks:
Smart page breaks (widow/orphan control). This checkbox is turned on initially. It tells QuickBooks to insert page breaks in judicious locations to keep associated information on the same page. To stuff as much report as possible onto the fewest pages, turn off this checkbox. When you do, QuickBooks prints to the very last line of a page, even if it means that a single row of a section appears on one page with the rest of the section on another. (The box below describes other ways to squeeze more report onto a page.)
Page break after each major grouping. Turn on this checkbox (which appears only if your report is more than one page long) to add a page break after major sections of the report, like Income and Expenses in a Profit & Loss report. When this checkbox is turned off (as it is initially), the report starts new sections on the same page.
If you save a report as a file, you can feed it to other programs to edit it in ways that you can’t in QuickBooks. Intuit gives you four ways to transform reports into files. The Print Reports dialog box lets you create three kinds of files: ASCII text files, comma-delimited files, and tab-delimited files. But you can also create comma-delimited files and Excel workbooks by clicking Excel in any report window’s button bar. (The comma-delimited files that you create in either place are identical, so you can generate them whichever way you prefer.) You can also save forms and reports as PDF files or create versions to email.
Tip
If you plan to import a report into another program, go with a tab- or comma-delimited file, which uses tab characters or commas to separate each value. Many programs can read files in these formats.
Here are the four ways you can create files for reports and the differences among them:
Save to file from the Print Reports dialog box. In a report’s window, click Print→Report to open the Print Reports dialog box. Just below the Printer option is the File option, which has a drop-down list that includes “ASCII text file,” “Comma delimited file,” and “Tab delimited file.” After you choose the File option and select a type of file, click Print and QuickBooks opens the Create Disk File dialog box, which is just a File Save As dialog box where you can specify a filename and where to save the file.
Note
The ASCII text format produces a text file that looks like your report, but it uses different fonts and space characters to position values in columns. This type of file isn’t suitable for importing into spreadsheets or other programs, but you can use it to store an electronic version of your report.
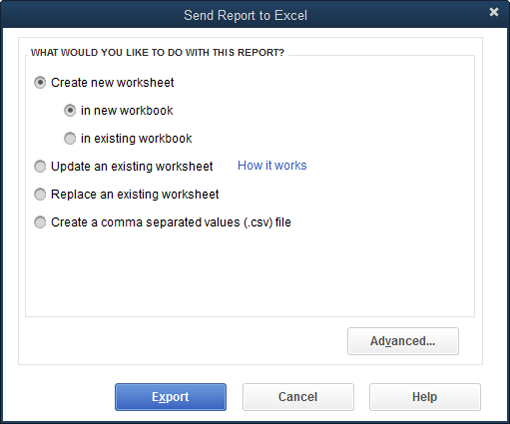
Export to spreadsheet file. In a report window’s button bar, click Excel, and then choose Create New Worksheet or Update Existing Worksheet to open the “Send Report to Excel” dialog box shown in Figure 23-8. There, depending on which option you chose, QuickBooks selects the “Create new worksheet” or “Update an existing worksheet” option. Click Export to open the report in Excel.
If you select the “Replace an existing worksheet” option, the “Select workbook” box and “Select a sheet” drop-down list appear. After you specify the workbook and worksheet that you want to replace and then click Export, QuickBooks replaces the contents of that worksheet with the report.
Figure 23-8. In a report window’s button bar, click Excel→Create New Worksheet or Excel→Update Existing Worksheet to open this dialog box. If you choose Create New Worksheet, QuickBooks selects the “Create new worksheet” option here, but you can choose whichever option you want. If you select the “Create a comma separated values (.csv) file” option, then when you click Export, the program opens the Create Disk File dialog box, which is described in this section.
Tip
QuickBooks is smart about exchanging report information with Excel. When you export a report to an existing worksheet, QuickBooks can update the worksheet while keeping most of the changes you’ve made to it, such as formulas and formatting.
If you choose the “Create a comma separated values (.csv) file” option and then click Export, QuickBooks opens the Create Disk File dialog box, where you can type a filename and choose where to save the file.
If you want to tell QuickBooks how to set up the Excel spreadsheet, before clicking Export, click Advanced, choose your settings, and then click OK. The Advanced Excel Options dialog box has three sections for setting up a report in Excel. The first section focuses on whether to transfer the fonts, colors, and spacing that you set up in your QuickBooks reports to the Excel workbook. The second section provides checkboxes for turning on Excel features such as AutoFit, which makes columns wide enough to display all the data they contain. And the third section lets you decide whether you want the report’s header to appear in the Excel header area (which appears at the top of the printed report) or at the top of the worksheet’s grid.
Save as a PDF file. To save a report as a PDF (Acrobat) file, run the report and then, in the report window, choose Print→Save As PDF. In the “Save document as PDF” dialog box, navigate to the folder where you want to save the file, type a filename in the “File name” box, and then click Save.
Email an Excel file or PDF file. To email a report, in the report’s window, click E-mail, and then choose “Send report as Excel” or “Send report as PDF.”
Report windows are teeming with ways to customize reports. Some tools are easy to spot, like the buttons and drop-down lists at the top of the window. But you can also drag and right-click elements in reports to make smaller changes. This section describes all the techniques you can use to make reports display exactly what you want.
Here’s where you go to customize a report:
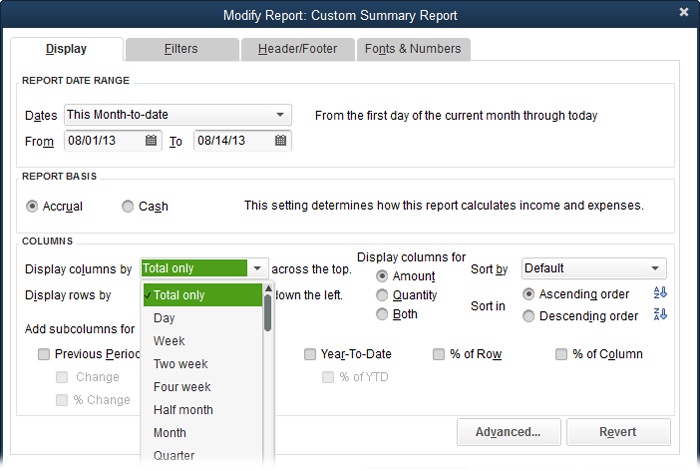
Run custom reports from the Reports menu. If you make it through all of QuickBooks’ report categories without finding the report you want, the Reports menu includes two entries for building custom reports from scratch. Choose Reports→Custom Reports and then choose Summary to build a report that displays subtotals by some kinds of categories. For instance, you could customize a summary report to create an income statement for all customers of a particular type. Choosing Reports→Custom Reports→Transaction Detail, on the other hand, lets you customize transaction reports to show exactly the fields you want.
As soon as you choose one of these custom report options, QuickBooks opens both the report window and the Modify Report dialog box—because a custom report needs some kind of customization. You can set up the contents and appearance of the report any way you want, as shown in Figure 23-9. For a custom transaction report, the Modify Report dialog box includes a list of fields that you can turn on and off, as well as checkboxes for specifying how you want to sort and total the results.
Figure 23-9. In addition to date ranges, filters, and other customizations, you can control what appears in a custom report’s rows and columns. The “Display columns by” and “Display rows by” drop-down lists include many of the same choices, so you can set up a report to show your data either across or down. (A report that uses the same category for both columns and rows doesn’t make any sense, so be sure to choose different entries for columns and rows.)
Note
The Modify Report dialog box’s “Display columns by” drop-down list includes date ranges and the “Total only” option. If you want to customize your report, you can turn on checkboxes for comparing values with previous periods as well as showing dollar and percentage differences, like Budget vs. Actual reports do.
Report window button bar. The bar across the top of a report window includes the Customize Report button, which opens the all-powerful customization tool you just learned about—the Modify Report dialog box. This bar also includes other handy customization buttons like Hide Header and Collapse, discussed in the box on Viewing More of a Report.
Report window toolbar. Below the button bar is a customization toolbar where you can choose the date range, the columns to display, and which column to use for sorting the report’s contents.
Report window. Hidden within the report itself are a few customization features. For example, by right-clicking text in a report, you can format its appearance. Dragging the three vertical dots between column headings changes the column width and, for detail reports, you can drag columns to new locations.
Different reports call for different date ranges. Financial statements, for example, typically use fiscal periods, such as the last fiscal quarter or the current fiscal year. But many companies manage month by month, so your reports may cover the current month or month to date. Payroll reports span whatever period you use for payroll, whether that’s one week, two weeks, or a calendar month. And tax reports depend on the tax periods required by the tax agencies you answer to.
The best place to choose a report’s date range depends on how much you intend to modify the report:
If the date range is the only thing you want to change, the report window’s toolbar is the way to go. In the Dates drop-down list, choose the range you want, or, in the From and To boxes, pick a starting date and ending date for the report.
If you plan to change more than the date, in the report window, click the Customize Report button. In the Modify Report dialog box that appears, the Report Date Range section includes the same date-setting features as the report window’s toolbar, as well as several additional tabs and sections for every other type of customization.
QuickBooks has two dozen preset date ranges that work based on today’s date. For example, if it’s March 15, 2015, and your company uses the calendar year as its fiscal year, then This Fiscal Year represents January 1 through December 31, 2015, but Today is simply 3/15/2015. And, if none of the program’s date ranges do what you want, in the report window’s toolbar, you can set specific start and end dates in the From and To boxes.
The preset date ranges are numerous because they mix and match several types of ranges.
Durations. Some preset periods represent durations, such as Week, Month, Fiscal Quarter, Fiscal Year, and Tax Year. At the extremes, you can pick All to encompass every date in your company file, or Today, which includes only today.
This, Last, and Next. For each duration, you can choose the current period (such as This Fiscal Quarter), the previous period (Last Fiscal Quarter), or the upcoming period (Next Fiscal Quarter).
Full and to-date. You can also pick between a full period and the period up to today’s date. For example, on March 15, “This Month” covers March 1 through March 31, and “This Month-to-date” represents March 1 through March 15.
Many of QuickBooks’ built-in reports calculate subtotals. For instance, Profit & Loss summary reports include subtotals by income, cost of goods sold, expenses, and so on. Sales reports by customer subtotal the sales for all the jobs you do for each customer.
When you run a detail report, such as Sales by Customer Detail, the report shows every relevant transaction, and you can subtotal the results in any way that makes sense for that type of report, as shown in Figure 23-10.
Depending on the report you pick, some choices in the Modify Report dialog box’s “Total by” drop-down list are more appropriate than others. For example, you might decide to subtotal a sales report by customer type, rep, or account list to see which types of customer provide the most business, which sales rep makes the most sales, or which income account pulls in the most money. If you choose a “Total by” option that doesn’t jibe with the report you’ve run, the report displays a zero balance and no rows of data.
Some reports start with only one column, but they don’t have to stay that way. Depending on the type of report, you can change its columns in several ways, like showing columns for each time period or choosing fields to display in separate columns. And if you find that your appetite for columns is larger than your monitor, you can remove, resize, and reorder report columns. This section explains all your options.
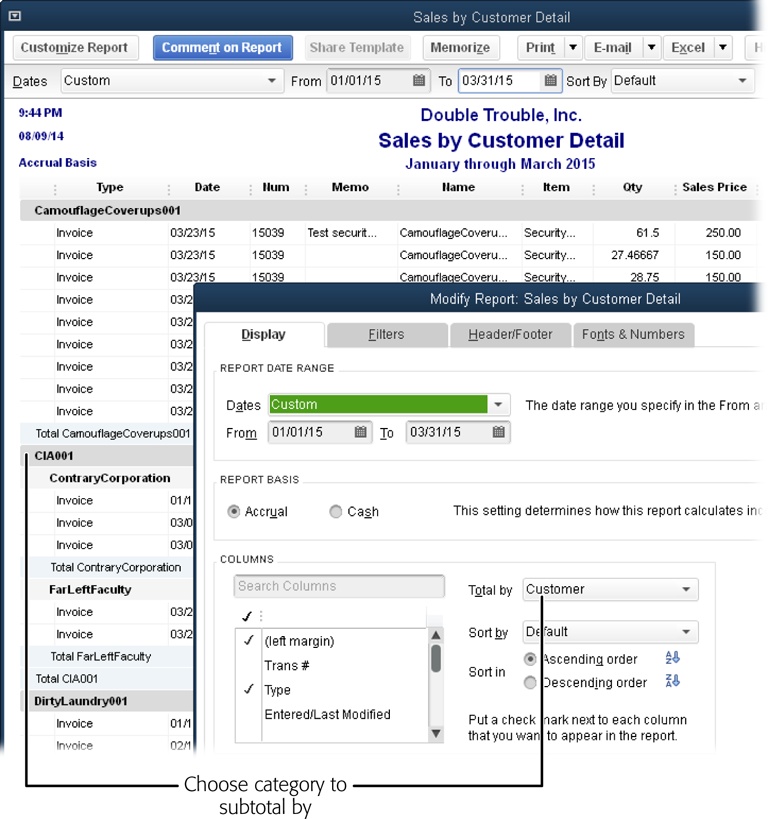
Figure 23-10. When you run a report with transaction details, QuickBooks picks a category to subtotal by. For example, the Sales by Customer Detail report starts with sales subtotaled by customer. To change the subtotal category, in the report’s window, click Customize Report. Then, in the Modify Report dialog box (foreground), choose another field in the “Total by” box, like “Class” or “Customer type.”
As you manage your business, you’ll want to see results for different date ranges in the reports you generate. For example, during a year, you might create a Profit & Loss report to show your financial status by month, for each fiscal quarter, and for the entire year. If the report window’s toolbar includes a Show Columns drop-down list (as it does for summary reports), choosing an entry there is the quickest way to change the categories that columns represent (see Figure 23-11). You can make the same changes in the Modify Report dialog box by using the “Display columns by” drop-down list.
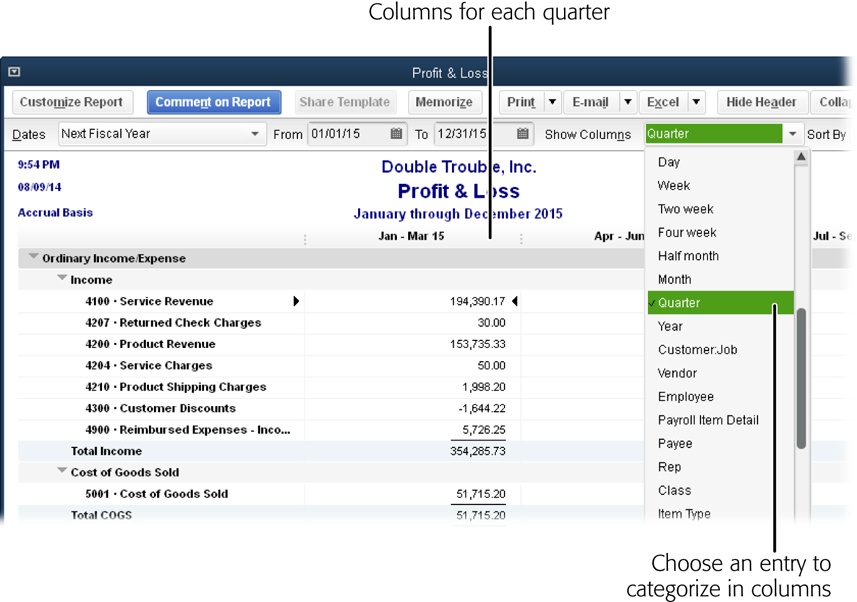
Figure 23-11. In a report window’s toolbar, the Show Columns drop-down list sets the categories for the columns in the report—basically, subtotaling by column. When you choose Quarter, for example, the report changes from a single, yearlong total to columns that subtotal each fiscal quarter (as shown here). Simply choose another category to slice results up differently. For example, choosing Class makes QuickBooks include a column for each class you use.
The Modify Report dialog box’s Display tab provides different comparison checkboxes for each type of report. For example, when you click the Customize Report button in a Profit & Loss report’s window, you’ll see checkboxes that let you compare results with the previous period, previous year, or the year to date, and show dollar and percentage comparisons. If you want to focus on the percentage difference, for instance, then turn off the “$ Change” checkbox and turn on the “% Change” checkbox instead. (If you use multiple currencies, your reports can contain currencies other than U.S. dollars. For that reason, when the multiple currency preference is turned on, the “$ Change” checkboxes are simply labeled “Change.”)
The Modify Report dialog box for some reports even includes checkboxes such as “% of Column,” “% of Row,” “% of Income,” and “% of Expense.” If you generate a profit and loss report by quarter and turn on the “% of Row” checkbox, for example, the report shows each quarter’s performance as a percentage of the full year’s results.
Reports that show transaction details, such as Profit & Loss Detail or Inventory Valuation Detail, include columns for data fields like Date, Name, Cost, and Memo. To change the columns that appear in a detail report, in the report’s window, click Customize Report, and then choose the columns you want to add or remove, as shown in Figure 23-12.
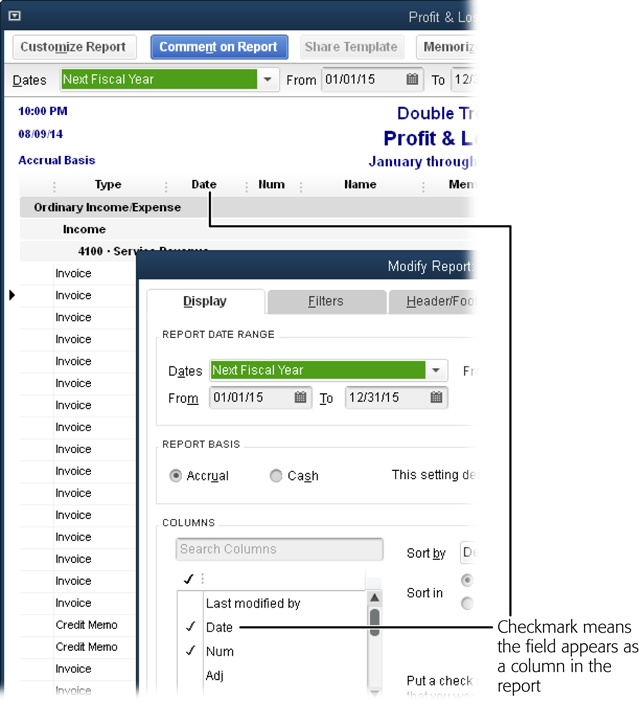
Figure 23-12. For a detail report, the Display tab of the Modify Report dialog box includes a list of fields you can choose to include as columns in the report. If a field’s name is preceded by a checkmark, click the field’s name to remove it from the report. If there’s no checkmark, click the field’s name to add it.
Some columns seem to take up more room than they need, while others truncate their contents. Figure 23-13 shows how to resize columns and rearrange the order in which they appear.
Note
When you resize columns in some reports, like ones with columns for each month, a Resize Columns dialog box asks if you want to set all the columns to the same size. Click Yes to resize all the columns, or No to resize only the one.
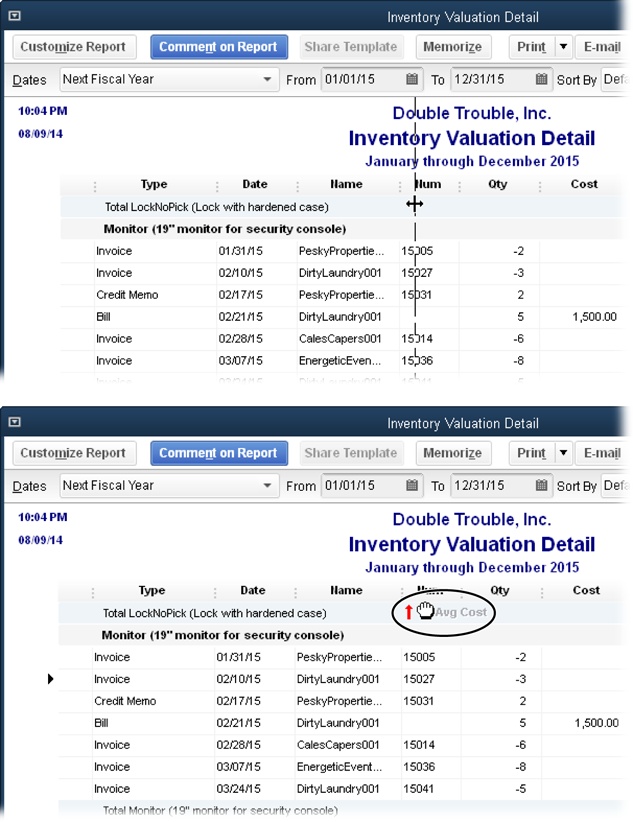
Figure 23-13. Top: Three vertical dots indicate the end of a column heading. If you mouse over one of these dividers, your cursor turns into a two-headed arrow. Drag to the right to make the column on the left wider, or to the left to make that column narrower. Bottom: In detailed and list reports, when you put your cursor over a column heading, it turns into a hand icon to indicate that you can move the column to another location. As you drag, the pointer shows both the hand icon and the name of the column. When you get close to the left side of a column, a red arrow (circled) appears to show where the column will end up if you release the mouse button.
Tip
To remove a column from a report, drag the three dots shown in Figure 23-13 to the left past another column’s divider.
If a report is sortable, you’ll see the Sort By box in the report window’s toolbar. When you first generate a sortable report, the Sort By box is set to Default, which means different things for different reports. For example, if you create a Sales by Customer Detail report, QuickBooks groups transactions by customer, but it sorts each customer’s transactions from earliest to most recent. (QuickBooks sorts reports by only one field at a time.)
In the Sort By drop-down list, choose the column you want to use to sort the report. As soon as you change the Sort By box to something other than Default, the Ascending/Descending button appears to the right of the Sort By box. (It has a blue arrow and the letters A and Z on it; A appears above Z when the sort order is ascending, and Z appears above A when the sort order is descending.) Clicking this button toggles between sorting in ascending and descending order.
The fields you can use to sort depend on the report. For the Sales by Customer Summary report, for example, the Sort By box lets you choose from only two columns: Default and Total. Default sorts the report by customer name in alphabetical order, whereas Total sorts the report by the total sales for each customer, from the smallest to the largest dollar amount. On the other hand, the Sales by Customer Detail report includes several columns of information, and you can sort by any of them.
Detail reports (the ones that list individual transactions) might show more information than you want. For example, a Purchases by Item Detail report could run page after page, listing your weekly purchases of Turtle Chow. Filtering a report removes transactions that don’t meet your criteria, so you can home in on just the Turtle Chow purchases from Myrtle’s Turtle Mart.
In QuickBooks, you can apply as many filters as you want at the same time. Each filter adds one test that a transaction has to pass to appear in your report. For example, when you set the date range for a report, what you’re really doing is adding a filter that restricts transactions to the ones that happened between the starting and ending dates. Then, if you want to find the sales for only your corporate customers, you can add a filter based on the Customer Type field.
QuickBooks provides dozens of filters, from the most common—such as dates, items, and transaction types—to those you won’t apply very often (if ever), such as Workers Comp Codes and FOB (that’s “free on board,” discussed on The Other Header Fields).
Built-in reports already have filters, but you can customize a built-in report by adding extra filters or editing or removing the existing ones. Here’s how:
In the report’s window, click Customize Report and then, in the Modify Report dialog box, click the Filters tab.
The left side of the tab lets you choose the field you want to filter by and specify the filter’s test. The right side of the tab lists all the filters that are currently applied.
In the left-hand filter list, select the field you want to filter by.
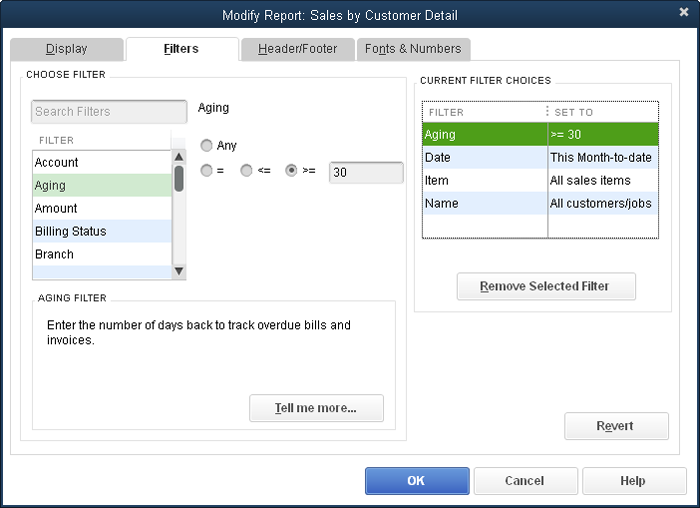
Depending on the field you choose, QuickBooks offers different criteria. Figure 23-14 shows one example.
Using the drop-down lists or options that appear, specify the filter criteria you want to apply.
For instance, if you filter by account, in the Account drop-down list, you can choose a category such as “All bank accounts”; choose “Multiple accounts” and then click each one you want to include; or click a single account. Whatever option you choose, QuickBooks adds the filter to the right-hand Filter list (in the Current Filter Choices section).
If you choose a numeric field, you can select a test, like “>=” (greater than or equal to) and then specify the test value. For example, to look for invoices that are late by 30 days or more, choose Aging for the filter, select the “>=” option, and then type 30 in the text box, as shown in Figure 23-14.
To remove a filter, select it in the right-hand Filter list, and then click Remove Selected Filter.
QuickBooks removes the filter from the list.
To edit a filter, in the right-hand Filter list, select the filter you want to change. Then, in the Choose Filter section, make the changes you want.
Click OK to see your report with the new filters applied.
You don’t have complete control over what appears in report headers and footers, but you can choose from several fields common to all of them. For example, fields like Company Name, Report Title, and Date Prepared are options for headers, and Page Number is one option for footers. To change the header and footer contents of the report you’re working on, in the Modify Report dialog box, click the Header/Footer tab (Figure 23-15).
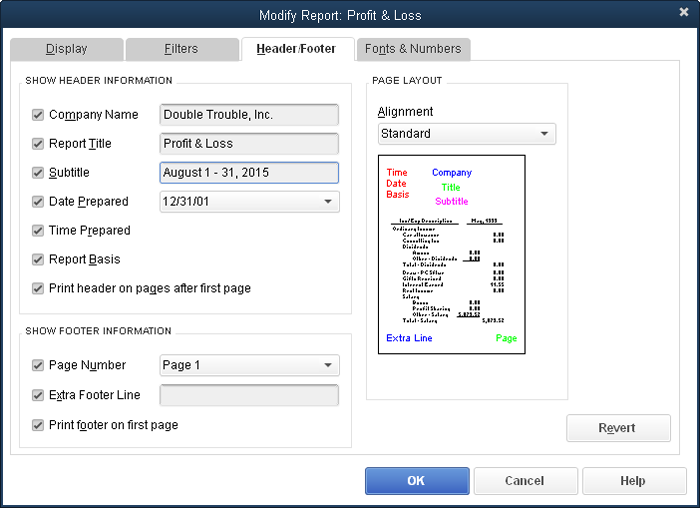
Figure 23-15. To realign the header and footer contents, in the Alignment drop-down list, choose Left, Right, Centered, or Standard. QuickBooks initially chooses Standard, which centers the Company name and title; places the date, time, and report basis (cash or accrual) on the left; and puts the extra footer line (explained below) and page number in the left and right corners of the footer.
Note
You may notice that, on the Modify Report dialog box’s Header/Footer tab, the Date Prepared drop-down list reads something like “12/31/01.” Don’t worry: That date doesn’t mean that QuickBooks gathers data from 2001. The Date Prepared setting simply lets you choose the date format that the report uses.
QuickBooks automatically pulls data from your company file to fill in the header and footer text boxes. For example, if you use a built-in Sales by Customer Detail report, the program puts your company’s name in the Company Name box. If you have a more eloquent title for the report, type it in the Report Title box.
Tip
To set standards for all report headers and footers, choose Edit→Preferences→Reports & Graphs and then click the Company Preferences tab. If the “Default formatting for reports” checkbox is turned on, turn it off, and then click the Format button. In the Report Format Preferences dialog box that appears, set the fields you want.
The Header/Footer tab’s Show Footer Information section includes an Extra Footer Line box where you can type whatever you want. This text isn’t associated with any field in QuickBooks, so it’s blank unless you enter something. Whatever you type here appears in the bottom left of the report page.
The last checkbox in both the Show Header Information and Show Footer Information sections controls the pages on which the headers and footers appear. To conserve paper, turn off the “Print header on pages after first page” checkbox so QuickBooks includes the header on the first page only. To omit the page number from the first page, turn off the “Print footer on first page” checkbox.
The right side of the Header/Footer tab is the Page Layout section, which gives you some control over the position of header and footer fields, as explained in Figure 23-15.
The fonts and formatting you use to display numbers in reports doesn’t change the underlying financial message, but an attractive and easy-to-read report can make a good impression. Just like the fields that appear in the header and footer, you can set QuickBooks’ preferences to assign the same font and number formats for all your reports (see Company-Wide Report Preferences). On the other hand, changing fonts directly in a report is quick and has the added advantage of letting you see exactly what the report looks like with the new formatting, as Figure 23-16 shows.
If you already have the Modify Report dialog box open, click the Fonts & Numbers tab. The Fonts section on the left side of the tab lists the different text elements in the report, such as Column Labels, Company Name, and Transactions. To change a font, select an element, and then click the Change Font button, which opens the same dialog box you get when you right-click the element in the report (shown in Figure 23-16).
The right side of the Fonts & Numbers tab has options for changing the appearance of numbers. Negative numbers are usually something to pay attention to in the financial world, so accountants use several methods to make them stand out. If you’re not sure which style of negative number you like, choose an option and then check out the number in the Example area. You have three style choices:
Normally. This option shows negative numbers preceded by a minus sign: –1200.
In Parentheses. This option puts negative numbers in parentheses without a minus sign: (1200).
With a Trailing Minus. This option places the minus sign after the number: 1200–.
Tip
If you use a color printer or display reports on your computer screen, they you can make negative numbers even harder to ignore by turning on the In Bright Red checkbox.
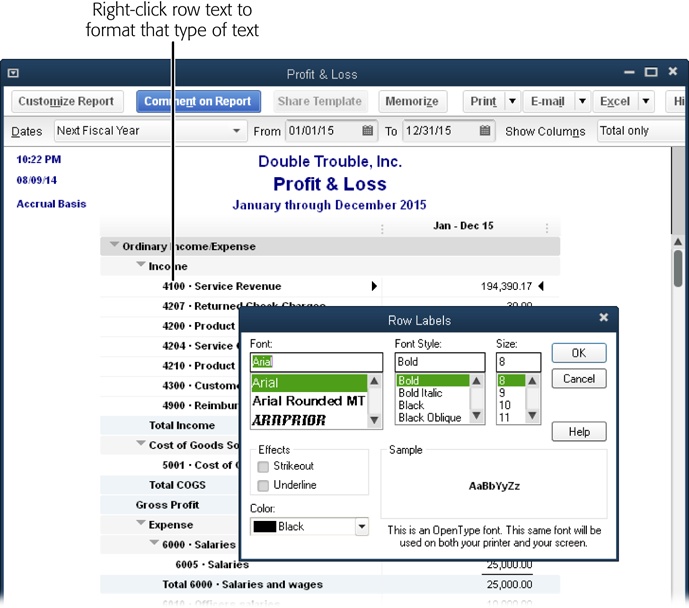
Figure 23-16. In a report window, right-click the text you want to format, such as a row label, a column label, or a value. Then change the format in the dialog box that opens (the name of the dialog box depends on which report element you’re formatting, but the choices are the same for every element). When you click OK, QuickBooks opens a Changing Font dialog box that asks if you want to change all related fonts. If you click No, it changes the font for only the element you chose. If you click Yes, it changes related elements—often the entire report. If you don’t like the format, right-click the text and try something else.
To make big numbers easier to read, in the Show All Numbers section, turn on the Divided By 1000 checkbox. This removes one trio of zeros from numbers in the report—so that $350,000,000 shows up as $350,000, for example—and adds “($ in 1,000’s)” to the report’s header. And, if a summary report (such as Customer Balance Summary) tends to contain mostly zero values, you can keep it lean by turning on the Except Zero Amounts checkbox. That way, the report omits any rows whose values are zero, such as customers who don’t owe you any money. (This checkbox doesn’t appear on the Fonts & Numbers tab if you’re customizing a transaction-based report, such as Customer Balance Detail.) Turn on the Without Cents checkbox to show only whole dollars.
If you take the time to customize a report so it looks just the way you want, it’d be silly to jump through those same hoops every time you run that report. By memorizing modified reports, you can run them again and again with all your customizations just by choosing Reports→Memorized Reports, and then picking the report’s name on the appropriate submenu.
When you memorize a report, QuickBooks remembers your settings—like date range and filter criteria—but not the data itself. So if you memorize a report whose date range is set to This Month, for example, the report shows the results for June when you run it in June and results for December when you run it in December.
Here’s how to memorize a report you’ve customized:
Review the report to make sure it has the info and formatting you want.
If you notice later that you missed a setting, you can make that change and memorize the report again.
In the report’s window, click the Memorize button.
QuickBooks opens the Memorize Report dialog box, which is small and to the point. If you’re memorizing a standard report, the dialog box contains a Name box and a checkbox for choosing a memorized report group.
If you’re rememorizing an existing memorized report, the dialog box contains Replace, New, and Cancel buttons. Click Replace to rememorize the existing report with the new settings, or click New to create a new memorized report from the current one.
Note
You can also share memorized reports with others in the Intuit Community, as described in the box on Sharing Reports with Others. To share a memorized report while the Memorize Report dialog box is open, turn on the “Share this report template with others” checkbox.
In the Name box, type a name that indicates what the report shows, like Deadbeat Customers.
If you want to save the report in a special group, turn on the Save in Memorized Report Group checkbox, and then choose the appropriate group.
QuickBooks comes with several built-in groups like Accountant, Company, and Customers, which appear on the Memorized Reports submenu shown in Figure 23-17. But you can also create your own groups, as the box on The Memorized Group Doesn’t Exist explains.
Click OK to memorize the report.
Voilà—you’re done. If you’re going to use the report over and over, consider adding it to the Favorite Reports menu (Finding Frequently Used Reports) or to the icon bar (Adding Windows or Reports to the Icon Bar) so you can run it by choosing it from the Report→Favorite Reports menu or clicking its icon, respectively.
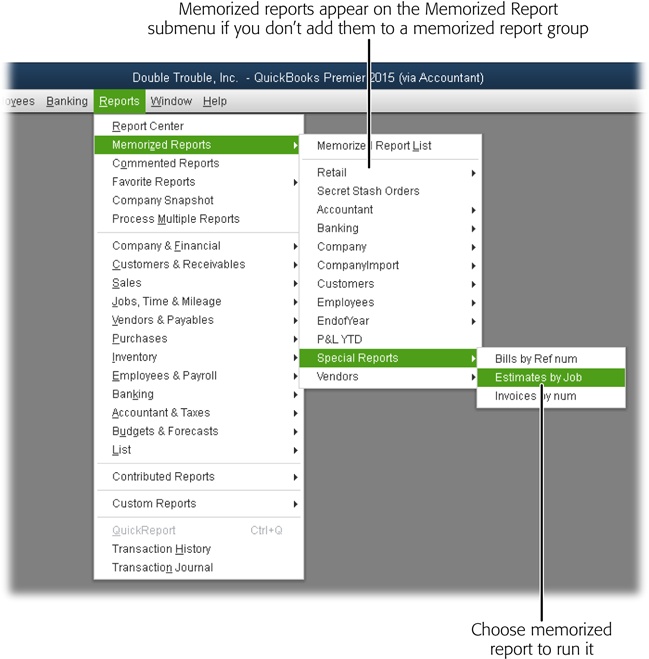
Figure 23-17. The Memorized Reports submenu displays QuickBooks’ built-in report groups and any report groups you create. To choose a report from a group, put your cursor over the group’s name, and then choose the report you want to run. If you don’t memorize a report to a group, the report appears above the groups on the submenu, like the Secret Stash Orders report listed here.
Tip
The Memorized Report List window comes in handy if you want to edit or delete reports. To display it, choose Reports→Memorized Reports→Memorized Reports List. In the window, select the report you want to work on, and then click Memorized Report at the bottom of the window. From the drop-down menu, choose Edit Memorized Report to change the report’s name or the group where it’s memorized, or choose Delete Memorized Report to eliminate it from the list.
Suppose you’re one of several business owners who meet to share ideas. Some of your colleagues rave about the QuickBooks reports they’ve customized, and you’d like to use the reports they’ve created. If they’re willing to share their ideas, you can swap reports by trading report template files. Or, if you want to share your reports with a broader audience, you can share them with the whole Intuit Community as described in the box on Sharing Reports with Others.
Report templates contain the layouts, filters, and formatting of memorized reports. Someone can export a memorized report as a report template, and someone else can then import that template to save the report in a different company file. For example, if your accountant likes to see information in very specific ways, she can give you a report template file so you can produce the reports she wants to see.
Report templates play well between different editions of QuickBooks (Premier, Pro, and Enterprise) and from version to version (2014, 2015, and so on). However, here are a couple of points to keep in mind:
If you use QuickBooks Pro, you can only import templates that others create. You need QuickBooks Premier or Enterprise Solutions to export report templates.
QuickBooks patches can affect the compatibility between versions, so you might have to install the most recent QuickBooks update if you want to use someone else’s report templates. (If there’s an update or version incompatibility issue with a report template you try to import, QuickBooks displays a warning to let you know.)
You can export report templates only if you have QuickBooks Premier or Enterprise Solutions. Whether you export one report or an entire group, QuickBooks stores the report settings in a single file with the file extension .qbr (for “QuickBooks report”). Because report templates are meant to move between QuickBooks company files, all you have to specify are the reports you want to export and the file to which you want to export them. Here’s the process:
Choose Reports→Memorized Reports→Memorized Report List.
QuickBooks opens the Memorized Report List window.
Select the report or memorized group that you want to export.
For example, if your customized reports are all memorized in a group you created named Special Reports, select Special Reports.
Click Memorized Report→Export Template.
QuickBooks opens the Specify Filename for Export dialog box, which is nothing more than a Save As dialog box that automatically sets the file type to “QuickBooks Report Files (*.QBR).” The program also puts the report or group’s name in the “File name” box. If you want to use a different name (one that includes the date you exported the reports, say), type it in that box.
Navigate to the folder where you want to save the template, and then click Save.
QuickBooks saves the settings for the report(s) to the file.
The next section tells you how to import a report template.
Note
QuickBooks won’t export memorized reports with filters that reference an account, customer, or other entry specific to your company file, because those filters won’t work in a company file that doesn’t contain that account, customer, or entry. If you try to export a template for such a report, you see a message box that suggests you look for filter settings that wouldn’t work in another company file.
Importing reports from a template file is even easier than exporting report templates. In the Memorized Report List window (Reports→Memorized Reports→Memorized Report List), click Memorized Report→Import Template. QuickBooks opens the Select File to Import dialog box with the “Files of type” box set to “QuickBooks Reports Files (*.QBR).” All you have to do is navigate to the folder that contains the report template file and double-click the filename (or select the filename and then click Open).
When you do that, QuickBooks opens a different dialog box depending on whether you’re importing one report or a group:
Single report. QuickBooks opens the Memorize Report dialog box. As you would if you were memorizing a custom report of your own design, in the Name box, type the name you want for the report and, if you wish, choose a memorized report group. Then click OK to save the report template in your company file.
Report group. When you import a report group, QuickBooks opens the Import Memorized Reports Group With Name dialog box and fills in the Name box with the group’s name from the original company file, but you can type a different name. When you click OK, the program adds the group to your company file and saves all the imported reports in that group with their original names.
Note
If you try to import a report or group with the same name as a report or group that’s already in your company file, QuickBooks displays a warning and recommends that you change the name of the report or group you’re importing. Click OK and then change the imported report or group’s name before saving it.