CHAPTER 2
Asymmetry and the Crisis of Prosperity
If the crumbling of the Berlin Wall and the fall of the Soviet Union was supposed to signal “the end of history,” as political scientist Francis Fukuyama famously declared, and the dawning of a period dominated by global liberal democracies and marked by economic opportunities for everyone, you could have fooled the people of the city of Hamilton, Ontario, where I was born and raised.1
Throughout much of the 1900s, Hamilton was one of those Rust Belt boomtowns, primarily owing its prosperity to two global steelmaking companies, Stelco and Dofasco. Wages were good for industrial workers, who could afford small houses nearby and reasonably expect their children to attend college and live better lives than theirs. The middle class expanded enormously—the population grew from 253,000 in 1950 to 591,000 in 1990.2 The community was vibrant, the site of the Canadian Football Hall of Fame, theaters, museums, and the highly regarded McMaster University with its renowned medical school.
But as the Soviet Union slipped into the past, this version of Hamilton did also. Canada’s steel industry collapsed as globalization shifted the locus of the sector to lower-wage countries and more efficient startup mini-mills. Hamilton steel workers had trouble finding new jobs and the work they found often paid poorly. Their neighborhoods became less desirable; their children’s prospects bleaker. However, the well-worn tale of the industrial town ghosted by globalization is not Hamilton’s story and is not what makes Hamilton illuminating for us today. Unlike, say, Detroit or Youngstown, Ohio, Hamilton actually does not look the worse for wear. On the whole, the streets are still clean, downtown is thriving, suburban communities are still growing up around the city, and the town appears to be flush and bustling. The reason is, as industry left, high-tech moved in.3 And the region that founded its first winery in 1975 today has more than 102 wineries.4
I bring up Hamilton’s rise, fall, and rebirth (which has echoes in other places like Pittsburgh in the United States and Birmingham in the United Kingdom) because it illustrates well the nuanced complexity of the crisis of prosperity. Despite the temptation to minimize its full impact by pigeonholing it into familiar explanations, this crisis exists everywhere: it’s a Rust Belt problem, a rural problem, a “third tier” city problem. These municipalities failed to keep up with global change.
Leaders in Hamilton did the right thing by engineering a transformation of the city away from the old world into the new. Yet that only whitewashed a bad situation and worsened economic disparity while masking it. Because of the tech bonanza in Hamilton, between 1982 and 2013 the paychecks of the top 1 percent of earners—those who earn more than CA$400,000 annually—have nearly doubled, according to Canada’s Social Planning and Research Council. In contrast, the bottom 90 percent of earners, whose average wage is around CA$31,200 per year, are making only 2 percent more than they did in 1982 when adjusted for inflation. If anything, these trends have accelerated since 2013, as technology companies have become even more of a fixture in Hamilton.
This severe income gap in a town that you would not expect to be affected is a warning flag: the crisis of prosperity is pervasive, even when it is hard to see. Because it can sometimes be invisible, much more than simplistic analysis will be needed to understand the myriad characteristics of the crisis. Something besides one-size-fits-all answers will be necessary to wrestle it to the ground. But, we have no choice but to come to grips with this crisis. The threat to the world is significant. Unchecked, this crisis will infect (indeed, it already is infecting) our social, economic, and political systems in both large and less obvious ways.
When the general population is not prospering, societies are in deep trouble. Real and felt prosperity are absolute requisites for countries or regions to function effectively. When people do not feel prosperous, they don’t buy, dream, launch new businesses, pay sufficient taxes, or otherwise contribute to growth. And they are more anxious, which results in greater amounts of drug and alcohol abuse, domestic violence, and self-harm, and less inclination to participate in routine community activities. Rather, when people do not feel prosperous, they become more insular, seeking out others like themselves. In turn, society fractures. Not surprisingly, people who have no hope for a better future draw the conclusion that those who are running the world (or those who just seem to be better off) are the cause of their misery—and the fissures among different economic and social strata widen. In desperation, people are more inclined to lash out by trampling on traditional norms and rejecting institutions that society needs to flourish.
Perhaps the best way to lay bare the layers of asymmetry in the world and explore their component parts—to develop targeted antidotes—is through the lens of the four leading geopolitical players that have dominated the world since the end of the Cold War: China, the European Union, Russia, and the United States. Each player vies for global spheres of influence using a variety of weapons—ranging from trade to regulation to currency to social media to military might—to outpace the other.
As this competition heats up, neglected or unaddressed by the global powers are their own notable crises of prosperity. Even as they strive to write the rules of engagement for the rest of the world, these nations and regions have three distinct segments of their populations with consequential challenges of prosperity that are only getting worse. Together these three cohorts form the vast majority of the population of each country or region. It is not to exclude the rest of the world that we focus on China, the European Union, Russia, and the United States, but if they are facing severe asymmetry, imagine what everyone else is going through.
Young and Falling Behind
As a former professor and dean, I have seen many people go off to start their careers all over the world. Some decades back, that rite of passage was a joyous one with a lot of optimism that these Duke graduates had nothing but blue skies ahead. If they made the right decisions, they would almost certainly succeed professionally and financially—and relatively quickly. I don’t feel that way anymore. Recent college graduates trying to make their way in Berlin, Moscow, New York, or Shanghai confront remarkably similar challenges. These young people are living a life quite different from that of their parents a few decades earlier. In most cases, they are financially not for the better. There are several reasons for this.
First, young people today are having trouble keeping up with prior generations because of the high cost of shelter in major cities. Take, for instance, the larger cities in China (Figure 2.1). In Shanghai the cost of a house is just under forty times the annual income of an average worker. To put this in perspective, lenders typically advise against buying a house valued at more than three times a person’s income. In London, New York, or Paris, average house price to income ratios are lower than in China but still well above desirable levels. Given these prices, it is not surprising that many young people view home ownership as an unreachable goal.
Some young professionals earning a good salary can find other ways to live decently in big cities through apartment sharing or other creative means. But many graduates cannot find well-paying jobs (working instead in lower-paying service industries as bartenders and as servers in restaurants, for example) and do not have this option. They have to accept substandard living conditions or long commutes that consume much of their discretionary income.
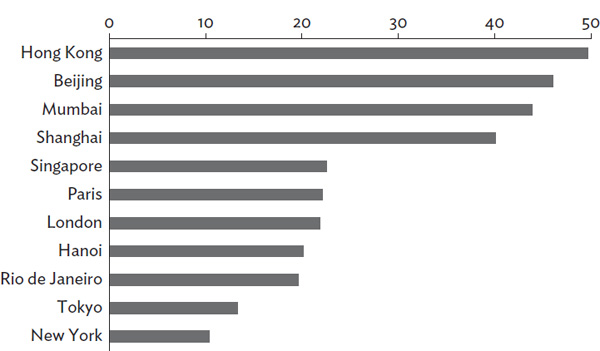
FIGURE 2.1 Average house price–to-income ratio for select cities, 2019. SOURCE: https://www.numbeo.com/property-investment/.
Of course, not every region has the burden of high housing costs. For example, in Germany, fewer people are concentrated in major cities that attract the majority of young professionals; instead employment tends to be spread among midsized urban areas throughout the country. Consequently, real estate costs are relatively equal in cities with similar population sizes. That may be changing, though. Berlin is beginning to look a bit more like Paris and London every year; currently, the price-to-income ratio in Berlin has crept up to just over 10.5 According to the Moscow Times, Moscow’s real estate prices rose 8.9 percent in 2018, sixth in the world on CBRE’s Global Living report, although the overall cost of living remains exceptionally low.6
The second reason young people are entering adulthood behind the eight ball concerns worsening disparities in who controls most of the wealth in a given region. It is the rare college graduate who enters the job market with a salary anywhere approaching the top income levels or with prospects of getting there soon. Those that do are outliers—perhaps they invented something really important in high school or college, or they entered a thriving family business. The problem is, those on the top rung are keeping more to themselves and this is not only a uniquely Anglo-American or even a capitalist problem. Whether it be China, Europe, Russia, or the United States, the line reflecting the percentage of the wealth held by the top 10 percent has steadily grown since 1980 (Figure 2.2).
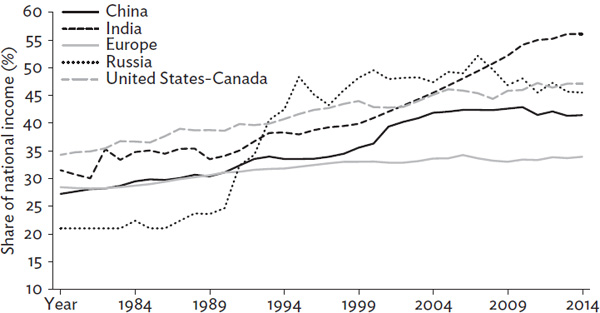
FIGURE 2.2 Top 10 percent income share across the world, 1980–2015. SOURCE: https://wid.world/world/#sptinc_p90p100_z/US;FR;DE;CN;ZA;GB;WO/last/eu/k/p/yearly/s/false/25.253500000000003/80/curve/false/country.
Adding to this cost-of-living challenge are rising debt levels for college graduates. Graduates leave school not only confronting expensive housing but saddled with debt. The United States leads in this area with college debt approaching $1.5 trillion. Things are a bit better in China, because typically parents have sacrificed to help their child through college. Thus college kids in China have a different kind of burden: the obligation to be a success to pay back their parents’ expensive belief in them. According to the Financial Times, UK university graduates have an average debt of £44,000 (US $57,519) upon graduation, compared with £16,200 (US $21,177) five years earlier.7 Even in countries with no matriculation costs, students are still borrowing. In tuition-free Sweden, for example, 70 percent of graduates have student loans, typically totaling 172,000 kronor (US$18,174).8
The high cost of education would be palatable if students were being well-prepared for the future and there was good work available when they graduated. As someone who has worked on curriculum redesign throughout my career, I know two things to be true: (1) curricula are not just based on the needs of students but also the interests and political preferences of the faculty; and (2) curriculum redesign is a hard and slow process. In truth, the world is changing at a pace faster than curricula can keep up.
Finally, today’s graduates are beginning their journey as tax-paying citizens in countries that are very old and getting older every year. At first glance, this could be seen as a good thing as their options for work are greater, there is less competition, and work is opening up due to an aging population, but consider the financial burden being handed to these graduates. As the population ages, the fraction of a person a single taxpayer will have to support through their taxes (the dependency ratio) will rise in concert. In the four regions we focus on here, this ratio began climbing around 2010 and will continue to grow through the century. The population group on the receiving end of this expensive demographic divide is the subject of the next section.
Retiring Broke
It is interesting to approach that point in life when one begins to ask the question, What would it be like to consume my savings rather than continue to contribute to them? I count myself as fortunate in this regard, because I have done pretty well in life and saved with this date in mind. Nonetheless, it is scary to contemplate potential black swan events that could wipe out a lifetime of savings or make them irrelevant, such as rampant inflation, deep depression, or global war. Yet there are many living in the four regions under discussion in this chapter who have much more worrisome and immediate problems.
Let’s start with the United States. In 1978, Congress created 401(k) plans, which allow employees to avoid tax on deferred compensation saved for retirement. On the face of it, these retirement accounts seem like a plus, giving individuals an inexpensive way to set up personal pensions by investing a part of their pretax earnings usually in mutual funds. Instead, this well-intentioned program has taken an axe to the prosperity of many retirees. Since 401(k)s were debuted, the percentage of US employees in the United States with defined benefit plans—traditional pensions, where people receive a guaranteed amount of money in retirement—fell from just over 60 percent to approximately 10 percent from 1980 to 2006, while the percentage with a 401(k)-like defined contribution plan grew from 17 percent to more than 65 percent, a complete reversal (Figure 2.3). In 2016, 54 percent of all of those employed in the United States had no plan whatsoever and only 8 percent were on a defined benefit pension plan. For the age group facing pending retirement—those between fifty and fifty-nine—46 percent had no plan and 9 percent had a defined benefit pension plan.9
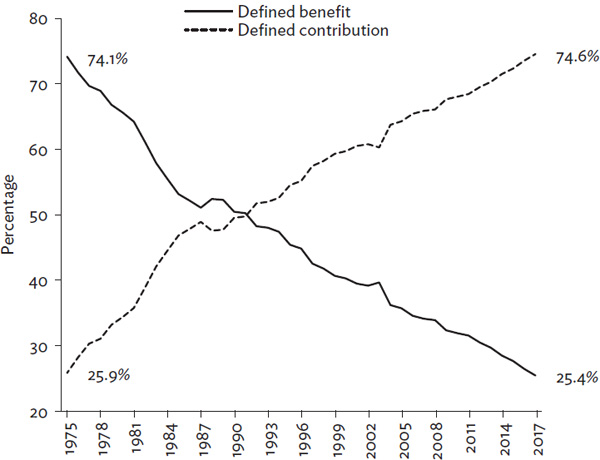
FIGURE 2.3 Percentage of participants in pension plans by pension type, 1975–2017. SOURCE: Department of Labor, Private Pension Plan Bulletin Historical Tables and Graphs, 1975–2017.
In other words, more often than not, employers used the emergence of 401(k)s as a way to get out of the business of providing retirement pensions to workers (although some offer to match a portion of employee contributions) and an alarming number of workers have no plan and are entirely self-funding their retirement.
The problem with this shift—at least viewing it through the perspective of retiree economic well-being—is that investment decisions and even the decision to participate at all in saving for retirement have been transferred to employees, many of whom are deciding to do things like sustain their existing lifestyle or fund their children’s increasingly expensive education by either drawing from their 401(k)s or not investing at all. In addition, the financial crash in 2008 decimated the value of 401(k)s, scaring a lot of individuals out of the market when their losses were at their worst. And many haven’t returned. Indeed, the largest age group leaving the market was fifty-five to sixty-five, the cohort about to enter retirement.
What all of this means is that a large number of Americans will be retiring with no real reserves and thus depending primarily on Social Security, a system itself under real strain. According to a 2019 survey, 55 percent of respondents fifty-five to sixty-five had less than $10,000 saved for retirement and about 69 percent said they had less than $50,000.10 This group will require additional support and resources not anticipated in the current system.
But what about Russia, the European Union, and China? I recently had the opportunity to take a river cruise from Moscow to Saint Petersburg with my wife and her siblings. Outside of the major cities, you find older people living under extremely difficult circumstances. The issue is not that they lack pensions. Rather, it is that the pensions are not adequate. Given Russian demographics, the country is not in a position to alleviate the problem. The number of pensioners has increased more than 10 percent since 2010, while the population growth was very small (1.4 percent) and is predicted to go into negatives, which puts significant pressure on the system to pay for the retirees.11 During this period the Russian government has held the pension steady at an average of 13,100 rubles (US$175) per month, which is extremely difficult to live on. Consequently, many retirees continue to work (Figure 2.4).
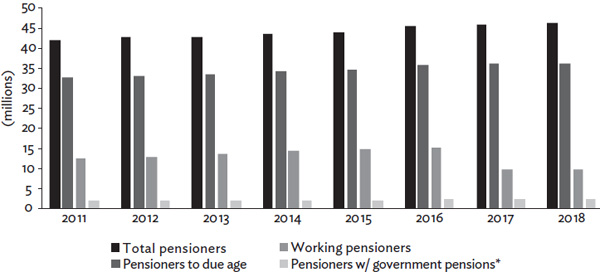
FIGURE 2.4 Number of pensioners in Russia. SOURCE: RBC Magazine, “Russia retired: how the situation of different types of pensioners in the country varies,” Ivan Tkachv, Julia Statostina, Damir Yanayev. July 5, 2018. From data from Russian Federal State Statistic Service. wwww.rbc.ru/economics/05/07/2018/5b3b6t739a79175033464791.
Moving several hundred miles to the west, Scandinavia is considered by many to be a model of social progress and success, consistently winning accolades as the region with the most satisfied populations. Yet, even here, economic asymmetry affects the old. In the countryside, Finland, Sweden, and Norway are dotted with beautiful villages often on deep, clear lakes or fjords just a few hours from the major cities. Looking closely, you can see the origins of the Norse culture, a rugged existence in which people learn that they need to care for one another if they are to survive the harsh winter conditions.
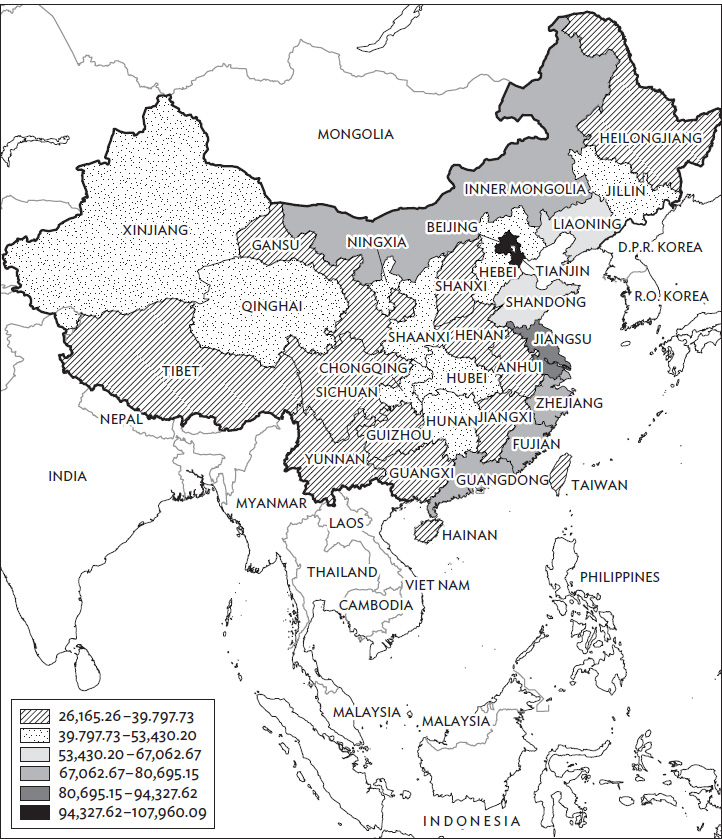
MAP 2.1 Per capita (RMB) gross regional product, 2015. SOURCE: National Bureau of Statistics of China; accessed on line January 13, 2020. http://data.stats.gov.cn/english/mapdata.htm?cn=E0103&zb=A0301. Redrawn by Bill Nelson.
But in most of these villages today the youth have left. They have gone to the cities, where jobs are available and life is more interesting. And, by and large, they did not take their parents with them. Instead, the youth took the grocery stores, banks, theaters, restaurants, doctors, and lawyers. Retirees left behind in these villages have to travel a long way to do such simple tasks as depositing money into a bank account, buying food, getting a haircut, or seeing a movie. Moreover, reasonably well-to-do retirees are getting tired of this diminished lifestyle and are leaving as well. Which means that only the least wealthy seniors have no choice but to stay and watch their homes drop in value as the village becomes less attractive. The world left them behind and seems not to care. This troubling scenario is not just taking place in the Nordic region; it is being replicated in most of western Europe as well as on the other side of the globe in Japan and China.
Regional economic disparity is a particularly difficult problem for those who cannot leave to try to overcome it. More often than not, that is the elderly. In China, for example, these misfortunate regions represent the country’s largest land mass and a sizable population (Map 2.1). A map contrasting northern and southern Europe, Moscow and Saint Petersburg with the rest of Russia, and the coastal United States versus the interior would show similar disparities and clearly reveal regions where retired people feel trapped to live.
The Encumbered Middle
But surely life is good for those who sit between those two groups, those who are midcareer, who have time to save for retirement, are well beyond student debt if they ever had it, are fully into their careers, and have already found proper housing and a good job—right? They can’t be worried about their own crises of prosperity. Hold that thought for a moment.
On my team I have people who would all be considered in the economically advantaged category. They live in Europe, Russia, and the United States. When we researched the idea of economic insecurity and its impact on people with partners in countries around the world, we clearly and relatively quickly identified the “young and falling behind” and the “retiring broke” as at risk. We debated how these issues relate to my team and their friends. We discovered that they—this third group that I have dubbed “the encumbered middle”—may be most exposed, even if it is not yet visible.
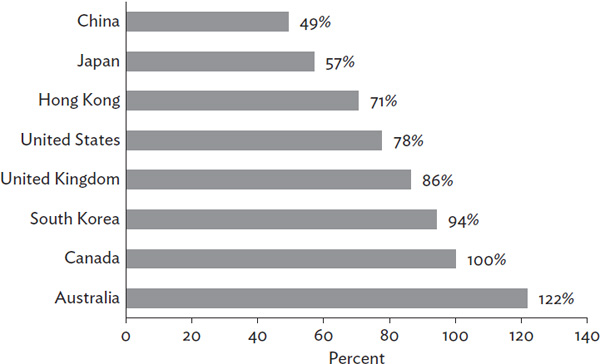
FIGURE 2.5 Household debt-to-GDP ratio of select countries, 2017 (percent). SOURCE: https://www.imf.org/external/datamapper/HH_LS@GDD/CAN/GBR/USA/DEU/ITA/FRA/JPN.
There’s a lot going on in their economic lives. They have a mortgage and frequently a car payment (Figure 2.5). They have children in school, often at some great expense as they try to make life as good as possible for their kids. And they have parents who are increasingly dependent on them. In other words, this group is carrying not only their own expenses and liabilities, but as the economic problems of the other two groups described have worsened, the encumbered middle has had to fill in the financial gaps. It was a real surprise to me to hear the undertones of fear in the conversation because I was surrounded by bright, sophisticated, and effective people; yet they’ve seen the data firsthand and know very well that for the want of a small change, “there too go I.” For this group, even success in the present is shadowed by a nagging fear sitting just over their shoulder.
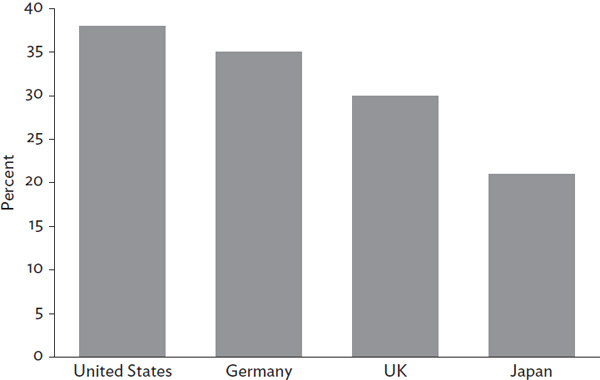
FIGURE 2.6 Potential jobs at high risk of automation, by country (percent). SOURCE: PwC, “Will Robots Really Steal Our Jobs? An international analysis of the potential long term impact of automation, 2018.” PwC analysis, based on data from the OECD Programme for the International Assessment of Adult Competencies public database http://www.oecd.org/skills/piaac/publicdataandanalysis/.
The encumbered middle has the highest need for cash flow, but it is also the group most exposed to the potential loss of work to artificial intelligence, robotics, and industry disruption. This is not just a Western problem; in fact, it may be most acute in China, where the cost of housing and education is already pushing most middle-class families to the limits of their budget. If they were laid off, which is a reasonably high risk everywhere around the world (Figure 2.6), even for a small period of time, they have little savings to fall back on. According to the Financial Times, the Chinese government’s well-publicized push to automate and become a “world superpower” in AI has resulted in the elimination of up to 40 percent of the jobs in some industrial companies since 2015.12
I do not mean to imply that other kinds of work won’t become available when these jobs go. However, the transition into new jobs for the encumbered middle will, if nothing else, be extremely challenging. No matter what their situation now, this group has a right to be worried about the future.
Prosperity Crisis in One Chart
This chapter paints a pretty worrisome picture for each of the four regions covered. Each is experiencing significant internal challenges that will grow more acute by 2030 and in many cases the challenges are not yet recognized. However, they are mutually reinforcing. Too many retirees lacking economic resources places a greater burden on the tax system, which puts additional strain on the encumbered middle. Too few people in the middle with the wherewithal to be active consumers leads to fewer good positions for young job seekers or too little tax revenue to support the region’s growing need to expand services.
Table 2.1 summarizes the challenges the three population segments discussed in this chapter will likely confront over the next decade. And they are big. Big enough that there will probably be considerable political turmoil involving domestic policies and geopolitical stances growing out of the attempts to navigate a troubling future. Although the table shows some differences across countries and regions, it is striking how often these groups face the same worries wherever they are.
The central takeaway is that each of these groups is (and is feeling) less prosperous. That is a crisis in itself. No matter how serene, rosy, and even promising the surface of the picture looks—think Hamilton, Ontario—when a large part of the population is deadly worried about how they will be able to afford to live in the present or the future, countries and regions rapidly deteriorate into dysfunction and ultimately lose sight of a path to prosperity.
TABLE 2.1 Severity of challenges for three population segments, by region.
|
United States |
China |
European Union |
Russia |
Young and falling behind |
||||
Indebtedness |
High |
Low |
Medium |
Low |
Unaffordable housing |
Mixed |
High |
Low |
Low |
Tax burden |
High |
Medium |
High |
High |
Quality of preparation for work |
Mixed |
Mixed |
Mixed |
Mixed |
Retiring broke |
||||
Underfunded retirement |
High |
High |
Mixed |
High |
Regional disparity |
Medium |
High |
High |
High |
Healthcare quality and cost |
High |
High |
Low |
High |
Dependency ratio challenges |
Medium |
Medium |
High |
Medium |
Encumbered middle |
||||
Job transition risk |
High |
High |
Medium |
Medium |
Challenge in sustaining lifestyle |
Mixed |
High |
Mixed |
High |
Parental care/tax burden |
High |
High |
High |
High |
Source: Created by the authors.