
DYNAMIC QUERIES FOR VISUAL INFORMATION SEEKING
Dynamic queries let users “fly through” databases by adjusting widgets and viewing the animated results. In studies, users reacted to this approach with an enthusiasm more commonly associated with video games. Adoption requires research into retrieval and display algorithms and user-interface design.

Some innovations restructure the way people think and work. My experience with dynamic-query interfaces suggests that they are dramatically different from existing database-query methods. Dynamic queries continuously update search results — within 100 milliseconds — as users adjust sliders or select buttons to ask simple questions of fact or to find patterns or exceptions. To accomplish this, the dynamic-query approach applies the principles of direct manipulation to the database environment:1
![]() visual presentation of the query’s components;
visual presentation of the query’s components;
![]() visual presentation of results;
visual presentation of results;
![]() rapid, incremental, and reversible control of the query;
rapid, incremental, and reversible control of the query;
In short, a dynamic query involves the interactive control by a user of visual query parameters that generate a rapid (100 ms update), animated, visual display of database search results. (This use of the term “dynamic queries” is not the same as a dynamic query in Structured Query Language, which is posted at runtime instead of compile rime.)
Although languages like SQL have become standard and form-based interfaces widespread, dynamic queries can empower users to perform far more complex searches by using visual search strategies. The enthusiasm users have for dynamic queries emanates from the sense of control they gain over the database. They can quickly perceive patterns in data, “fly through” data by adjusting sliders,2 and rapidly generate new queries based on what they discover through incidental learning.
By contrast, typing a command in a keyword-oriented language usually generates a tabular list of tuples containing alphanumeric fields. This traditional approach is appropriate for many tasks, but formulating queries by direct manipulation and displaying the results graphically has many advantages, for both novices and experts.
For novices, learning to formulate queries in a command language may take several hours, and even then they will still likely generate many errors in syntax and semantics. In contrast, visual information-seeking methods can help novices formulate queries, and presenting graphical results in context, such as on a map,’ can aid comprehension.
Experts may benefit even more from visual interfaces because they will be able to formulate more complex queries and interpret intricate results. Air-traffic control could hardly be imagined without a graphical display, for example. Visual displays also help users deal with the extreme complexity inherent in applications like network management. And statisticians, demographers, and sociologists, who deal with large multidimensional databases, can explore and discover relationships more easily using dynamic queries.4,5
EXAMPLES
An abundance of applications would benefit from this approach: Those with geographic aspects include travel agencies, hotels and resorts, and college selection; science or engineering applications include electronic circuits, networks, satellite coverage, and astronomy guides. Another likely candidate is a calendar or time-line application that shows events (concerts, meetings, conferences) selected by cost, priority rankings, or distance from home.
Geographic.
Geographic applications are natural candidates for dynamic queries. Figure 1 shows the interface of a system that lets real estate brokers and their clients find homes by using a slider to adjust for things like price, number of bedrooms, and distance from work.6 Each of 1,100 homes appears as a point of light on a map of Washington, DC. Users can explore the database to find neighborhoods with high or low prices by moving a slider and watching where the points of light appear. They can mark where they and their spouse work and adjust the sliders on a distance bar to generate intersecting circles of acceptable homes.
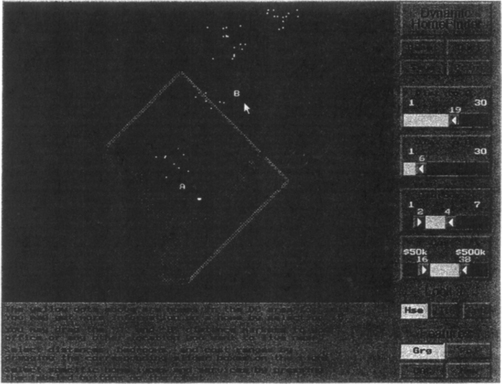
Figure 1 The DC HomeFinder dynamic-query system lets users adjust the sliders for location, cost, number of bedrooms, home type (house, townhouse, or condominium), and features. The results are shown as points of light that can be selected to generate a detailed description at the bottom of the screen.
We conducted an empirical study of the HomeFinder using 18 psychology undergraduates to compare dynamic queries to natural-language queries (Symantec’s Q&A) of the same database and to a 10-page paper listing of the same real estate data. We found that dynamic queries offered statistically significant speed advantages over either alternative for the three most difficult tasks, as Figure 2 shows. Subjective ratings of satisfaction dramatically favored dynamic queries. One subject using dynamic queries said, “I don’t want to stop, this is fun!”

Figure 2 Means for response times of 18 subjects to five queries with paper, natural-language, and DC HomeFinder dynamic-queries interfaces. The results show an advantage for the dynamic-queries interface as query complexity increased.
Another geographic application we built highlights entire US states that have cancer rates above a specified value, as shown in Figure 3.7 Users can explore the database by selecting a year or by adjusting sliders for per capita income, college education, and smoking habits. The rapid change in colors, accomplished with color indexing on the palette, lets users detect changes in cancer rates over time and in correlation with demographic variables. The US National Center for Health Statistics is distributing an extended version of this system to its statisticians.

Education.
One educational application is an element table, shown in Figure 4, that has sliders for atomic mass, atomic number, atomic radius, ionic radius, ionization energy, and electronegativity.8 Students can refine their intuitions about the relationships among these properties and the atomic number or table position of the highlighted elements.
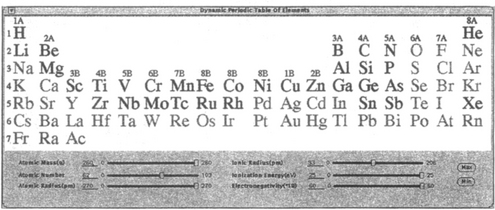
Figure 4 The chemical table of elements makes a natural visual display for information on chemical properties. Chemicals matching the query are shown in red. Runs and jumps are apparent.
We evaluated this application against a form-based query interface with a graphical output and a form-based interface with a textual output. The results for several research tasks are shown in Figure 5. The 18 chemistry students achieved much faster performance using dynamic queries.

Alphanumeric.
When there are no natural graphical displays for the output, dynamic queries can display result sets in a traditional alphanumeric tabular display. Figure 6 shows an example. In this application, the program creates the sliders and buttons semiautomatically, depending on the values in the imported ASCII database. As the users adjust the sliders with a mouse, the result bar on the bottom changes to indicate how many items remain in the result set, but the tabular display changes only when the user releases the mouse button. We adopted this policy to avoid the distraction of a frequently refreshed display.

Figure 6 Even when there is no natural graphic framework for a dynamic query display, the method can be used with tabular alphanumeric output. As users adjust the sliders and buttons for the query, the result bar along the bottom indicates how many items match. When users stop moving the sliders and let go of the mouse button, the tabular display is rewritten.
Figure 7 shows another tabular display for a dynamic query system. This one lets users explore Unix directories.9 Sliders for file size (in kilobytes) and age (in days) let users answer 10 questions, such as “How many files are younger than umcp_tai?” The results were displayed in standard long-directory display format.

Figure 7 The standard long-format tabular display is the framework for Unix directory exploration. The sliders, built with Sun DevGuide, allow selections to be made on the age (in days) and size (in kilobytes) of files. We compare color highlighting and expand/contract methods of display in an exploratory study.
We built three versions of the program and tested them on 18 users. The versions explored showing the results by
![]() highlighting matches with color,
highlighting matches with color,
![]() highlighting matches with asterisks on the same line, and
highlighting matches with asterisks on the same line, and
![]() displaying only the matching lines (that is, delete nonmatching files from the display).
displaying only the matching lines (that is, delete nonmatching files from the display).
The third approach, called expand/contract, was distracting if updates were made as the slider was being moved, so the displays were refreshed only when users stopped moving the sliders and released the mouse button. In five of the tasks there was a statistically significant speed advantage for the expand/contract interface. This result occurred only with medium-sized directories of approximately 60 entries (two screens), and not with smaller, one-screen directories. The benefits of expand/contract seem likely to grow as the directory size increases. These results help us develop guidelines and theories about how to design displays for dynamic queries.
ADVANTAGES
The dynamic query approach lets users rapidly, safely, and even playfully explore a database. They can quickly discover which sections of a multidimensional search space are densely populated and which are sparsely populated, where there are clusters, exceptions, gaps, or outliers, and what trends ordinal data reveal. Overviews like these, the ability to explore, and the capacity to rapidly specify known-item queries makes dynamic queries very appealing for certain problems.
For data in which there is a known relationship among variables, the dynamic queries interface is useful for training and education by exploration. For situations in which there are understood correlations, but their complexity makes it difficult for non-experts to follow, dynamic queries can allow a wider range of people to explore the interactions (among health and demographic variables, a table of elements, and economic or market data, for example). Finally, where there is so much data that even experts have not sorted out the correlations, dynamic queries may help users discover patterns, form and test hypotheses, identify ex-ceptions, segment data, or prepare figures for reports.
DISADVANTAGES
The dynamic query approach is poorly matched with current hardware and software systems. First, current database-management tools cannot easily satisfy these requirements for rapid searches, and rapid graphical display methods are not widely available. Therefore, we are exploring which data structures and algorithms can accommodate large data sets and permit rapid access.10
Second, application-specific programming is necessary to take best advantage of dynamic query methods. We have developed some tools, but they still require data conversion and possibly some programming. Standardized input and output plus software toolkits would make dynamic queries easier to integrate into existing database and information systems. Alternatively, dynamic queries could be generated by user-interface builders or user-interface management systems.
Third, current dynamic query approaches can implement only simple queries that are conjunctions of disjunctions, plus range queries on numeric values. Our filter/flow metaphor,11 diagramed in Figure 8, offers one approach to providing full Boolean functionality. In Figure 8, users can select from the set of attributes and get an appropriate filter widget (type-in for interest areas, sliders for cost, and buttons for scholarships) which is placed on the screen with flow lines showing Ands (sequential flow) and Ors (parallel flows). The X in each filter widget could be selected to negate the filter values. Clustering of one-in-one-out segments to form a new and saveable filter is possible. This approach was shown to be statistically significantly more effective than SQL for composing and comprehending queries, but the prototype must still be refined and implemented within a database-management system. More elaborate queries (group by, set matching, universal quantification, transitive closure, string matching) are still research-and-development problems.
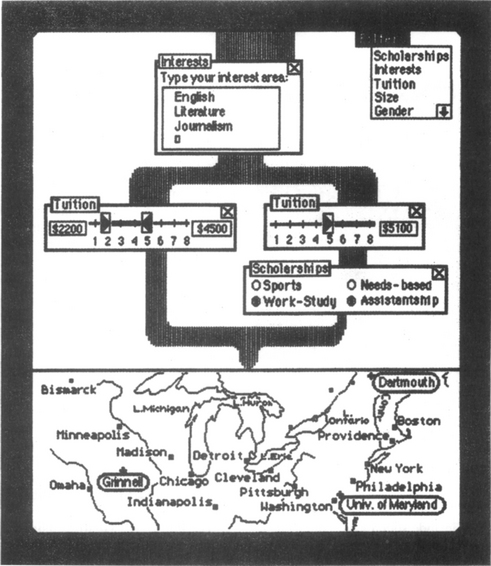
Figure 8 A mock-up of a filter/flow Boolean query ((Interests = English or literature or journalism) and ((tuition greater than or equal to $2,200 or less than or equal to $4,500) or ((tuition greater than or equal to $5,100) and (scholarships are available by work-Study or assistantship)))) combined with map output to show the result (Dartmouth, Grinnell, and the University of Maryland).
Fourth, visually handicapped and blind users will have a more difficult time with our widgets and outputs, but we are exploring audio feedback to accommodate these users as well.
RESEARCH DIRECTIONS
Our initial implementations have generated enthusiasm, but we are more aware of challenges than successes. There are rich research opportunities in database and display algorithms and user-interface design.
Database and dlsplsy algorithms.
Because rapid display updates are essential, algorithms to store and retrieve multidimensional information need refinement. For small databases that fit in main memory, we have experimented with array indexing, grid structures, quad trees, and k-d trees. We found linear array structures with pointers to be effective with small databases, but their inefficient use of storage limited the size of the databases they could handle. Grid file structures are efficient with uniform distributions, while the quad and k-d trees became more attractive as the distributions became more skewed.10
For larger databases, alternatives include R-trees, grid files, multiple B-trees, and reduced combined indices. Treating inserts and deletes to stored information separately simplifies the design of efficient data structures.
The dynamic-query approach always displays the current query result. Each new query is a slightly enlarged or contracted version of the current query. In this case, special data structures kept largely in high-speed storage and algorithms might allow rapid updates. We believe an effective strategy is to organize data in “buckets” along each dimension. The size of the bucket is adjusted to the granularity of the slider mechanism. For example, if the slider has 100 positions for a field whose range is 1 to 50,000, the data should be organized into 100 buckets, each covering 500 points on the field. As the slider increases the selected set, buckets can be appended; as it decreases the selected set, buckets can be removed. With three dimensions of 100 buckets each, the database is conveniently broken into 1 million buckets, which can be stored and retrieved efficiently.
Also important are data-compression methods that will allow larger databases to fit in 32- Mbyte or smaller address spaces. Alternatively, dynamic queries could use parallel hardware and algorithms that search multiple storage spaces.
Screen-management algorithms also play an important role, and we expect that new algorithms will become an alternative to more expensive hardware. For example, it is often more effective to merely repaint the areas or points that have changed when a slider is moved or a button depressed, instead of repainting the entire display. Our early efforts suggest that in some cases manipulating the palette by color indexing may be an effective way to rapidly change irregularly shaped regions, even on popular personal computers.7
User-interface design.
Humans can recognize the spatial configuration of elements in a picture and notice relationships among elements quickly.
This highly developed visual system means people can grasp the content of a picture much faster than they can scan and understand text.
Interface designers can capitalize on this by shifting some of the cognitive load of information retrieval to the perceptual system. By appropriately coding properties by size, position, shape, and color, we can greatly reduce the need for explicit selection, sorting, and scanning operations. However, our understanding of when and how to apply these methods is poor; basic research is needed. Although our initial results are encouraging, there are many unanswered user-interface design questions. How can we
![]() design widgets to specify multiple ranges of values, such as 14 to 16 or 21 to 25?
design widgets to specify multiple ranges of values, such as 14 to 16 or 21 to 25?
![]() let users express Boolean combinations of slider settings?
let users express Boolean combinations of slider settings?
![]() choose among highlighting by color, points of light, regions, and blinking?
choose among highlighting by color, points of light, regions, and blinking?
![]() allow varying degrees of intensity in the visual feedback?
allow varying degrees of intensity in the visual feedback?
![]() cope with thousands of points or areas by zooming?
cope with thousands of points or areas by zooming?
![]() select a set of sliders from a large set of attributes?
select a set of sliders from a large set of attributes?
![]() provide “grand tours” to automatically view all dimensions?
provide “grand tours” to automatically view all dimensions?
Display issues.
We must reexamine basic research on color, sound, size, and shape coding in the context of dynamic queries. Of primary interest are the graphical display properties of color (hue, saturation, brightness), texture, shape, border, and blinking. Color is the most effective visual display property, and it can be an important aid to fast and accurate decision making.12 Auditory properties may be useful in certain circumstances (for example, lower frequency sounds associated with large values; higher frequency with small values), especially as redundant reinforcement feedback.
We understand that rapid, smooth screen changes are essential for the perception of patterns, but we would like to develop more precise requirements to guide designers. In our experience, delays of more than two- to three-tenths of a second are distracting, but precise requirements with a range of situations and users would be helpful.
In geographic applications, sometimes points on a map are a natural choice, but other applications require overlapping areas. Points and areas can be on or off (in which case monochrome displays may be adequate), but we believe that color coding may convey more information. Texture, shape, and sound coding also have appeal.
Other issues emerge when we cannot identify a natural two-dimensional representation of the data. Of course we can always use a textual representation. Another possibility is a two-dimensional space, such as a scattergram. Instead of showing homes as points of light on a city map, they could be points of light on a graph whose axes are the age of the house and its price. We could still use sliders for number of bedrooms, quality of schools, real estate taxes, and so on.
Tree maps — two-dimensional mosaics of rectangular areas — are another way to visualize large amounts of hierarchical information. For example, we built a business application that visualized sales data for a complete product hierarchy, color-coded by profitability and size-coded by revenue.13 Twelve professional users in our usability study could rapidly determine the state of financial affairs — large red regions indicate trouble and blue areas signal success. A slider let them observe quickly the changes to the tree map over time to spot trends or problems.
Input issues.
Widget design is a central issue. Even in our early explorations we were surprised that none of the existing user-interface-management systems contained a double-boxed süder for the specification of a range (more than $70,000, less than $130,000). In creating such a slider we discovered how many design decisions and possibilities there were. In addition to dragging the boxes, we had to contend with jumps, limits, display of current values, what to do when the boxes were pushed against each other, choice of colors, possible use of sound, and so on.
We also came to realize that existing widgets are poorly matched with the needs of expert users, who are comfortable with multidimensional browsing. Two-dimensional input widgets to select two values at once are not part of any standard widget set that we have reviewed, so we created the one shown in Figure 9. Using a single widget means that only one selection is required to set two values and that correct selections can be guaranteed. In Figure 9, for example, the dotted areas indicate impossible selections (the cheapest seven-bedroom house is $310,000).

Figure 9 Two prototype two-dimensional widgets. (A) A point indicating the number of bedrooms (three) and cost of a home ($220,000) with a single selection. (B) A range of bedrooms (three to four) and cost $130,000 to $260,000).
Input widgets that can handle three or more dimensions may facilitate the exploration of complex relationships. Current approaches for high-dimensional input and feedback are clumsy, but research with novel devices such as data gloves and a 3D mouse may uncover effective methods. With a 3D mouse, users lift the mouse off the desk and move it as a child moves a toy airplane.14 The mouse system continuously outputs the six parameters (six degrees of freedom) that define its linear and angular position with respect to a fixed coordinate system in space.
Designers can decompose the rotation motion of the mouse into the combination of.
When the mouse is held as a pointer, the rotation around the handle is created by a twist of the arm, and it may be natural to users to make the same twisting motion to increase the level of a database parameter as they would to increase the volume of a car radio. Changing the pointing direction of the mouse handle is done by the same wrist flexion that a lecturer would use to change the orientation of a laser pointer to point at another part of the conference screen. It may then also feel natural to users to imagine the planar space of two database parameters as vertical in front of them and point at specific parts by flexing their wrist up, down, and sideways.
For example, sophisticated users could perform a dynamic query of the periodic table of elements using the 3D mouse. They would find elements of larger atomic mass by translating the mouse upward; for larger atomic numbers they would move to the right; for larger ionization energies they would move toward the display; for larger atomic radius they would bend their wrist up; for larger ionic radius they would bend their wrist to the right; for larger electronegativity they would twist their arm clockwise. Sliders should probably still be present on the screen, but would move by themselves and give feedback on parameter values.
Another input issue is how to specify alphanumeric fields. Although a simple type-in dialog box is possible, more fluid ways of roaming through the range of values is helpful. To this end we developed an alphaslider to let users quickly sweep through a set of items like the days of the week or the 6,000 actor names in a movie database.15
Dynamic queries are a lively new direction for database querying. Many problems that are difficult to deal with using a keyword-oriented command language become tractable with dynamic queries. Computers are now fast enough to apply a direct-manipulation approach on modest-sized problems and still ensure an update time of under 100 ms. The challenge now is to broaden the spectrum of applications by improving user-interface design, search speed, and data compression. ![]()
ACKNOWLEDGMENTS
I thank Christopher Ahlberg, Christopher Williamson, Holmes Liao, Boon-Teck Kuah, and Vinit Jain for implementing these ideas in a way that was eren better than I anticipated. Kent Norman and Catherine Plaisant made important contributions to the work and this article. This research is supported by Johnson Controls, the National Center for Health Statistics, NCR Corporation, Sun Microsysteros, and Toshiba.
REFERENCES
1. Aug. Shneiderman, B. Direct Manipulation: A Step Beyond Programming Languages. Computer. 1983; 57–69.
2. Eick, S. Data Visualization Sliders. tech. report, AT&T Bell Laboratories, Napervillie, Ill. 1993.
3. Egenhofer, M. Manipulating the Graphical Representation of Query Results in Geographic Information Systems. In: Proc. IEEE Workshop on Visual Languages. IEEE CS Press; 1990:119–124.
4. Becker, R. A., Cleveland, W. S., Brushing Scatterplots. Technometrics 1987;(No. 2):127–142.
5. Buja, A., et al. Interactive Data Visualization Using Focusing and Linking. In: Proc. IEEE Visualization. Los Alamitos, Calif. : IEEE Press; 1991:156–163.
6. Williamson, C., Shneiderman, B. The Dynamic HomeFinder: Evaluating Dynamic Queries in a Real-Estate Information Exploration System. In: Proc. SIGIR Conf. New York: ACM Press; 1983:339–346.
7. Plaisant, C. Dynamic Queries on a Health Statistics Map. In: Proc. Conf. American Statistical Assoc. New York: American Statistical Assoc.; 1993:18–23.
8. Ahlberg, C., Williamson, C., Shneiderman, B. Dynamic Queries for Information Exploration: An Implementation and Evaluation. In: Proc. CHI Conf. Alexandria, Va. : ACM Press; 1992:619–626.
9. Liao, H., Osada, M., Shneiderman, B. Browsing Unix Directories with Dynamic Queries: An Analytical and Experimental Evaluation. In: Proc. Ninth Japanese Symp. Human Interface. New York: Society of Instrument and Control Engineers; 1993:95–98.
10. to appear Jain, V., Shneiderman, B. Data Structures for Dynamic Queries: An Analytical and Experimental Evaluation. In: Proc. Advanced Visual Interfaces Conf. Japan: ACM Press; 1994.
11. July Young, D., Shneiderman, B. A Graphical Filter/Flow Model for Boolean Queries: An Implementation and Experiment. J. American Society for Information Science. 1993; 327–339.
12. Marcus, A. Graphic Design for Electronic Documents and User Interfaces. New York: ACM Press; 1991.
13. Johnson, B., Shneiderman, B. Tree-Maps: A Space-Filling Approach to the Visualization of Hierarchical Information Structures. In: Proc. IEEE Visualization. New York: IEEE Press; 1991:284–291.
14. Feiner, S., Beshers, C. Worlds Within Worlds: Metaphors for Exploring N-Dimensional Virtual Worlds. In: Proc. User Interface Software and Technology Conf. New York: ACM Press; 1990:76–83.
15. Ahlberg, C., Shneiderman, B. Alphaslider: A Rapid and Compact Selector. In: Proc. CHI Conf. New York: ACM Press; 1994.