Supporting Creativity with Advanced Information-Abundant User Interfaces
Abstract
A challenge for human-computer interaction researchers and user interface designers is to construct information technologies that support creativity. This ambitious goal can be attained if designers build on an adequate understanding of creative processes. This chapter describes a model of creativity, the four-phase genex framework for generating excellence:
• Collect: learn from previous works stored in digital libraries, the Web etc.
• Relate: consult with peers and mentors at earty, middle and late stages
• Create: explore, compose, discover and evaluate possible solutions
• Donate disseminate the results and contribute to the digital libraries, the Web etc.
Within this integrated framework, there are eight activities that require human-computer interaction research and advanced user interface design. This chapter concentrates on techniques of information visualization that support creative work by enabling users to find relevant information resources, identify desired items in a set, cm discover patterns in a collection. It describes information visualization methods and proposes five questions for the future: generality, integration, perceptual foundations, cognitive principles and collaboration.
33.1 Introduction
Ambitious visions can be helpful in shaping more concrete research agendas. Vannevar Bush’s (1945) vision of a system to support memory expansion (memex) inspired researchers for a half century in the development of what has become the World Wide Web. Engelbart’s goal of augmenting human intellect (Engelbert and English, 1968) led to innovations such as the mouse and windows. Later, Brooks’s belief in the importance of toolmaking (Brooks, 1996) led to innovations such as haptic feedback in 3D graphical environments. Hiltz’s recognition of the power of online communities (Hiltz, 1984), inspired early software development (Hiltz and Turoff, 1993) and the emergence of ideas such as the collaboratory (National Research Council, 1993). These inspirational visions were important predecessors for genex (generator of excellence), an integrated framework for creativity support tools (Shneiderman, 1998b, 1999).
33.1.1 Creativity Support
Supporting creativity is a bold ambition, but it is becoming feasible because of refined understandings of the creative processes (Rosner and Abt, 1970; De Bono, 1973; Boden, 1990; Mayer, 1992; Czikszentmihalyi, 1996; Couger, 1996) and the emergence of advanced user interfaces to support creativity (Massetti, 1996; Massetti et al., 1999). While theories of creativity vary widely, common features describe a preparatory phase that deals with the need to find information, understand the problem and explore alternatives privately, followed by discussion with peers and mentors. These steps lay the basis for an incubation phase, and moments of inspiration to break a too rigid mind set. Then come the hours of perspiration to evaluate possibilities, refine potential solutions, implement the chosen solution and disseminate it.
The diverse theories contributed to the four phases in an integrated user interface framework, called genex:
• Collect: learn from previous works stored in digital libraries, the Web etc.
• Relate: consult with peers and mentors at early, middle and late stages
• Create: explore, compose, discover and evaluate possible solutions
• Donate: disseminate the results and contribute to the digital libraries, the Web etc.
Across these four phases, at least eight activities are opportunities for research in user interface design and human-computer interaction (Shneiderman, 1999) (Figure 33.1):
• Searching and browsing digital libraries
• Consulting with peers and mentors
• Visualizing data and processes
• Thinking by free associations
• Exploring solutions - “what if?” tools
• Composing artifacts and performances
These activities are richly interwoven, for example, visualizing supports searching, exploring, reviewing etc. Each activity deserves consideration as part of a research agenda, but this chapter focuses on the third item – visualizing data and processes – and discusses its place in the broad array of genex activities.
33.1.2 Visualizing as a Support for Creativity
Visualizing is one of the eight activities that support the genex framework because visual information processing is central to many problem-solving tasks and creative explorations. Information visualization can contribute to early stages of collecting information from vast digital resources, to exploring alternative solutions and to identifying appropriate people for consultations or dissemination.
Evolutionary needs have made the human visual system extremely well adapted to recognizing patterns, extracting features and detecting unexpected items. Humans can rapidly process enormous amounts of visual information and take action rapidly. The human perceptual apparatus integrates interpretation so that people can rapidly identify familiar faces or recognize threats.
Linear or tabular presentations of text, numbers and music extend human memory, enable transmission of information across time and space, and support creativity. The process of recording an idea facilitates innovation and discovery by compelling an author to produce a coherent presentation, develop a consistent notation and present a logical argument. The linear or tabular formats enable the author and others to review, edit, refine, compare and search presentations rapidly.
The goal for visual designers is to match the task to the presentation (Tufte, 1983, 1990, 1997). Bertin (1983) dramatically portrays the possibilities by showing one hundred different presentations of information about French provinces, each suited to a specific task.
Two-dimensional visual presentations such as drawings, tree structures, flowcharts and maps have additional advantages. They can present affinities among multiple items, enabling users to see relationships that might be difficult to discover in linear textual presentations. Proximity or links in two-dimensional presentations can show rich structural relationships. Coding by size and color are easily perceived and further coding by shape, texture, rotation or markings can highlight additional relationships.
World maps are especially rich information sources that enable designers to show complex relationships while allowing users to plan trips and make further discoveries. Mental maps of information spaces and special designs such as the periodic table of elements, monthly calendars or the Linnaean taxonomy of animal phyla also support creativity. By placing known information in an orderly compact structure they support users in solving problems, planning activities and making further discoveries.
33.1.3 Information Visualization
Human perceptual abilities are remarkable and still largely underutilized by the current graphical user interfaces. Computer-based visual presentations bring additional opportunities and dangers. Adding animations such as blinking, color shifts and movements enriches the possibilities for presentations but risks overwhelming readers. However, a great benefit of computing environments is the opportunity for users to rapidly revise the presentation to suit their tasks. Users can quickly change the rules governing proximity, linking, color, size, shape, texture, rotation, marking, blinking, color shifts and movements. In addition, zooming in or clicking on specific items to get greater detail increases the possibilities for designers and users (Bederson and Hollan, 1994). The simple process of viewing a year-long display and clicking on the month and then the day enables users to get an overview and quickly move to details. A picture is often said to be worth a thousand words. Similarly, an interface is worth a thousand pictures.
A reasonable expectation of the future of user interfaces is for the growth of larger, information-abundant displays. While small portable personal devices will proliferate, the attraction of large desk-mounted or projected displays will be great. Human perceptual skills are remarkable and largely underutilized in current information and computing systems. Based on this insight, designers at several leading research centers have developed advanced prototypes and a variety of widgets to present, search, browse, filter and explore rich information spaces (Card et al., 1999).
We can define information visualization as: a compact graphical presentation and user interface for rapidly manipulating large numbers of items (102–106), possibly extracted from far larger datasets. Effective information visualizations enable users to make discoveries, decisions or explanations about patterns (correlations, clusters, gaps, outliers, …), groups of items or individual items. This definition emphasizes the user interface for control of the presentation (location, color, size, rotation, shape, texture, blinking, movement, animation and other variables).
For the purposes of this discussion, information visualization deals with abstract multidimensional and multi-variate data and is quite different from scientific visualization or 3D modeling. Scientific visualization typically deals with three-dimensional real-world phenomena such as storms, crystal growth or human anatomy, and 3D modeling typically deals with mechanical parts, architectural walkthroughs or aircraft design.
33.2 Examples of Information Visualization Supporting Creativity
One of our early visualizations was based on dynamic queries, which are animated user-controlled displays. These update immediately (no “run” button) in response to movements of sliders, buttons, maps or other widgets (Shneiderman, 1994). For example, in the HomeFinder the users see points of light on a map representing homes for sale (Ahlberg et al., 1992; Williamson and Shneiderman, 1993). As they shift sliders for the price, number of bedrooms etc. the points of light come and go within 100 milliseconds, offering a quick understanding of how many and where suitable homes are being sold. Clicking on a point of light produces a full description and, potentially, a picture of the house. A controlled experiment with 18 subjects confirmed the performance and preference advantages of dynamic queries over a natural language interface and a paper database.
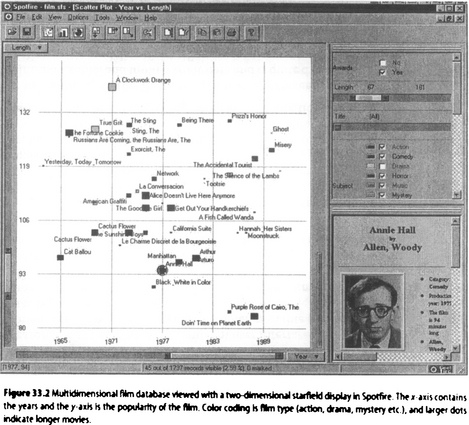
A next step was the starfield display, which was created for the FilmFinder to provide visual access to a film database (Ahlberg and Shneiderman, 1994). The films were arranged as color-coded rectangles along the x-axis by production year and along the y-axis by popularity. Recent popular films were in the upper right-hand corner. Zoombars (a variant of scroll bars) enabled users to zoom in on a single axis in milliseconds to view the desired region. When fewer than 25 films were on the screen, the film titles appeared, and when the users clicked on a film’s rectangle, a dialog box would appear giving full information and an image from the film. The commercial version of starfield displays became available late in 1996 (Figure 33.2) (http://www.spotfire.com/).
In our LifeLines prototype, we applied multiple timeline representations to personal histories such as medical records (Plaisant et al., 1996). Horizontal and vertical zooming, focusing, and filtering enabled us to represent complex histories and support exploration by clicking on timelines to get detailed information.
Information visualization supports creative work by enabling users to:
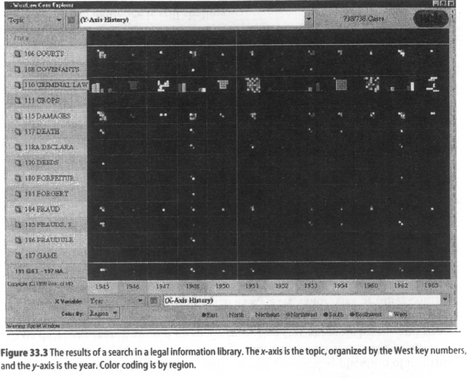
Figure 33.2 demonstrates how a digital library of films could be viewed in a way that presents large amounts of information in an orderly way. Users can understand the distribution of films in this library and find specific films to satisfy their needs. Similarly, in a legal information library, users may be seeking the relevant precedents to support their arguments. The West key number system organizes information in a hierarchy whose first three levels have 470 items, which then expands into a tree with 85 000 nodes. Figure 33.3 shows how the results of a search might be displayed to reveal where the cases fall within the key number hierarchy (Shneiderman et al., 1999). Additional information is supplied on the x-axis, currently organizing the cases by year, and by color coding, currently showing the region the case came from. This visualization makes it clear that the major topic is Criminal Law. This visualization enables users to find the relevant resources that would be very difficult to discover in a typical paged list with 20 cases per page.
A second form of creativity support is to identify items in a set. The legal information library is an example of this as well, but the drug discovery task is more typical. In this example, 379 compounds are viewed at once, organized by the amount of carbon and oxygen, color coded by dipole moment and size coded by polarizability (Figure 33.4). The unusual compound (the selected square at the upper right) is clearly visible by its distinct color coding.
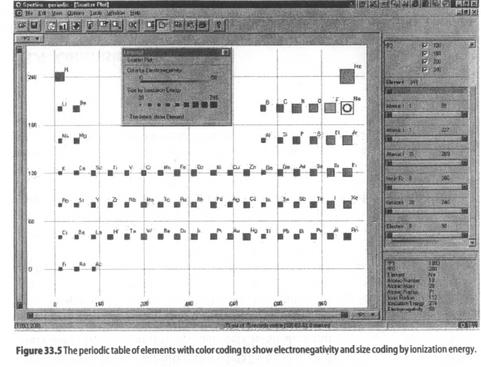
Important patterns can also be seen in visual displays. The familiar chemical periodic table of elements becomes more informative when color and size coding are added, and when users can make selections by moving the double box sliders. Figure 33.5 shows the usual layout, but the high electronegativity is immediately visible from the color coding. Figure 33.6 shows a strong correlation between electronegativity and ionization energy, with two dramatic outliers: helium and radon.
The three ways that information visualization interfaces support creativity are not a complete set, but they give designers some specific goals to work towards.
33.3 Questions for the Future
The computing industry and the research community are moving ahead with a new generation of systems. In addition to our work, research on information visualization is emerging at key sites such as Georgia Tech’s Graphics Visualization and Usability Center, Xerox’s Palo Alto Research Center and Lucent Technologies (formerly AT&T Bell Labs) in Naperville, 1L. Commercial activity ranges from expansion of existing statistical, spreadsheet, or database packages to include visualization capabilities, for example SPSS and SAS. Specialized visualization tools have emerged from new companies such as Inxight, Visual Insight, Visible Decisions and Spotfire. However, numerous questions remain that are the basis for this research agenda.
Generality: Many creativity support and information visualization tools are designed for a specific type of data and task, so generalization is an important issue. Since the range of information visualization situations includes at least 1 D, 2D, 3D, multidimensional, temporal, hierarchical and network data types, it is not clear that a single tool can be useful to a wide range of users (Robertson et al., 1993; Becker et al., 1995; Shneiderman, 1998a). Tasks include presenting meaningful overviews, zooming in on desired items, filtering out undesired items, obtaining details-on-demand, showing relationships among items, extracting information for use in other programs and keeping a history of user actions to allow review and replay. Developing general purpose tools that support the range of data and tasks would be a major step forward.
Integration: Successful support for creativity and practical application of information visualization requires a smooth integration with other tools. The results of a Web or database search should be easily imported (for example by cut and paste) into a visual presentation. Then users should be able to filter the data appropriately and adjust the visualization features, such as x, y axes, color, size or other codings. When an interesting group of items is found, users should be able to select them and paste them into a spreadsheet or statistics package for further processing. At the next stage, the visualization and processed items should be embeddable in a written report, slide presentation, or email note. Email recipients should be able to manipulate the visualization or report still further (Roth et al., 1996).
Perceptual foundations: A necessary foundation is an understanding of the perceptual principles concerning location, color, size, shape, animation and other codings (Rohrer et al., 1999). While much is known about static displays, the dynamic environment of user interfaces is in need of extensive human factors analysis. Pre-conscious recognition of small numbers of items, simple patterns or outliers from a large group occurs very rapidly (less than 400 milliseconds), but recognition of more complex relationships involving multiple colors or shapes can take much longer. Strategies for rapid panning or zooming are beginning to be understood, but comparisons between these animated approaches, distortion-oriented (fisheye) and dual views would be very helpful (Plaisant et al., 1995; Schaffer et al., 1996). Another key comparison that deserves extensive study is between 2D and 3D visual presentations (Sutcliffe and Patel, 1996). Advocates of each style claim superiority, but the empirical evidence is still shallow.
Cognitive principles: A solid theory for creativity support by way of information visualization would rest on a thorough understanding of cognitive principles to guide design (Card, 1996). Existing design principles such as direct manipulation have been demonstrated to be successful by empirical studies, and they have been widely applied in word processors, spreadsheets, drawing tools and many other environments:
• Visual representation of the “world of action”
• Rapid, incremental and reversible actions
These principles are helpful to designers but need to be more rigorous if they are to provide predictive power. Another basic principle that has been applied for browsing and searching, might be summarized as the Visual Information Seeking Mantra:
Overview first, zoom and filter, then details-on-demand
Overview first, zoom and filter, then details-on-demand
Overview first, zoom and filter, then details-on-demand
Overview first, zoom and filter, then details-on-demand
Overview first, zoom and filter, then details-on-demand
Overview first, zoom and filter, then details-on-demand
Overview first, zoom and filter, then details-on-demand
Each line represents a project in which we struggled with a design only to rediscover this principle, and therefore I wrote it down as a continuing reminder. If we can design systems with effective visual displays, direct manipulation interfaces and dynamic queries, then users may be able to responsibly and confidently take on more ambitious tasks. However, empirical studies would be helpful in assessing the benefits.
Collaboration: A key phase of genex, and many creativity models, is the process of consultation with peers and mentors (Olson and Olson, 1997). Such consultations may occur at early, middle or late stages of a creative problem solving process. Users need to conference over some materials using an appropriate communications medium such as a face-to-face meeting, videoconference, telephone, email exchange or printed documents. Therefore creativity support and information visualization tools need to make it easy for users to save, extract, replay and annotate their activities.
33.4 Conclusions
Creativity support is a risky term because it may sound vague and difficult to evaluate. However, it can become a vigorous research topic if work focuses on more identifiable user activities, such as the list of eight offered in Section 33.1.1. This chapter concentrates on the activity of visualizing and explores how information visualization techniques can support creativity. Researchers will have to deal with at least five key questions in order to develop useful software: generality, integration, perceptual foundations, cognitive principles and collaboration.
However, implementation of novel tools is not a sufficient goal. New visualizations and their use must be subjected to rigorous empirical studies to get past the developer’s bias and wishful thinking. Evaluations, ranging from controlled experiments to field trials with ethnographic observations, will validate or overturn hypotheses, refine theories, and sharpen our understanding of what to measure. Such studies are likely to be the rapid route to development of advanced information-abundant user interfaces.
Acknowledgments
I greatly appreciate my partners at IBM, NASA and WestGroup for partial support of this research. Thanks to Benjamin Bederson, David Ebert and Jenny Preece for their thoughtful comments on earlier drafts.
References
color plates Ahlberg, C, Shneiderman, B. Visual information seeking: tight coupling of dynamic query filters with starfield displays. In: Proc. ACM CHI’94 Conference: Human Factors in Computing Systems. New York: ACM; 1994:313–321.
Ahlberg, C, Williamson, C, Shneiderman, B. Dynamic queries for information exploration: an implementation and evaluation. In: Proc. ACM CHI’92: Human Factors in Computing Systems. New York: ACM; 1992:619–626.
Becker, RA, Eick, SG, Wilks, AR. Visualizing network data. IEEE Transactions on Visualization and Computer Graphics. 1995; 1(1):16–28.
Bederson, BB, Hollan, JD. PAD++: a zooming graphical user interface for exploring alternate interface physics. In: Proc. User Interfaces Software and Technology ’94. New York: ACM; 1994:17–27.
Bertin, J. Semiology of Graphics. Madison, WI: University of Wisconsin Press; 1983.
Boden, M. The Creative Mind: Myths & Mechanisms. New York: Basic Books; 1990.
Brooks, F, Jr. The computer scientist as toolsmith II. Communications of the ACM. 1996; 39(3):61–68.
Also at http://www. theatlantic. com/unbound/flashbks/computer/bushf. htm. Bush, V. As we may think. Atlantic Monthly. 1945; 76(1):101–108.
Candy, L. Computers and creativity support: knowledge, visualization and collaboration. Knowledge-Based Systems. 1997; 10:3–13.
Card, SC. Visualizing retrieved information: a survey. IEEE Computer Graphics and Applications. 1996; 16(2):63–67.
Card, S, Mackinlay, J, Shneiderman, B. Readings in Information Visualization: Using Vision to Think. San Francisco, CA: Morgan Kaufmann; 1999.
Couger, D. Creativity & Innovation in Information Systems Organizations. Danvers, MA: Boyd & Fraser; 1996.
Csikszentmihalyi, M. Creativity: Flow and the Psychology of Discovery and Invention. New York: HarperCollins; 1996.
De Bono, E. Lateral Thinking: Creativity Step by Step. New York: Harper Colophon Books; 1973.
Engelbart, DC, English, WK, A research center for augmenting human intellect. AFIPS Proc. Fall Joint Computer Conference; 1968;33:395–410.
Hiltz, RS. Online Communities: A Case Study of the Office of the Future. Norwood, NJ: Ablex; 1984.
Hiltz, RS, Turoff, M. The Network Nation: Human Communication via Computer, rev. edn. Cambridge, MA: MIT Press; 1993.
Massetti, B. An empirical examination of the value of creativity support systems on idea generation. MIS Quarterly. 1996; 20(1):83–97.
Massetti, B, White, NH, Spitler, VK. The impact of the World Wide Web on idea generation. In: Proc. 32nd Hawaii International Conference on System Sciences. IEEE Press; 1999.
Mayer, RE. Thinking, Problem Solving, Cognition, 2nd edn. New York: W. H. Freeman; 1992.
National Research Council emdash; Committee on a National Collaboratory. National Collaboratories: Applying Information Technology for Scientific Research. Washington, DC: National Academy Press; 1993.
Olson, GM, Olson, JS. Research on computer supported cooperative work. In: Helander MG, Landauer TK, Prabhu PV, eds. Handbook of Human-Computer Interaction. 2nd edn. Amsterdam: Elsevier; 1997:1433–1456.
Plaisant, C, Carr, D, Shneiderman, B. Image-browser taxonomy and guidelines for designers. IEEE Software. 1995; 12(2):21–32.
Plaisant, C, Rose, A, Milash, B, Widoff, S, Shneiderman, B. LifeLines: visualizing personal histories. Proc. of ACM CHI’96 Conference: Human Factors in Computing Systems. ACM: New York, 1996:221–227. Plaisant, C, Rose, A, Milash, B, Widoff, S, Shneiderman, B, LifeLines: visualizing personal histories. In: Proc. of ACM CHI’96 Conference: Human Factors in Computing Systems. New York: ACM; 1996:518.
Robertson, GG, Card, SK, Mackinlay, JD. Information visualization using 3D interactive animation. Communications of the ACM. 1993; 36(4):56–71.
Rohrer, R, Ebert, D, Sibert, J. A shape-based visual interface for text retrieval. IEEE Computer Graphics and Applications. 19, 1999.
Rose, A, Eckard, D, Rubloff, G. An application framework for creating simulation-based learning environments. University of Maryland Department of Computer Science Technical Report CS-TR-3907. 1998.
Rosner S, Abt LE, eds. The Creative Experience. New York: Dell Publishing, 1970.
Roth, SF, Lucas, P, Senn, JA, Gomberg, CC, Burks, MB, Stroffolino, PJ, Kolojejchick, JA, Dunmire, C. Visage: a user interface environment for exploring information. In: Proc. Information Visualization ’96. Los Alamitos, CA: IEEE; 1996:3–12.
Schaffer, D, Zuo, Z, Greenberg, S, Bartram, L, Dill, J, Dubs, S, Roseman, M. Navigating hierar-chically clustered networks through fisheye and full-zoom methods. ACM Transactions on Computer-Human Interaction. 1996; 3(2):162–188.
Shneiderman, B. Dynamic queries for visual information seeking. IEEE Software. 1994; 11(6):70–77.
Shneiderman, B. Designing the User Interface: Strategies for Effective Human-computer Interaction, 3rd edn. Reading, MA: Addison-Wesley; 1998.
Shneiderman, B. Codex, memex, genex: the pursuit of transformational technologies. International Journal of Human-Computer Interaction. 1998; 10(2):87–106.
Shneiderman, B. Creating creativity for everyone: User interfaces for supporting innovation. Univ. of Maryland Dept of Computer Science Technical Report. 1999.
Shneiderman, B, Feldman, D, Rose, A. Visualizing digital library search results with categorical and hierarchical axes. University of Maryland Department of Computer Science Technical Report CS-TR-3992. 1999.
Sutcliffe, A, Patel, U, 3D or not 3D: is it nobler in the mind?. Proc. British HCI Conference. 1996:79–94.
Tufte, E. The Visual Display of Quantitative Information. Cheshire, CT: Graphics Press; 1983.
Tufte, E. Envisioning Information. Cheshire, CT: Graphics Press; 1990.
Tufte, E. Visual Explanations: Images and Quantities, Evidence and Narrative. Cheshire, CT: Graphics Press; 1997.
Reprinted in. Williamson, C, Shneiderman, B. The Dynamic HomeFinder: evaluating dynamic queries in a real-estate information exploration system. In: Proc. ACM SIGIR’92 Conference. Copenhagen, Denmark, June. 1992:338–346Shneiderman B, ed. Sparks of Innovation in Human-Computer Interaction. Norwood, NJ: Ablex; 1993:295–307.


