Hierarchical Visualization with Treemaps: Making Sense of Pro Basketball Data
David Turo, Human-Computer Interaction Laboratory, University of Maryland, A.V. Williams Bldg., College Park, MD 20740, Tel: 1–301–405–2725. E-mail address: [email protected]
ABSTRACT
Treemaps support visualization of large hierarchical information spaces. The treemap generation algorithm is straightforward and application prototypes have only minimal hardware requirements. Given primary graphical encodings of area, color and enclosure, treemaps are best suited for the tasks of outlier detection, cause-effect analysis and location of specific nodes—satisfying user-specified criteria—in their hierarchical context. Distortion effects extend treemap capabilities by emphasizing node relationships in the diagram.
INTRODUCTION
The large information spaces of today can only be harnessed by new and innovative visualization tools that provide overview, exploration and dissection capabilities. Current software for data exploration of even moderately-sized spaces falls short in providing this data-harnessing functionality; users are asked to keep information in mind, use navigational tools such as scrollbars to view small chunks of data at a time, and piece together a data space bit by bit as a consequence.
Treemaps were developed to manage large hierarchical information spaces without requiring workstation-class hardware; prototypes have been implemented on a variety of platforms including 386 class DOS machines, Macintosh 68030 machines and Sun workstations. Treemaps are generated via a simple recursive slicing algorithm that partitions a rectangular screen area using a numeric weighting attribute; the direction of the slice is reversed at each tree level [2, 3]. All nodes map to individual rectangles on the treemap; rectangular enclosure is used to convey parent-child relationships (Figure 1). As the algorithm uses all of the provided screen space, the treemap can display about an order of magnitude more nodes compared to traditional methods such as tree diagrams; exact amounts depend on both screen resolutions and the statistical distribution of the weighting attribute used by the treemap algorithm.

Figure 1 The four NBA divisions are displayed, sliced into teams and then players. The weighting attribute is points per season.
Many enhancements, outlined in the accompanying video and [5], have been added to the treemap since its inception. As the true benefits of the diagram can only be appreciated when the domain is familiar or of personal importance, the video explores the familiar domain of NBA basketball player statistics (1991–92 season data were used with 48 numeric attributes for over 450 players in the league).
Spreadsheets have traditionally been used to analyze this type of data with tables upon tables of different and intriguing statistics. Digesting a table of over 450 players is a difficult task, however; treemaps provide a solution to this problem through their visualization capabilities.
GRAPHICAL PROPERTIES AND TASKS
Area, color and enclosure are the inherent graphical properties of treemaps that directly convey information. Although an overall consensus has not been achieved as to the efficacy and general task applicability of these properties, some guidelines have emerged as to their usefulness when applied to particular task domains.
Area
Area is both an asset and a liability—treemaps use area to weight individual nodes, yet by the algorithm’s nature, the aspect-ratios of the generated rectangles are different, making them ill-suited for simple comparison tasks [1, 4]. Area, though, does have its benefits: because an overview of the entire information space is provided, the treemap allows the user to perform outlier identification tasks based upon the areas of individual rectangles. In the NBA example, a weighting attribute of “points per season” translates into large areas for players who have achieved high point totals over the entire season (this attribute can be inverted to identify low-scoring players as well).
Relative comparisons of siblings (teams within a division, players of a team) can also be accomplished as all children of a node are either the same height or width; viewed in the context of this task, the treemap becomes a meta-chart of relative bar charts.
Color
Color is also used to convey attributes, which may be continuous or categorical. For the NBA domain, color was applied to all of the numeric attributes used for area weighting—specific class intervals were established based on these attributes’ maxima, minima and data distribution.
Careful consideration should be given to the use of color with treemaps given the potential for interaction effects. A more efficient use of color is as a filtering mechanism: the video demonstrates color as a highlighting tool for nodes that satisfy certain criteria. This accomplishes the task of pinpointing the location of specific nodes in the context of the complete hierarchy.
Enclosure
The concept of enclosure to indicate parentage has been well-studied and applied in many different domains. The enclosure provided by the treemaps triggers location-oriented tasks: are all high-scoring players located under a particular division or team? Enclosure also emphasizes cause-effect relationships. Child node weighting influences parent node weighting; sibling nodes compete for each other’s space. Large child nodes, therefore, create a “ripple” effect up the hierarchy making cause-effect relationships obvious.
AREA DISTORTION
Difficulty arises when there is low variance in the underlying data points used as the weighting attribute. For this case, as well as enhancing the comparison capabilities of the diagram, distortion techniques have been introduced. Visually altering the rectangular areas through distortion clarifies node relationships in the diagram. Treemap distortion can be accomplished in three ways: altering the underlying weights that the treemap algorithm uses, applying geometric transformations to the diagram, or allowing the user to directly manipulate the treemap.
The first technique was used in the video. Each player’s weight was altered using an exponential function. The visual impact of this function is that large areas grow even larger, overwhelming their smaller siblings and cousins; the effect is quite similar to a fisheye diagram with multiple foci. Figure 2 illustrates distortion on Figure 1; players with large season point totals have larger areas. Each of the four divisions is seen to have one or more standout players.
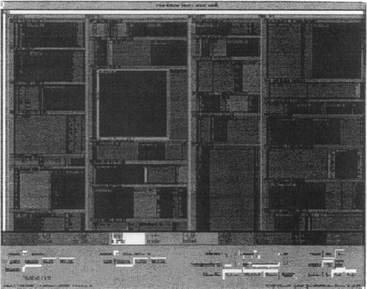
Figure 2 Chicago’s Michael Jordan is emerging with the greatest area in this distorted view of Figure 1.
More advanced algorithms for providing distortion fluidity and efficiency are under research.
REFERENCES
1. Cleveland, W. S., McGill, R. Graphical Perception: Theory, Experimentation and Application to the Development of Graphical Methods. Journal of the American Statistical Association. 1984; 79(387):531–554.
2. Johnson, B., Shneiderman, B., Tree-Maps: A Space-Filling Approach to the Visualization of Hierarchical Information Structures. Proceedings of IEEE Visualization’91. Oct. 22–25, San Diego, CA. IEEE Computer Society Press, 1991:284–291.
3. Jan. Shneiderman, B. Tree Visualization with Tree-maps: A 2-D space-filling approach. ACM Transactions on Graphics. 1992; 11(1):92–99.
4. Simkin, D., Hastie, R. An Information-Processing Analysis of Graph Perception. Journal of the American Statistical Association. 1987; 82(398):454–465.
5. Turo, D., Johnson, B., Improving the Visualization of Hierarchies with Treemaps: Design Issues and Experimentation. Proceedings of IEEE Visualization’92. Oct. 8–12, Boston, MA. IEEE Computer Society Press, 1992:124–131.