
Interactive Exploration of Time Series Data
Harry Hochheiser1 and Ben Shneiderman2, 1Department of Computer Science and Human-Computer Interaction Lab, University of Maryland, College Park MD 20742, +1 301 405 2725; 2Department of Computer Science, Human-Computer Interaction Lab, Institute for Advanced Computer Studies, and Institute for Systems Research, University of Maryland, College Park MD 20742, +1 301 405 2680. E-mail address: [email protected], [email protected]
Abstract
Widespread interest in discovering features and trends in time- series has generated a need for tools that support interactive exploration. This paper introduces timeboxes: a powerful direct-manipulation metaphor for the specification of queries over time series datasets. Our TimeSearcher implementation of timeboxes supports interactive formulation and modification of queries, thus speeding the process of exploring time series data sets and guiding data mining.
1 Introduction
Interest in time series data has prompted a substantial body of work in the development of algorithmic methods for searching temporal data [1, 5]. These methods would be more widely employed if the difficulty of query formulation was reduced. In order to build understanding of time series data users need tools that support data exploration via easy construction of queries and rapid feedback (100ms) [7].
Dynamic queries [2]and related information visualization techniques [4] have proven useful in meeting these goals. This paper introduces timeboxes: a dynamic query mechanism for specifying queries on temporal data sets.
2 Related Work
Data mining research has led to the development of useful techniques for analyzing time series data, including dynamic time warping [10] and Discrete Fourier Transforms (DFT) in combination with spatial queries [5]. To date, this work has paid little attention to query specification or interactive systems. One exception is Agrawal et al.’s Shape Definition Language, which specifies queries in terms of natural language descriptions of profiles [1]. Support for progressive refining of queries was addressed by Keogh and Pazanni, who suggested the use of relevance feedback for results of queries over time series data [6]. Our work with timeboxes is aimed at developing tools to address issues of user interaction with these data mining tools.
Existing time series visualizations tools generally focus on visualization and navigation, with relatively little emphasis on querying data sets. QuerySketch is an innovative query-by-example tool that uses an easily drawn sketch of a time series profile to retrieve similar profiles, with similarity defined by Euclidean distance [9]. Spotfire’s Array Explorer 3 [8] supports graphically edit-able queries of temporal patterns, but the result set is generated by complex metrics in a multidimensional space.
3 Timeboxes: Interactive Temporal Queries
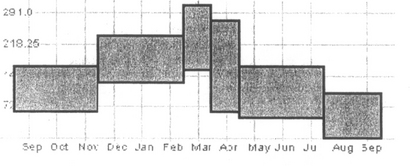
Timeboxes are rectangular query regions drawn directly on a two-dimensional display of temporal data. The extent of the timebox on the time (x) axis specifies the time period of interest, while the extent on the value (y) axis specifies a constraint on the range of values of interest in the given time period. More specifically, a timebox that goes between (xmin, ymin) and (xmax, ymax) indicates that for the time range xmin ≤ x ≤ xmaz. the dynamic variable must have a value in the range ymin ≤ y ≤ ymax.
Timeboxes are created, moved, and resized using rectangle manipulation operations familiar to users of drawing and presentation software. Multiple timeboxes can be combined to specify conjunctive queries.
Fig. 1 provides an example query containing multiple timeboxes. In addition to being succinct and easy to create, the timebox version of this query provides a visual picture of the constraints that is not apparent in other notations. For example, the query in Fig. 1 is more easily interpreted than the mathematical expression of the same constraints (Table 1). which is cognitively more difficult for users to comprehend.
Table 1
Constraints for query shown in Fig. 1
| ∀sep≤x≤ nov 57 ≤ y ≤ 160 | ∀dec≤x≤feb 124 ≤ y ≤ 230 | ∀x=mar 154 ≤ y ≤ 291 |
| ∀x≤ apr 58 ≤ y ≤ 266 | ∀may≤x≤jul 46 ≤ y ≤ 162 | ∀aug≤x≤sep 0 ≤ y ≤ 101 |
4 TimeSearcher
4.1 Overview
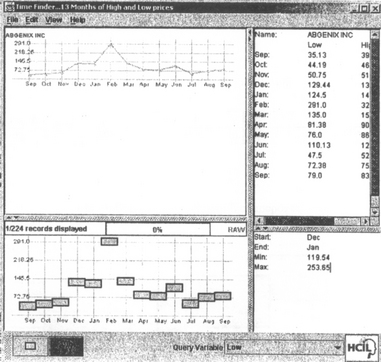
The main TimeSearcher window is shown in Fig. 2. Entities in the data set are displayed in a window in the upper left-hand corner of the application. This provides a scrollable list that can be used to browse through the data. Complete details about the entity (details-on-demand) can be retrieved by simply clicking on the graph for the desired entity: this will cause the relevant information to be displayed in the upper right-hand window (Fig. 2).

4.2 Query Creation and Modification
Queries are created in the query space in the bottom-left corner of the window. To specify a query, users draw a timebox in the desired location. Query processing begins as soon as users release the mouse, signifying the completion of the box. No “run” or “query” bution is necessary because of the rapid update (a few hundred milliseconds). When query processing completes, the display in the top half of the application window is updated to show those entities that match the query constraints.
Rapid and dynamic update of the result set display provides prompt feedback regarding the results of the query. Once, the initial query is created, query parameters can be changed by moving and resiling the timebnxes. either individually or simultaneously in groups.
4.3 Drag and Drop
Users might be interested in identifying entities that have profiles similar to a given template or example from the data set. TimeSearcher provides a drag-and-drop mechanism that can be used to identify items similar to a given example from the data set. The user can instantiate a query by dragging an item from the data display window and dropping it onto the query space. The resulting query has a separate timebox for each time point in the data set (Fig. 3). Once the query is created, the user can modify the timeboxes to modify the definition of “similar”.
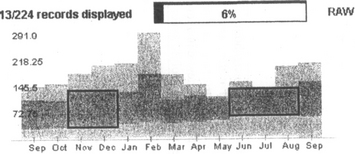
4.4 Envelopes for Overviews
TimeSearcher uses envelopes to provide overview displays to help users make sense of large data sets [4.7]. Optionally shown in the background of the query window, the data envelope is a contour that follows the extreme values of the query attribute at each point in time, thus displaying the range of values that may be queried. When the user executes a query, the data envelope is extended by a query envelope an overlay that outlines extreme values of the entities in the result set (Fig 4). This display provides users with a graphic summary of the relationship between the result set and the data set as a whole
5 Software
TimeSearcher was implemented in Java 2, using the Swing toolkit. Drawing and scenegraph control in the data and query displays, along with functionality for moving and rescaling timeboxes. is provided by Jazz [3]. Timeboxes, graphs of each item, and query and data envelopes are implemented as Jazz widgets.
Orthogonal range trees are used to index the data, with each timebox acting as an orthogonal range query. In this model, each timebox is an orthogonal range query of width w, and an entity from the data set must have w points that fall within the query range to be included in the result set for the query.
6 Discussion and Future Work
TimeSearcher users an “overview-first” [7] approach to the exploration of time series data. The data and query envelopes, together with the linear list of graphed elements, provide the necessary overview. Each timebox is a new filter that restricts the data set resulting from the query formed by the pre-existing timeboxes. Query processing on mouse release follows a model familiar to users of modern GUIs, whereby a mouse release is treated as completion of user input.
Several extensions to the timebox model might increase the range of queries that can be expressed. Queries involving events of fixed duration occurring at any point in time, events that are separated by minimum gaps in time, disjunctions and negations, trends involving relative changes (“increase of more than 50% within a given period”) and multiple time-dependent attributes might be of interest.
Further gains in efficiency might be realized by using timeboxes to specify queries to be evaluated with existing data mining algorithms such as those described by Faloutsos. et al. [5]. In this model. TimeSearcher might be used to interactively search subsets of a larger data set, in order to refine queries that might be executed against the entire data set, using the more expensive data mining algorithms.
7 Conclusions
TimeSearcher uses dynamic queries, overviews, and other information visualization techniques that have proven useful in a variety of other domains [2, 4, 7] to support interactive examination of time series data. Timeboxes represent an extension of the dynamic query idea to include widgets that query multiple dimensions simultaneously, as each timebox specifies constraints over two dimensions.
The incorporation of data mining algorithms into systems that support exploration and interactive knowledge discovery is the next step in making data mining more accessible to a wider range of users and problem domains. A more diverse user population will also stimulate more research, as these users generate questions and problems involving further algorithmic challenges.
The utility of timeboxes will be a function of the usability of the interface, particularly in comparison with alternative approaches. Empirical studies and heuristic evaluations are needed to clarify the benefits and drawbacks of timeboxes, while suggesting additional interface improvements.
Acknowledgments
Thanks to Martin Wattenberg for providing stock price datasets, and to Eric Baehrecke and Hyunmo Kang for valuable feedback. The first author was supported by a fellowship from America Online.
References
1. Agrawal, R., Psaila, G., Wimmers, E., Zat, M., Querying Shapes of Histories. Proceedings of 21st VLDB Conference. Zurich Switzerland, September. 1995:502–514.
2. Ahlberg, C., Shneiderman, B., Visual Information Seeking: Tight bCoupling of Dynamic Query Filters with Starfield Displays. Proceedings of CHI ’94. Boston MA, April. ACM Press, New York, 1994:313–317.
3. Bederson, B. B., Meyer, J., Good, L., Jazz: an Extensible Zoomable User Interface Graphics Toolkit in Java. Proceedings of UIST 2000. San Diego CA, November. ACM Press, 2000:171–180.
4. Card, S. K., Mackinlay, J. D., Shneiderman, B. Readings in Information Visualization: Using Vision to Think. Morgan-Kaufmann Publishers; 1999.
5. Faloutsos, C., Ranganathan, M., Manolopoulos, Y., Fast Subsequence Matching in Time Series Databases. Proceedings of SIGMOD ’94. Minneapolis MN, May. ACM Press, San Francisco, CA, 1994:419–429.
6. Keogh, E. J., Pazzani, M. J., Relevance Feedback Retrieval of Time Series Data. Proceedings SIGIR ’99. Berkeley, CA, August. ACM Press, 1999:183–190.
7. Shneiderman, B. Designing the User Interface. Addison-Wesley; 1998.
9. Wattenberg, M., Sketching a Graph to Query a Time Series Database. Proceedings of CHI 2001, Extended Abstracts. Seattle WA, April. ACM Press, Reading, MA, 2001:381–382.
10. Yi, B. K., Jagadish, H. V., and Faloutsos, C. Efficient Retrieval of Similar Time Sequences Under Time Warping. In Proceedings of the International Conference On Data Engineering (ICDE ’98), IEEE Computer Society Press, 201–208.