Visualizing websites using a hierarchical table of contents browser: WebTOC
David A. Nation*, Department of Defense. E-mail address: [email protected]
Catherine Plaisant, Gary Marchionini and Anita Komlodi, Human-Computer Interaction Laboratory, University of Maryland, College Park, MD 20742, http://www.cs.umd.edu/hcil/webtoc/
Abstract
A method is described for visualizing the contents of a Web site with a hierarchical table of contents using a Java program and applet called WebTOC. The automatically generated expand/contract table of contents provides graphical information indicating the number of elements in branches of the hierarchy as well as individual and cumulative sizes. Color can be used to represent another attribute such as file type and provide a rich overview of the site for users and managers of the site. Early results from user studies suggest that WebTOC is easily learned and can assist users in navigating websites.
Introduction
One difficulty in information visualization on the World Wide Web is representing the quantity of information and its distribution within a set of linked documents. This information along with the type of document (text, image, audio, …) can be helpful when deciding whether a web site may be interesting or useful without spending a great deal of time browsing the deep structure of the site.
A user might find a useful collection of audio or image files “hidden” down a series of links from the main page. Another site may be composed primarily of links without substantial content of its own. A way is needed to quickly get an overview of a site including overall size and composition and a way to look at a few sample pages without wading through the entire structure.
Motivation: The initial motivation for WebTOC was to find a way to browse large numbers of documents in the growing Library of Congress American Memory collections. The Library of Congress (LoC) contracted with the University of Maryland to develop prototypes for future interfaces. The size and extent of such large collections makes them hard to understand. A method was needed to help the LoC staff develop and organize them.
Photographs, manuscripts, journals and other material are continually being digitized and added to the existing structure. Keeping up with the current configuration requires a dynamic system that can be updated automatically with minimal human intervention. The ability to get an overview of the whole collection and to rapidly “drill down” to get more details is essential to the management and use of the information.
WebTOC automatically generates a hierarchical table of contents of a site (or, in the case of our LoC application, a collection) using two different strategies: following existing links or using the underlying directory and file structure. Following links is appropriate for existing websites, while using the directory structure is appropriate for newly digitized “unprocessed” collections which have not yet been linked, indexed or annotated.
Related work: It is difficult for users to navigate large document spaces, since they often experience a disorientation problem. Hypertext readers must remember their location in the network, make decisions about where to go next, and keep track of pages previously visited. McKnight, Dillon, and Richardson [11] provided evidence of disorientation problems in a hypertext search task. One of the ways to improve hypertext design is to provide structural cues to the reader. Providing a structured overview of the hypertext contents facilitates users’ orientation [13]. The Navigational View Builder [12] uses four strategies for web visualization: binding, clustering, filtering and hierarchization.
Tables of contents have been a common method of providing overview and navigation aid in books. Expand/contract tables of contents or outlines have been used for directory structures (e.g. Microsoft Explorer) and early Hypertext systems based on hierarchical structures (e.g. Superbook [6]). Versions of tables of contents that allow the user to expand and contract levels of the hierarchy have been shown to decrease browsing times in comparison to stable fully expanded versions [5]. WebTOC uses an expand/contract table of contents.
Earlier techniques have been used to browse or visualize directory structures. Previous work with Treemaps [8, 2] demonstrated the usefulness of presenting size and type information about directory structures compactly. It showed the importance of an overview and using visual cues to discover documents that seem out of place, are unusually large, or are duplicates. Parameters could be changed easily to represent a number of characteristics of the documents such as size, type and age. Treemaps have some drawbacks such as areas having different shapes which makes size comparison difficult. Finding space for labels on the treemap can also be difficult. WebTOC provides space for labels in a conventional indented list format and allows for comparisons of length with single dimensional lines.
WebBook[3] is a tool which helps users organize their Web activities. Pages in the “book” are Web pages and users can flip through the pages to find the ones they want. Users can also insert bookmarks among the pages. This application uses Fumas’s [7] fisheye view paradigm to provide an overview for the contents of the “book”. Fisheye view graphs [14] show the center of interest in a large scale and with great detail, while areas further from the center are successively smaller and in less detail. WebTOC allows the user to vary the amount of detail displayed using the expandable hierarchy, by removing text labels and by showing the results of a search while preserving the context of the hierarchy.
Docuverse[15] and Superbook[6] are applications that help users develop documents in an individual or group environment. Superbook uses an expand/contract table of contents, while Docuverse lays out the hierarchy of the content in a tree structure. Docuverse’s developer realizes that the hierarchy may become unwieldy as the number of nodes increases. This is also a problem for WebTOC and many other systems.
Hyperbolic visualization [10] is a technique falling under the fisheye paradigm. The idea is to lay out the hierarchy in a uniform way on a hyperbolic plane and map this plane onto a circular display. Initial studies comparing hyperbolic browsers against conventional 2D scrolling browsers with a horizontal tree layout show that subjects preferred the hyperbolic browser, but there was no significant difference between the browsers in performance times for the task of finding specific node locations.
Web visualizations have used graphs to represent all the links or 3D “information landscapes” to visualize document sets [1] but those visualizations are typically more complex to learn and use than tables of contents.
Value bars [4] display quantifiable attribute values of items to help users visualize and navigate large information spaces. It is especially useful for multi-attribute listings. Among other features it gives an overview of attribute distribution, and makes it easier to locate outliers and exceptions. User studies showed that users liked the ability to quickly find extreme values of attributes (largest, youngest files, etc.). The ability to see multiple attributes for a single item was also a favored feature of value bars. The possibility of immediate navigation to the item selected in the context of the index of items was also mentioned as a “best feature”. In a user test, subjects were asked to find files by different attributes (age, size, etc.) in a UNIX directory structure. Users of value bars were much more efficient in tasks looking for extreme values on attributes than users of UNIX commands. WebTOC uses a similar strategy except the bars are embedded in the table of contents and represent branches of the hierarchy instead of the whole document.
We believe that WebTOC will be helpful to browse websites and directory structures to quickly see where the bulk of files/pages are located, to compare relative sizes of directories and to see any outliers or unusually large branches of the hierarchy. This information can also be useful for space management and trouble-shooting functions.
Description
WebTOC consists of two parts: a parser program to generate a table of contents (TOC) file representing the site, and a user interface (Java applet) to display the TOC and allow interaction within a conventional web browser.
The interface: Figure 1 shows an example where WebTOC is used to provide an overview and browsing mechanism for one of the American Memory collections of the Library of Congress. On the right is the original home page, on the left the WebTOC table of contents.
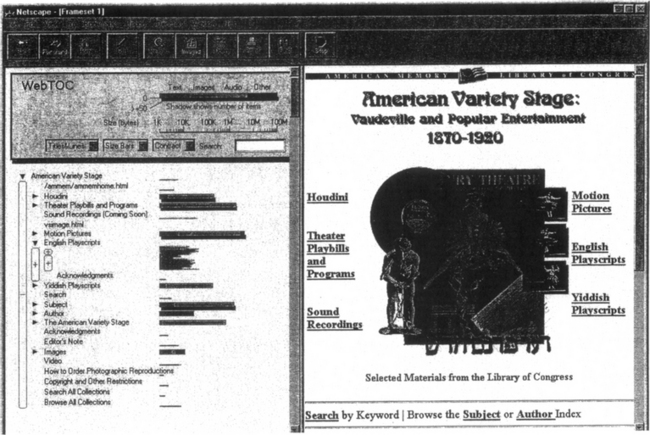
Figure 1 This figure shows WebTOC displayed in a frame to the left of the home page it represents: the American Memory collection entitled “American Variety Stage: Vaudeville and Popular Entertainment 1870–1920”. The top portion is a legend and control panel for WebTOC. Links are listed with a bar that represent the volume of information available when following that link. Users can then expand the hierarchy (e.g. here “English Playscripts” has been expanded and the labels removed to compare file sizes).
The bottom left part of the display shows the Table of Contents with the first level links displayed. A line to the right of each text label shows the size and type of the file. A branch that hasn’t been expanded is represented by a larger “size bar”. Two levels of links have been opened up under “English Playscripts” but the display has been compressed in that area showing only the lines representing the files and not the labels. Clicking on any of the labels or individual lines causes that file to be displayed in the frame on the right. Clicking on the size bar or the triangular symbol to the left of the label opens or closes a level of the hierarchy. Clicking on the outlined area to the left of a level will add or subtract the display of text labels for the files. All links of the home page are shown on the table of contents but in addition users can estimate the volume of information available in a branch if they decided to follow the link.
As summarized in the WebTOC legend (top left of Figure 1) individual pages are shown with individual lines while bars aggregate groups of files behind a link or directory to represent the total size of the included documents. Color is used to represent file type, length the overall size and the shadow below the bar is proportional to the number of documents included. The number of documents and size represented are displayed in the browser status area when the user’s cursor is over the bar. Figure l’s TOC shows that “Sound recording” is very small (close to empty) in comparison to the other categories like “motion pictures”, while it would have been impossible to guess from the home page on the right. “Yiddish playscripts” is also smaller than “Motion pictures” but in addition the shadow is also very small suggesting that the number of pages is small there. “English playscripts” has been opened using the arrow button on the left of the name and the individual lines appear to show individual pages. Each line or label is a link to the corresponding page, making it possible to drill down the hierarchy quickly and access deep pages without loading the intermediate pages (either for sampling or quick access to known destinations).
The legend at the top shows the colors representing documents of types: Text, Images, Audio and Other. Those types were chosen for our Library of Congress application but other types might be useful in other situations. For example color could be used to show the type of link (outside link, within site link, within page link). The size of the shadow under the bar corresponds to the number or items in the branch. The shadow gets larger for more items to a maximum of the height of the bar for 50 or more items. This is arbitrary and will probably have to be changed for other sites. Below the bar is a scale for the size of files or collections of files. The left edge of the scale starts with 1000 bytes and is positioned to be in line with the lines and bars below. The reference bar and scale in the legend can be dragged to the left or right and can be compressed horizontally to dynamically modify the entire TOC display so as not to obscure the labels of items in the Table of Contents.
An alternative more compact representation of the table of contents is to display all the line segments without the text (Figure 2). This enables the user to get a visual overview of the site and the ability to directly compare file sizes. Due to extreme variability in file sizes, a log scale was used for representation of size. An alternative to the size bar is a linear scale bar representing the number of items in the hierarchy below a given item. The information about size, type and number of items behind a web page is missing from Web based link structures and conventional tables of contents.
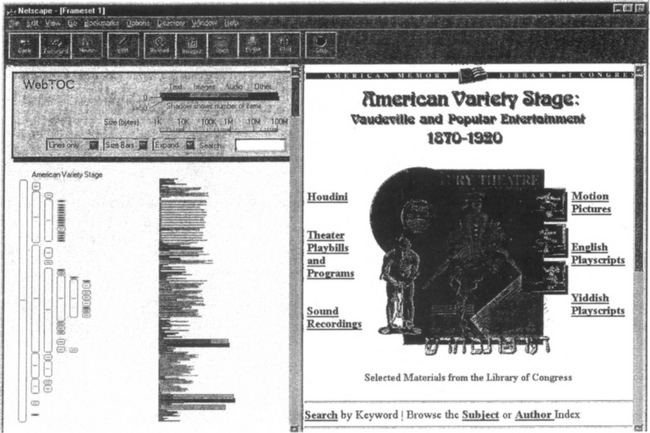
Figure 2 In this figure the “Expand” function has been used to open the entire table of contents and the labels have been removed using the “Lines only” option to show a compact representation of size and type of files. Some of the branches have been collapsed into bars to save space. Note the shadows under the bars indicating the number of items within the branch.
Figure 3 shows another alternative attribute visualization. Here the bars show the number of items in a branch of the tree (as opposed to the overall directory size). The example used is the HCIL web site, showing that most of the items in the site are in the student section of the site, making this section a

Figure 3 This figure shows the option of displaying the linear bars to indicate number of items in the branch instead of size. Lines indicating size are still used for individual files. This is a representation of the HCIL site which clearly indicates that the largest number of documents are included in the “Students: Graduate and Undergraduate” branch. The message in the status area at the bottom of the browser indicates the actual number of items and size for that branch.
Automatic generation of the table of contents: The implementation of WebTOC includes the automatic generation of the table of contents by following the links included in the documents and treating each new set of links as another level of the hierarchy.
Many choices had to be made in the selection of links to be included in the table of contents. Following all the links would normally lead to inclusion of the whole web. It was decided that the TOC file (WebTOC) would represent the size and links from the documents local to a web site. The server URL is used to limit following links only to documents local to the server. Another compile time option is set to use only the first occurrence of a link on the local site. A breadth first search is used to ensure that the link is displayed at the level of the hierarchy closest to the root. An option exists to display outside links in the WebTOC but without indicating the size or type of document. Therefore the total size indicated in the WebTOC corresponds to the size of the documents on the site.
It’s not always possible to follow all paths in a site. For example when a search or other type of form is used to access parts of the site the parser would see only the form page. Other cgi-bin files generated on the fly in the normal structure are scanned as if they were static files.
The data file produced by the parser is in a format similar to HTML which contains information on the server and document base URL, an indicator of the start and end of a group of links, and information on each document or link including size, file name, type and label. It can be created automatically with the parser program or manually with a text editor. It has the extension “.hdir”.
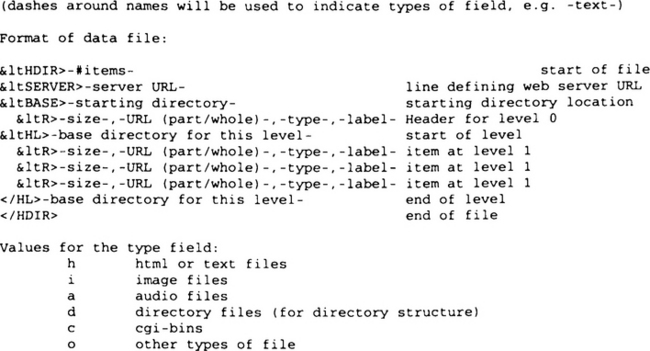
An example file is shown below:

As mentioned earlier WebTOC can also generate the TOC file from the underlying directory structure of the site. This is useful when documents have been stored online but the link structure has not been created yet (e.g. unprocessed collections).
The parser program is controlled by a few simple parameters including the URL of the web site and whether to follow the links or scan a local directory. A scan over the web of several thousand links can take 4–6 hours to complete using a Pentium 166 or Sparc 20. A local scan on the same server can be done in less than an hour. A directory scan of a similar number of files can be done in 10 - 20 minutes because a system function can be used to find the length of the files.
User studies
Controlled experiment: A study was conducted by students in Dr. Shneiderman’s Human Factors in Computer and Information Systems class at the University of Maryland to evaluate the usefulness of WebTOC for Web site navigation tasks during the Spring 1997 semester. Task completion time and subjective user satisfaction were measured on a set of simple and complex retrieval and navigation tasks for three groups of users. The first group used the full WebTOC version with size and number of items graphic displays as shown in Figure 3. The second group used a textual table of contents (a version of WebTOC without the size bars). The third group had no table of contents available and used only Netscape capabilities to browse the pages of the experimental site. The Web sites used in the study were selected collections within the Library of Congress American Memory collection. The Variety Stage collection and the Evolution of the Conservation Movement were used. Because of the large number of items in these collections the table of contents was limited to five levels of depth.
This experiment found no statistically significant differences between interfaces. This may be due to the limited number of subjects (only seven subjects were tested per treatment). The subjective satisfaction surveys showed a preference for WebTOC. Results on the five tasks showed that WebTOC is better suited for more complex tasks, when users have to traverse several levels of the hierarchy and for tasks where quantitative (size) comparisons are necessary between nodes in the hierarchy. In simpler tasks the textual table of contents and Netscape users performed better than users of WebTOC. This shows that the complexity WebTOC adds to the display makes simpler tasks more difficult but in the case of more complex tasks it helps users. This is confirmed by the fact that as tasks got more complex Netscape users gave increasingly higher difficulty ratings to tasks in the user satisfaction survey while the increase in difficulty ratings by WebTOC users was not so dramatic. Users found WebTOC easy to learn, and the subjects using WebTOC were the most satisfied with the tool they had available to solve the tasks. The presence of the WebTOC also increased the feeling of organization of the site. The full paper with detailed results is available at http://otal.umd.edu/SHORE. This paper presents a number of lessons learned and makes several recommendations for further study of WebTOC.
CHI 97 Browse-Off: Since WebTOC can also browse a directory structure WebTOC was used in an informal competition among browser products at the ACM Conference on Human Factors in Computer Systems (CHI 97). A directory structure representing an eleven level hierarchy of categories of world items was used as the source of data (Figure 4). Top level categories were People, Places, Things, Events, Qualities and Knowledge. The use of search functions was not permitted during the competition.
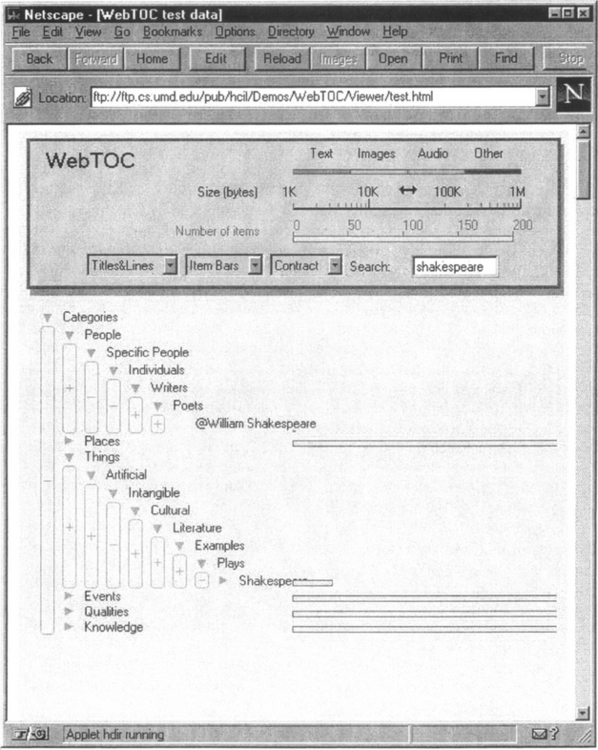
Figure 4 This figure shows a portion of the data hierarchy used in the CHI Browse-Off. It also illustrates how WebTOC can be used to display the search results within a site (although search was not permitted during the competition). The search function has been used to open up the hierarchy to items matching the search string, here “Shakespeare”.
Six pairs of expert users competed in a limited time to find information in the hierarchy. The score indicated the number of items successfully found in the time period. Tasks were broken down into different levels of difficulty and complexity.
Although the WebTOC entry didn’t win the competition, it came in second tied with the Windows Explorer entry from Microsoft. The winner was the HyperBolic browser [10] from Xerox PARC. There wasn’t enough time in this panel session for a head to head competition between the teams with the highest scores but a set of novice users competed in a final round using the HyperBolic browser, WebTOC and a new manual “control” entry using a paper based system with a filing cabinet and file folders.
The novice users using WebTOC ended up with a higher score for this competition than the HyperBolic browser. The WebTOC users found the interface intuitive and easy to get used to. Although the HyperBolic browser users liked the interface, they had more trouble operating it than the expert user. While the paper based team didn’t finish the entire event, they were in the lead at the end of three out of four sets of tasks.
Clearly the CHI’97 Browse-off was a very informal test but it demonstrated the potential of WebTOC as a browsing tool.
Future Work
WebTOC could be used to display other characteristics of documents such as time since the last update to indicate the freshness of data on the site. The data from the parser could be used with other web visualization software.
Conclusion
WebTOC has been shown to combine the techniques demonstrated by previous work to provide a method of visualizing either directories of files or the contents of Web sites by providing an interactive hierarchical table of contents with additional information on size and composition that are useful for understanding the contents of a collection of documents.
Acknowledgments
We want to thank Ben Shneiderman for his feedback on the design, the Department of Defense for allowing Dave Nation to work with the Human-Computer Interaction Laboratory during nine months of training, the Library of Congress for partial support, and the other students in Dr. Shneiderman’s class doing the experiment (Jeff Heflin, Nakul Pasricha and Theen-Theen Tan).
Availability
The WebTOC software and documentation is available from the HCIL FTP site (ftp://ftp.cs.umd.edu/pub/hcil/DemosAVebTOC/index.html).
References
1. September Andrews, Keith. Browsing, Building, and Beholding Cyberspace, New Approaches to Navigation, Construction, and Visualisation of Hypermedia on the Internet. Doctoral dissertation, Graz University of Technology. 1996.
2. December Asahi, Toshiyuki, Turo, David, Shneiderman, Ben, Using Treemaps to Visualize the Analytic Hierarchy Process [Postscript file] [Abstract file]. Information Systems Research. 1995;6(4):357–375.
3. Card, Stuart K., Robertson, George G., York, William, The WebBook and the Web Forager: An Information Workspace for the World-Wide Web, CHI96 Electronic Proceedings.
4. [Postscript file] [Abstract file]. Chimera, Richard. Value bars: An information visualization and navigation tool for multiattribute listings. In: Proc. CHI’92 Conference: Human Factors in Computing Systems. ACM; 1992:293–294.
5. October Chimera, Richard, Shneiderman, Ben, An Exploratory Evaluation of Three Interfaces for Browsing Large Hierarchical Tables of Contents [Postscript file] [Abstract file]. ACM Transactions on Information Systems. 1994;12(4):383–406.
6. January Egan, Dennis E., Remde, Joel R., Gomez, Louis M., Landauer, Thomas K., Eberhardt, Jennifer., Lochbaum, Carol C. Formative Design-Evaluation of SuperBook. ACM Transactions on Information Systems. 1989; 7(1):30–57.
7. Furnas, G. Generalized Fisheye Views, in Proceedings ACM CHI’86 Human Factors in Computing Systems Conference, ACM Press, New York, 16–23.
8. August Johnson, B., Treemaps: Visualizing hierarchical and categorical data UMI-94-25057. Doctoral dissertatio. 1993;
9. [Postscript file] [Abstract file] [Text only]. Kumar, Harsha P., Plaisant, Catherine, Shneiderman, Ben. Browsing hierarchical data with multilevel dynamic queries and pruning. Int. J. Human-Computer Studies. 1997; 46:103–124.
10. Lamping, John, Rao, Ramana, Pirolli, Peter. A focus + context technique based on hyperbolic geometry for visualizing large hierarchies. In: Proc. of ACM CHI’95 Conference: Human Factors in Computing Systems. New York, NY: ACM; 1995:401–408.
11. McKnight, C., Dillon, A., Richardson, J. A comparison of linear and hypertext formats in information retrieval. In: McAleese R., Green C., eds. Hypertext: The state of art. Oxford, England: Intellect Books; 1990:10–19.
12. Mukherjea, S., Foley, J. D. Visualizing the World-Wide Web with the navigational view finder. Computer Networks and ISDN Systems. 1995; 27(1):1075–1087.
13. Rouet, J., Lovonen, J. Studying and Learning with hypertext: empirical studies and their implications. In: Jean-Francois Rouet, Lovonen Jarmo J., Andrew Dillon, Spiro Rand J., eds. Hypertext and Cognition. Lawrence Earlbaum, 1996.
14. December Sarkar, Manojit, Brown, Marc H., Graphical fisheye views (Technical report) no. CS-93-40, Brown University, Dept. of Computer Science, Sept. 1993. Communications of the ACM. 1994;37(12):73–84.
15. Spring, Michael B., Morse, Emile and Heo, Misook. Docuverse: Multi-level Navigation of a Document Space, Department of Information Science and Telecommunications, University of Pittsburgh, Pittsburgh, PA 15260 USA.
*Mr. Nation was a visiting researcher at the University of Maryland when the work was performed. This paper represents the views of David Nation and not necessarily those of the DoD.