Excentric Labeling: Dynamic Neighborhood Labeling for Data Visualization
Jean-Daniel Fekete and Catherine Plaisant, Ecole des Mines de Nantes, 4, rue Alfred Kastler, La Chantrerie, 44307 Nantes, France, www.emn.fr/fekete; Human-Computer Interaction Laboratory, UMIACS, University of Maryland, College Park, MD 20742, USA, www.cs.umd.edu/hcil. E-mail address: [email protected], [email protected]
ABSTRACT
The widespread use of information visualization is hampered by the lack of effective labeling techniques. An informal taxonomy of labeling methods is proposed. We then describe “excentric labeling”, a new dynamic technique to label a neighborhood of objects located around the cursor. This technique does not intrude into the existing interaction, it is not computationally intensive, and was easily applied to several visualization applications. A pilot study with eight subjects indicates a strong speed benefit over a zoom interface for tasks that involve the exploration of large numbers of objects. Observations and comments from users are presented.
INTRODUCTION
A major limiting factor to the widespread use of information visualization is the difficulty of labeling information abundant displays. Information visualization uses the powerful human visual abilities to extract meaning from graphical information [1–2]. Color, size, shape position or orientation are mapped to data attributes. This visualization helps users find trends, and spot exceptions or relationships between elements on the display. Experimental studies have been able to show significant task completion time reduction and recall rate improvements when using graphical displays instead of tabular text displays (e.g., [3]) However textual information in the form of labels remains critical in identifying elements of the display. Unfortunately, information visualization systems often lack adequate labeling strategies. Often labels are entirely missing and users have to peck at graphical objects one at a time. Sometimes labels overlap each other to the point of obscuring the data and being less usable; or they are spread out in such a way that the relation between objects and labels becomes ambiguous. The problem becomes acute when the data density increases and the labels are very long.
To address this problem we propose “excentric labeling” as a new dynamic technique to label a neighborhood of objects (Figures 1–3). Because it does not interfere with normal interaction and has a low computational overhead, it can easily be applied to a variety of visualization applications.

Figure 1 Excentric labeling provides labels for a neighborhood of objects. The focus of the labeling is centered on the cursor position. Labels are updated smoothly as the cursor moves over the display, allowing hundreds of labels to be reviewed in a few seconds. The color of the label border matches the object color.
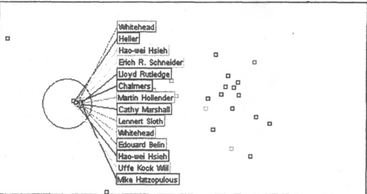
Figure 2 Labels are spread to avoid overlapping, possibly revealing objects clumped together on the display.
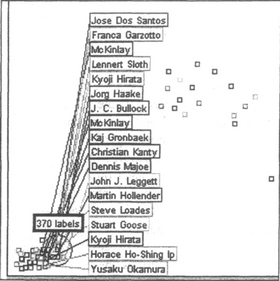
Figure 3 Special algorithms handle border effects (e.g., comers) When objects are too numerous, the total number of objects in the focus area is shown, along with a subset of the labels.
The labeling problem is not new. It has been extensively studied for cartographic purposes [4] where printing or report generation is the main purpose of the application. Very few solutions have been proposed to automate the labeling process of interactive applications. In this paper, we propose an informal taxonomy of labeling methods, then describe our excentric labeling technique in detail, discuss its benefits and limitations, and illustrate how it can benefit a variety of applications.
TAXONOMY OF LABELING TECHNIQUES
The labeling challenge can be stated as follows: given a set of graphical objects, find a layout to position all names so that each name (label) is:
2. Non-ambiguously related to its graphical object.
3. Does not hide any other pertinent information. Completeness (the labeling of all objects) is desired but not always possible.
Labeling techniques can be classified into two categories: static and dynamic. The goal of static labeling is to visually associate labels with a maximum of (all if possible) graphic objects in the best possible manner. But good static techniques are usually associated with delays not suitable for interactive exploration. Dynamic labeling began with interactive computer graphics and visualization. Two attributes account for the “dynamic” adjective: the set of objects to be labeled can change dynamically, and the number and layout of displayed labels can also change in real time, according to user actions.
Static Techniques
Static techniques have been used for a long time in cartography. Christensen et al., [4] wrote a recent summary of label placement algorithms. Cartography also needs to deal with path labeling and zone labeling, which is less widespread in visualization. We do not address those two issues in this article. But the same algorithms can be used for both cartography and general visualization. Since static techniques have to find “the” best labeling possible, the set of objects has to be carefully chosen to avoid a too high density in objects or labels. In cartography, this is achieved by aggregating some information and forgetting (sampling) others (this process is called “generalization”). This technique could be nicknamed the “label-at-all-cost” technique since one of the constraints is to label all objects of the display.
For data visualization, a similar process of aggregation can be applied to achieve a reasonable result with static techniques (e.g., aggregation is used in the semantic zooming of Pad++ [5] or LifeLines (6, 7]), but the logic of aggregation and sampling is mainly application dependent. Label sampling has been used occasionally [8].
The most common techniques (see Table 1) remain the “No Label” technique, and the “Rapid Label-all” technique which leads to overlaps and data occlusion (e.g., in the hyperbolic browser [9]). Also common is the “Label-What-You-Can” technique in which only labels that fit are displayed; other labels that would overlap or occlude data objects are not shown (e.g., in LifeLines),
Table 1
Taxonomy of labeling techniques
| Type | Technique | Comments/Problems |
| STATIC | No label | No labels! |
| Label-only-when-you-can (i.e. after filtering objects) | Need effective filters. Labels are rarely visible. | |
| Rapid Label-All | High risk of overlaps or ambiguous linking to objects | |
| Optimized Label-All | Often slow - may not be possible | |
| Optimized Label-All with aggregation and sampling | Effective but application dependant- may not be possible | |
| DYNAMIC | ||
| One at a time | Cursor sensitive balloon label | Requires series of precise selection to explore space (slow), cannot reach overlapped objects. |
| Cursor Sensitive label in side-window | Same as above. Constant eye movement can be a problem, but avoids occlusion of other objects. | |
| Temporal brushing (Cleveland) | More labels visible at a time, but overlapping problem. | |
| Global display change | Zoom until labels appear | May require extensive navigation to see many labels (can be effectively combined with semantic zooming, e.g., Pad++) |
| Filter until labels appear | May require several filtering to see labels (can be effectively combined with Zooming, e.g., starfields) | |
| Sampling | Dynamic sampling (Chalmers et al.) | Few labels are visible. |
| Focus + context | Overview and detail view without deformation | Effective when objects are separated enough in the detail view to allow labels to fit (not guaranteed) |
| Overview and detail with deformation/transformation (i.e. fisheye or magic lenses) | Deformation might allow enough room for labels to fit. (not guaranteed). May require tool or mode to be selected. | |
| Global deformation of space (e.g., Hyperbolic Browser) | Requires intensive navigation and dexterity to rapidly deform the space and reveal all labels (e.g., by fanning the space). | |
| Labeling of objects in focus area (excentric labeling) | Spreads overlapping labels, and align them. Can be disorienting at first. Need to learn to stop cursor to better read labels. |
Some visualizations avoid the problem completely by making the labels the primary objects. For example WebTOC [10] uses a textual table of contents and places color and size coded bars next to each label.
Dynamic techniques
Dynamic labeling techniques are more varied. The classic infotip or “cursor sensitive balloon label” consists of showing the label of an object right next to the object when the cursor passes over it. The label can also be shown on the side in a fixed window, which is appropriate when labels are very long and structured.
In the “All or Nothing” technique, labels appear when the number of objects on the screen falls below a fixed limit (e.g., 25 for the dynamic query and starfield display of the FilmFinder [11]). This is acceptable when the data can be easily and meaningfully filtered to such a small subset, which is not always the case. Another common strategy is to require zooming until enough space is available to reveal the labels; this requires extensive navigation to see all the labels. This technique can be combined elegantly with the static aggregation technique to progressively reveal more and more details - and refined labels - as the zoom ratio increases.
The overview and detail view combination is an alternative zooming solution [12]. The detail view can also be deformed to spread objects until all labels fit (i.e., in the way of a labeling magic lens [13]). Those last two techniques require either a tool selection or dedicated screen space.
Chalmers et al., proposed dynamic sampling where only one to three labels are displayed, depending on the user’s activity. Cleveland [2] describes temporal brushing: labels appear as the cursor passes over the objects (similarly to the infotip), but those labels remain on the screen while new labels are displayed, possibly overlapping older ones.
EXCENTRIC LABELING
Excentric labeling is a dynamic technique of neighborhood labeling for data visualization (Figures 1–3). When the cursor stays more than one second over an area where objects are available, all labels in the neighborhood of the cursor are shown without overlap, and aligned to facilitate reading. A circle centered on the position of the cursor defines the neighborhood or focus region. A line connects each label to the corresponding object. The style of the lines matches the object attributes (e.g., color). The text of the label always appears in black on a white background for better readability. Once the excentric labels are displayed, users can move the cursor around the window and the excentric labels are updated dynamically. Excentric labeling stops either when an interaction is started (e.g., a mouse click) or the user moves the cursor quickly to leave the focus region. This labeling technique does not require the use of a special interface tool. Labels are readable (non-overlapping and aligned), they are non-ambiguously related to their graphical objects and they don’t hide any information inside the user’s focus region.
Algorithm and Variations
To compute the layout of labels, we experimented with several variants of the following algorithm:
1. Extract each label and position for interesting graphic objects in the focus region.
2. Compute an initial position.
4. Assign the labels to either a right or left set.
5. Stack the left and right labels according to their order.
6. Minimize the vertical distance of each set from the computed initial position.
7. Add lines to connect the labels to their related graphic object.
So far, we have used three main variations of this algorithm: non-crossing lines labeling, vertically coherent labeling and horizontally coherent labeling (the last two can be combined). Each uses a different method to compute the initial position, the ordering, to assign the labels to the stacks and to join the labels to their related graphic objects.
Non-Crossing Lines Labeling - Radial Labeling
The non-crossing lines labeling layout (Figure 4) avoids line crossings but does not maintain the vertical or horizontal ordering of labels. This technique facilitates the task of tracing the label back to the corresponding object. It can be used in cartography-like applications where ordering is unimportant. The initial position on the circle (step 2 of previous section) is computed with a radial projecting onto the circumference of the focus circle1. It is always possible to join the object to the circumference Table 1: Taxonomy of labeling techniques without crossing another radial spoke (but two radii - or spokes- may overlap). Then, we order spokes in counterclockwise order starting at the top (step 3). The left set is filled with labels from the top to the bottom and the right set is filled with the rest.

Figure 4 This figure shows the same data as in Figure 1 but using the non-crossing - or radial - algorithm.
Labels are left justified and regularly spaced vertically. We maintain a constant margin between the left and right label blocks and the focus circle to draw the connecting lines. For the left part, three lines are used to connect objects to their label: from the object to the position on the circumference, then to the left margin, and to the right side of the label box. This third segment is kept as small as possible for compactness, therefore barely visible in Figure 4, except for the bottom-left label. For the right labels, only two lines are used from the object to the initial position to the left of the label. The margins contain the lines between the circumference and the labels.
Vertically Coherent Labeling
When the vertical ordering of graphic objects has a important meaning we use a variant algorithm that does not avoid line crossing but maintains the relative vertical order of labels. This will be appropriate for most data visualization, for example in the starfield application FilmFinder [11], films can be sorted by attributes like popularity or length, therefore labels should probably be ordered by the same attribute. Instead of computing the initial position in step 2 by projecting the labels radially to the circumference, we start at the actual Y position of the object. The rest of the algorithm is exactly the same. Figure 1 and 2 shows examples using the vertically coherent algorithm. We believe that the vertically coherent algorithm is the best default. Crossing can occur but we found that moving slightly the cursor position animates the label connecting lines and helps find the correspondence between objects and their labels.
Horizontally Coherent Labeling
When the horizontal ordering of graphic objects has a special meaning, we further modify the algorithm in step 5. Instead of left justifying the labels, we move them horizontally so that they follow the same ordering as the graphic objects, as in Figure 5. This algorithm should be used with caution as it was found confusing by several of our reviewers.
Dealing with window boundaries
When the focus region is near the window boundaries, chances are that the label positions computed by the previous algorithms will fall outside of the window and the labels appear truncated (e.g., the first characters of the left stack labels would not be visible when the cursor is on the left side of the window).
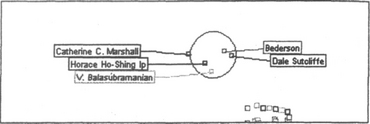
To deal with window boundaries the following rules are applied. If some labels are cut on the left stack, then move them to the right stack (symmetric for the right side.) When labels become hidden on the upper part of the stack (i.e., near the upper boundary), move them down (symmetric for the bottom). Combining those rules takes care of the corners of the window (Figure 6).

DISCUSSION
Excentric labeling seem to fill a gap in information visualization techniques by allowing the exploration of hundreds of object labels in dense visualization screens in a matter of seconds. Many labels can be shown at once (probably around 20 at a time is optimum.) They are quite readable and can be ordered in a meaningful way. Links between objects and labels remain apparent, especially when matching color is used. The technique is simple and computationally inexpensive enough to allow for rapid exploration. Of course, these algorithms don’t solve all the problems that may occur when labeling, and excentric labeling is most likely to be used in conjunction with other techniques (e.g., zooming).
Dealing with too many labels
We estimate that about 20–30 excentric labels are best displayed at a time, depending on the screen size. When more objects fall in the focus region, the screen becomes filled by labels and there is often no way to avoid that some labels fall outside the window. We implemented two “fallback” strategies: (1) showing the number of items in the focus region, and (2) showing a subset of those labels in addition to the number of objects (see Figure 3). The sample could be chosen randomly or by using the closest objects to the focus point. Although not entirely satisfactory, this method is a major improvement over the usual method of showing no labels at all, a pile of overlapping labels, or a subset of labels without mention of the missing ones.
The dynamic update of this object counts allow a rapid exploration of the data density on the screen. Of course, (this is data visualization after all) the number of objects should also been be represented graphically by changing the font or box size to reflect the magnitude of the number of objects. Showing the density and clustering of objects can also be shown using a glowing colored halo [14].
Dealing with long labels
Labels can be so long that they just don’t fit on either side of the focus point. There is no generic way to deal with this problem but truncation is likely to be the most useful method. Depending on the application, labels may be truncated on the right, or on the left (e.g., when the labels are web addresses), or they may be truncated following special algorithms. Some applications may provide a long and a short label to use as a substitute when needed (e.g., Acronyms). Using smaller fonts for long labels might help in some cases. If long lines occur infrequently, breaking long labels in multiple lines is also possible.
Limiting discontinuities
One of the drawback of the dymamic aspect of excentric labeling is that the placement of an object’s label will vary while the cursor is moving around the object. This is needed to allow new labels to be added when the focus area covers more objects, but leads to discontinuities in the placement of labels. For example, when the cursor moves from the left side of an object to its right side, the label will move from the right to the left stack. This effect is actually useful to confirm the exact position of a label but might be found confusing by first time users. We found that discontinuties were more common with the non-crossing algorithm than the Y coherent algorithm, which we therefore favor, despite the risk of lines crossing.
The evaluation section shows how users quickly learned to avoid this problem by hopping from place to place instead of continuously move the cursor.
Faciliting selection of objects
Excentric labeling does not interfere with the normal selection of objects but since it can reveal labels of objects that are hidden, it makes sense to use excentric labels as selection menus. Pressing a control key - or the right mouse “menu” button if it is not used in the application, can temporarily “freeze” the excentric labeling, free the cursor, and allow users to select any of the labels instead.
Furthermore, if objects are so numerous that only a subset is shown with the excentric labels, the temporary menu can become a scrolling list, guarantying access to all objects in the focus area.
OTHER OPTIONS TO CONSIDER
Depending on the application, several options might be considered:
• Changing the size and shape of the focus area can be allowed, either at the user’s initiative, or dynamically as a function of the label density (with the condition that the automatic size change would be very noticeable);
• When too many items are in the focus area, excentric labels can show not only the number of objects but also a glyph or bar chart summarizing the contents of the area (e.g., showing the color distribution of the points in the focus).
• Labels can inherit more graphic attributes from the objects they reference, as is often done in cartography. We show examples where the color of the label border matches the object’s color. But text font size, style or color can also be used if clear coding conventions exist and if adequate readability is preserved.
USE WITHIN EXISTING VISUALIZATION APPLICATIONS
We have implemented excentric labels within three different applications: a Java version of starfield display/dynamic query visualization [11] (Figure 7), a Java implementation of LifeLines [6–7] (Figure 9), and a map applet to be used for searching people in a building. The addition of excentric labeling to the first two applications was done in a few hours. The last program was built from scratch as an evaluation tool.

Figure 7 Excentric labeling seemed effective in a Java implementation of a starfield/dynamic query environment similar to the FilmFinder [11], or the Spotfire commercial product derived from it (www.spotfire.com). Excentric labeling provides a rapid way to review the names of the data objects and to fathom the density of the overlapping areas.

Figure 9 Map with a section of the building dynamically labeled. This application is being used to compare excentric labeling with a plain zooming interface when performing tasks that require the review of many labels.
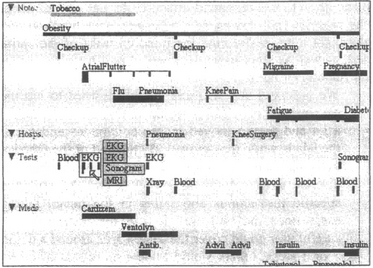
Figure 8 In LifeLines, [6–7] excentric labeling can be useful as it guarantees that all events in the focus area are labeled, even if events overlap. Chronological order is best for ordering labels, reinforced by color coding. In this example, the focus area is a small rectangle (i.e. a time range), only one column is used and there are no connecting lines. The label background is yellow to make them more visible.
EVALUATION
Excentric labeling is not meant to replace other labeling techniques but to complement them. Depending on the task, users may chose to use one or another technique. For example, to see the label of a single object, the infotip works well. To review in detail an area of the screen, zooming will be best to increase the resolution of the objects and also reveal more labels. But to quickly gain an understanding or the composition of one or several areas of interest, the infotip become tedious, the zoom may never reveal overlapping objects and the deformations are potentially disorienting as all objects have to move. In those conditions the excentric labels might become a useful addition. On the other hand it is a new feature that requires time to learn and may be found distractive.
Comparing labeling techniques is a challenge because of the many parameters involved. Screen size, zooming ratio, zooming speed, size of the excentric focus area, deformation rate, etc. would have a strong influence on the usefulness of the techniques. Making them all variables of a giant experiment would not be practical. Therefore we chose to focus our evaluation on a series of usability observations linked to an informal experiment in which we compare excentric labeling with a “virtual” instantaneous zoom. We choose to compare with a zoom because it is a very commonly used general technique.
We used the application shown in Figure 9. The map of a building is displayed with names assigned randomly to offices. Subjects have to determine if a given name appears next to one of three red dots shown on the map. This task simulates a situation where users have already identified areas of interest (e.g., areas close to both vending machines and printers, or close to the secretaries offices) and they are now looking for an empty space or someone they know close to those points. A similar situation might be users looking at the names of objects in clusters revealed on visualization.
The questions asked were of the form: “is <the name> in the neighborhood of one of the red dots?” Subjects reply by selecting “yes” or “no”. Subjects were told that the names either didn’t exist at all, or were within one or two offices from the dots. The technique was quickly demo-ed, users could practice with four tasks and ask questions before the timed part of the experiment started. The time to perform each task and the number of errors were recorded. The total test lasted about 30 minutes per subject.
Subjects using excentric labels (Figure 9) had to move the cursor over and around each highlighted point and read the labels. Subjects using the zooming interface had to move the cursor over each highlighted point, left click to zoom until they can read the labels (2 or 3 zoom operations), right click to zoom back out and/or pan to the next point. The zoom was reset before the next task started.
In the Java application a zoom or pan takes about 3/4 seconds to redraw, this lead to a four time speed advantage for the excentric labels over the zoom in our first pilot test, and was dependant on the speed of the CPU. Our redraw time is representative of many zooming interfaces, but in order to avoid any obvious bias in favor of the excentric labeling, we chose to run the final test ignoring all redraw time, i.e. the clock was stopped during all redraws in the zooming interface version. We could have made the excentric labeling technique better for the task by making the focus area larger to “fit” the region users needed to search but we deliberately made it smaller, so that we could observe users browsing by having to move the cursor around the area. Overall we tried to simulate a fair and interesting situation to observe and verify the existence of speed improvements.
Eight subjects performed eight tasks for each interface. Task sets and order was counterbalanced. For six of the eight tasks the name could be found near the dots, while for the two other tasks, the name didn’t exist.
Results
For the six “bounded” tasks where the name could be found there was about a 60% speed advantage for the excentric labels over the “virtual instantaneous zoom”. The average time to complete the six tasks was significantly faster (p<0.005) with excentric labeling than with the virtual instantaneous zoom [Figure 10]. Of course the advantage would have been even much larger if we had counted the delays of the zooms and pans (an average of 10 per task, so 30 to 60 sec. additional time).
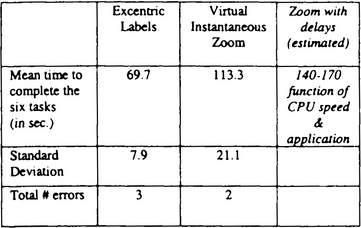
Figure 10a Comparison of mean time for eight users to complete the tasks (see Figure 10b)

Figure 10b Comparison of mean time for eight users to complete the 6 tasks where the names were found, for excentric labels, and for a virtual instantaneous zoom with all redraw delays removed. Any delay in zooming and panning would further increase the effect in favor of excentric labeling.
For the tasks where the searched name did not exist, there was so much variation among the eight subjects that a conclusion could not be made in this small study. Some users gave up rapidly while other searched for a long time. Both interfaces had a small number of errors (2 for zoom, 3 for excentric).
In addition to this measured effect, more was learned about the benefits and drawbacks of the interfaces by observing the eight users performing the hundred tasks of the entire test, as well as other users who helped polish the procedure by running earlier tests.
– We observed that all users quickly learned to use the excentric labels. Users would at first move the cursor a lot and seem annoyed by the continuous updates of the labels while they moved. By the end of the practice most had already stabilized their cursor, hopping in discrete steps around the red dots (we did not give specific instructions about this in the demo, letting users finds the best way to use the interface). A careful user could cover the search area around a dot in 2 or 3 steps, others would review more sets of labels by stopping in more places. Several users said that they realized they were looking at the same labels several times.
– Unsurprisingly, we observed that with the zoom interface users (who were all computer users) were already comfortable with the zoom technique. Many complained about the number of operations required to complete the tasks. Most users got lost at least once while panning and had to zoom out to find the red dots they had lost. They often over-zoomed and had to back up. On the other hand, when correctly zoomed and centered there were no problems.
– Users were encouraged to “think-aloud” but generated comments only during the training phase and following the test. Comments tell the stories:
– Zoom: “I feel comfortable doing that, it’s like yahoo’s maps”, “Where is that dot? I thought I would find it by panning there.” “Oops, wrong way”, “Once I am zoomed I feel confident I am looking at the right offices”, “All that zooming is tiring”. Excentric: “Ho, I like that”, “It’s hard to know what changed when I move the cursor”. “It’s better to stop moving”. “I probably look at too many labels”. “It would be nice if the neighborhood I am searching fit entirely in the circle”. “I like the way it shows me that there are so many people here while I could not tell by just looking at the map”.
– One user nicely compared the techniques by saying: “With the zoom I am confident that I read only the names in the right offices, but with the excentric label I can more easily go re-check the previous dots. We did observe that, in the tasks where the searched name did not exist, users went back to check the dots with excentric labels, while fewer did it with the zoom, or it took them a very long time.
CONCLUSION
Despite the numerous techniques found in visualization systems to label the graphical objects of the display, labeling remains a challenging problem for information visualization. We believe that excentric labeling provides a novel way for users to rapidly explore objects descriptions once patterns have been found in the display and effectively extract meaning from information visualization. Early evaluation results are promising. Users rapidly learn to use the excentric labels and stop the cursor to read the labels. A significant speed improvement was measured over a zoom interface for tasks requiring the rapid review of large numbers of labels. Finally we have demonstrated that the technique can easily be combined with a variety of applications, making excentric labels a promising new feature for information visualization environments.
ACKNOWLEDGEMENT
This work was started while Jean-Daniel Fekete visited the University of Maryland during the summer 1998. We thank all members of the HCIL lab for their constructive feedback, especially Julia Li for her initial research of the labeling problem and implementation in LifeLines, and Ben Shneiderman for suggesting the main-axis projection. David Doermann nicely allowed us to use his Java implementation of the starfield/dynamic query environment. This work was supported in part by IBM through the Shared University Research (SUR) program.
DEMONSTRATION
Excentric labeling is implemented in Java. A demo program can be found at http://www.cs.umbc.edu/hcil/excentric
References
1. Card, S., Mackinlay, J., Shneiderman, Ben. Readings in Information Visualization: Using Vision to Think. Morgan Kaufmann Publishers; 1999.
2. Cleveland, William. Visualizing Data. San Francisco: Hobart Press; 1993.
3. Lindwarm-Alonso, D., Rose, A., Plaisant, C., Norman, K. Viewing personal history records: A comparison of tabular format and graphical presentation using LifeLines. Behaviour & Information Technology. 1998; 17(5):249–262.
4. Christensen J., Marks J., Shieber S. Labeling point features on map and diagrams, to appear in ACM Transactions on Graphics.
5. Bederson, Ben B., Hollan, James D., PAD++: A zooming graphical user interface for exploring alternate interface physics. Proceedings of UIST ’94. 1994:17–27.
6. Plaisant, Catherine, Rose, Anne, Milash, Brett, Widoff, Seth, Shneiderman, Ben. LifeLines: Visualizing personal histories. Proc. of ACM CHI96 Conference: Human Factors in Computing Systems. ACM: Summit, NJ, 1996:221–227. Plaisant, Catherine, Rose, Anne, Milash, Brett, Widoff, Seth, Shneiderman, Ben, LifeLines: Visualizing personal histories. In: Proc. of ACM CHI96 Conference: Human Factors in Computing Systems. New York, NY: ACM; 1996:518.
7. Plaisant, C., Mushlin, R., Snyder, A., Li, J., Heller, D., Shneiderman, B., LifeLines: Using visualization to enhance navigation and analysis of patient records. Proc. of 1998 American Medical Informatics Association Annual Fall Symposium. 1998. AMIA, New York, NY, 1998:76–80.
8. Chalmers M., Ingram R. & Pfranger C., Adding imageability features to information displays, Proc. UIST’96, 33–39, ACM.
9. Lamping, John, Rao, Ramana, Pirolli, Peter. A focus + context technique based on hyperbolic geometry for visualizing large hierarchies. In: Proc. of ACM CHI’95 Conference: Human Factors in Computing Systems. Bethesda, MD: ACM; 1995:401–408.
10. Nation, D. A., Plaisant, C., Marchionini, G., Komlodi, A., Visualizing websites using a hierarchical table of contents browser: WebTOC. Proc. 3rd Conference on Human Factors and the Web. Denver, CO June, 1997.
11. + color plates Ahlberg, Christopher, Shneiderman, Ben. Visual information seeking: Tight coupling of dynamic query filters with starfield displays. In: Proc. CHI’94 Conference: Human Factors in Computing Systems. New York, NY: ACM; 1994:313–321.
12. March Plaisant, C., Carr, D., Shneiderman, B. Image-browser taxonomy and guidelines for designers. IEEE Software. 1995; 12(2):21–32.
13. Stone, M., Fishkin, K., Bier, E. The moveable filter as a user interface. In: Proc. CHI’94. New York, NY: ACM; 1994:306–312.
1The name 〈 excentric 〉 comes from this technique which was the first implemented. The name is meant to evoke the center origin of the lines and the unconventional look of the widget. It is an accepted old spelling of eccentric, and close to the French spelling 〈 excentrique 〉.